- Page 1 and 2: 280 Topics in Current Chemistry Edi
- Page 3 and 4: Photochemistry and Photophysics of
- Page 5 and 6: Volume Editors Prof. Vincenzo Balza
- Page 7 and 8: Topics in Current Chemistry Also Av
- Page 9 and 10: X Preface nation Compounds. The ven
- Page 11 and 12: Contents Photochemistry and Photoph
- Page 13 and 14: Top Curr Chem (2007) 280: 1-36 DOI
- Page 15 and 16: Photochemistry and Photophysics of
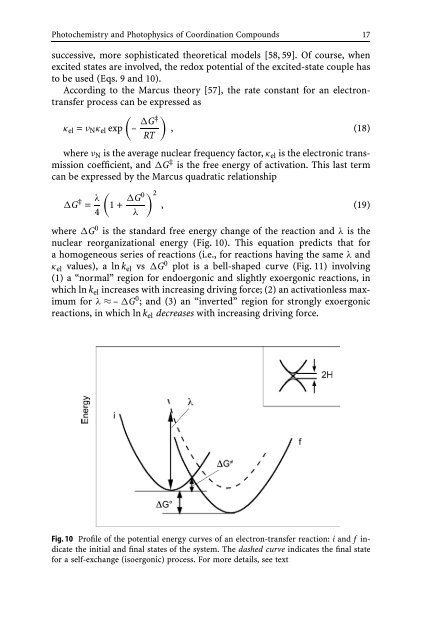
- Page 17 and 18: Photochemistry and Photophysics of
- Page 19 and 20: Photochemistry and Photophysics of
- Page 21 and 22: Photochemistry and Photophysics of
- Page 23 and 24: Photochemistry and Photophysics of
- Page 25 and 26: Photochemistry and Photophysics of
- Page 27: Photochemistry and Photophysics of
- Page 31 and 32: Photochemistry and Photophysics of
- Page 33 and 34: Photochemistry and Photophysics of
- Page 35 and 36: Photochemistry and Photophysics of
- Page 37 and 38: Photochemistry and Photophysics of
- Page 39 and 40: Photochemistry and Photophysics of
- Page 41 and 42: Photochemistry and Photophysics of
- Page 43 and 44: Photochemistry and Photophysics of
- Page 45 and 46: Photochemistry and Photophysics of
- Page 47 and 48: Photochemistry and Photophysics of
- Page 49 and 50: Top Curr Chem (2007) 280: 37-67 DOI
- Page 51 and 52: Photochemistry and Photophysics of
- Page 53 and 54: Photochemistry and Photophysics of
- Page 55 and 56: Photochemistry and Photophysics of
- Page 57 and 58: Photochemistry and Photophysics of
- Page 59 and 60: Photochemistry and Photophysics of
- Page 61 and 62: Photochemistry and Photophysics of
- Page 63 and 64: Photochemistry and Photophysics of
- Page 65 and 66: Photochemistry and Photophysics of
- Page 67 and 68: Photochemistry and Photophysics of
- Page 69 and 70: Photochemistry and Photophysics of
- Page 71 and 72: Photochemistry and Photophysics of
- Page 73 and 74: Photochemistry and Photophysics of
- Page 75 and 76: Photochemistry and Photophysics of
- Page 77 and 78: Photochemistry and Photophysics of
- Page 79 and 80:
Photochemistry and Photophysics of
- Page 81 and 82:
70 N. Armaroli et al. (e.g. catenan
- Page 83 and 84:
72 N. Armaroli et al. can be classi
- Page 85 and 86:
74 N. Armaroli et al. Fig. 2 Qualit
- Page 87 and 88:
76 N. Armaroli et al. Fig. 3 Theblu
- Page 89 and 90:
78 N. Armaroli et al. In the CuA mi
- Page 91 and 92:
80 N. Armaroli et al. pseudo-rotaxa
- Page 93 and 94:
82 N. Armaroli et al. Fig. 11 Relat
- Page 95 and 96:
84 N. Armaroli et al. Fig. 13 Absor
- Page 97 and 98:
86 N. Armaroli et al. leading to a
- Page 99 and 100:
88 N. Armaroli et al. Fig. 18 Trans
- Page 101 and 102:
90 N. Armaroli et al. Fig. 20 Ligan
- Page 103 and 104:
92 N. Armaroli et al. Fig. 22 Ligan
- Page 105 and 106:
94 N. Armaroli et al. tionalized de
- Page 107 and 108:
96 N. Armaroli et al. Fig. 24 Absor
- Page 109 and 110:
98 N. Armaroli et al. prisingly, PP
- Page 111 and 112:
100 N. Armaroli et al. A different
- Page 113 and 114:
102 N. Armaroli et al. Cuprous clus
- Page 115 and 116:
104 N. Armaroli et al. Fig. 32 Sche
- Page 117 and 118:
106 N. Armaroli et al. Fig. 34 A te
- Page 119 and 120:
108 N. Armaroli et al. which are va
- Page 121 and 122:
110 N. Armaroli et al. Acknowledgem
- Page 123 and 124:
112 N. Armaroli et al. 58. Miller M
- Page 125 and 126:
114 N. Armaroli et al. 123. Armarol
- Page 127 and 128:
Top Curr Chem (2007) 280: 117-214 D
- Page 129 and 130:
Photochemistry and Photophysics of
- Page 131 and 132:
Photochemistry and Photophysics of
- Page 133 and 134:
Photochemistry and Photophysics of
- Page 135 and 136:
Photochemistry and Photophysics of
- Page 137 and 138:
Photochemistry and Photophysics of
- Page 139 and 140:
Photochemistry and Photophysics of
- Page 141 and 142:
Photochemistry and Photophysics of
- Page 143 and 144:
Photochemistry and Photophysics of
- Page 145 and 146:
Photochemistry and Photophysics of
- Page 147 and 148:
Photochemistry and Photophysics of
- Page 149 and 150:
Photochemistry and Photophysics of
- Page 151 and 152:
Photochemistry and Photophysics of
- Page 153 and 154:
Photochemistry and Photophysics of
- Page 155 and 156:
Photochemistry and Photophysics of
- Page 157 and 158:
Photochemistry and Photophysics of
- Page 159 and 160:
Photochemistry and Photophysics of
- Page 161 and 162:
Photochemistry and Photophysics of
- Page 163 and 164:
Photochemistry and Photophysics of
- Page 165 and 166:
Photochemistry and Photophysics of
- Page 167 and 168:
Photochemistry and Photophysics of
- Page 169 and 170:
Photochemistry and Photophysics of
- Page 171 and 172:
Photochemistry and Photophysics of
- Page 173 and 174:
Photochemistry and Photophysics of
- Page 175 and 176:
Photochemistry and Photophysics of
- Page 177 and 178:
Photochemistry and Photophysics of
- Page 179 and 180:
Photochemistry and Photophysics of
- Page 181 and 182:
Photochemistry and Photophysics of
- Page 183 and 184:
Photochemistry and Photophysics of
- Page 185 and 186:
Photochemistry and Photophysics of
- Page 187 and 188:
Photochemistry and Photophysics of
- Page 189 and 190:
Photochemistry and Photophysics of
- Page 191 and 192:
Photochemistry and Photophysics of
- Page 193 and 194:
Photochemistry and Photophysics of
- Page 195 and 196:
Photochemistry and Photophysics of
- Page 197 and 198:
Photochemistry and Photophysics of
- Page 199 and 200:
Photochemistry and Photophysics of
- Page 201 and 202:
Photochemistry and Photophysics of
- Page 203 and 204:
Photochemistry and Photophysics of
- Page 205 and 206:
Photochemistry and Photophysics of
- Page 207 and 208:
Photochemistry and Photophysics of
- Page 209 and 210:
Photochemistry and Photophysics of
- Page 211 and 212:
Photochemistry and Photophysics of
- Page 213 and 214:
Photochemistry and Photophysics of
- Page 215 and 216:
Photochemistry and Photophysics of
- Page 217 and 218:
Photochemistry and Photophysics of
- Page 219 and 220:
Photochemistry and Photophysics of
- Page 221 and 222:
Photochemistry and Photophysics of
- Page 223 and 224:
Photochemistry and Photophysics of
- Page 225 and 226:
Top Curr Chem (2007) 280: 215-255 D
- Page 227 and 228:
Photochemistry and Photophysics of
- Page 229 and 230:
Photochemistry and Photophysics of
- Page 231 and 232:
Photochemistry and Photophysics of
- Page 233 and 234:
Photochemistry and Photophysics of
- Page 235 and 236:
Photochemistry and Photophysics of
- Page 237 and 238:
Photochemistry and Photophysics of
- Page 239 and 240:
Photochemistry and Photophysics of
- Page 241 and 242:
Photochemistry and Photophysics of
- Page 243 and 244:
Photochemistry and Photophysics of
- Page 245 and 246:
Photochemistry and Photophysics of
- Page 247 and 248:
Photochemistry and Photophysics of
- Page 249 and 250:
Photochemistry and Photophysics of
- Page 251 and 252:
Photochemistry and Photophysics of
- Page 253 and 254:
Photochemistry and Photophysics of
- Page 255 and 256:
Photochemistry and Photophysics of
- Page 257 and 258:
Photochemistry and Photophysics of
- Page 259 and 260:
Photochemistry and Photophysics of
- Page 261 and 262:
Photochemistry and Photophysics of
- Page 263 and 264:
Photochemistry and Photophysics of
- Page 265 and 266:
Photochemistry and Photophysics of
- Page 267 and 268:
258 Author Index Volumes 251-280 Be
- Page 269 and 270:
260 Author Index Volumes 251-280 Er
- Page 271 and 272:
262 Author Index Volumes 251-280 Je
- Page 273 and 274:
264 Author Index Volumes 251-280 Me
- Page 275 and 276:
266 Author Index Volumes 251-280 Sa
- Page 277 and 278:
268 Author Index Volumes 251-280 Vi
- Page 279 and 280:
Subject Index Alkyne bridges 148 An
- Page 281:
Subject Index 273 Rh(III) cyclometa