Confidence Intervals and Hypothesis Tests: Two Samples - Florida ...
Confidence Intervals and Hypothesis Tests: Two Samples - Florida ...
Confidence Intervals and Hypothesis Tests: Two Samples - Florida ...

You also want an ePaper? Increase the reach of your titles
YUMPU automatically turns print PDFs into web optimized ePapers that Google loves.
STATSprofessor.com<br />
Chapter 9<br />
be able to detect if the scores for students taking the FCAT math section improve after completing a<br />
series of FCAT prep classes.<br />
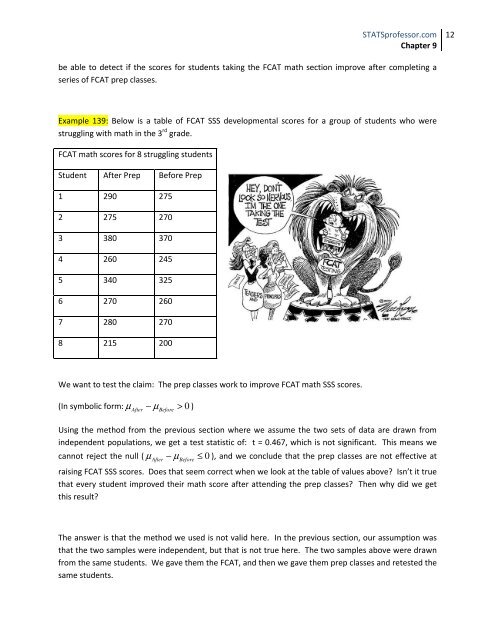
Example 139: Below is a table of FCAT SSS developmental scores for a group of students who were<br />
struggling with math in the 3 rd grade.<br />
FCAT math scores for 8 struggling students<br />
Student After Prep Before Prep<br />
1 290 275<br />
2 275 270<br />
3 380 370<br />
4 260 245<br />
5 340 325<br />
6 270 260<br />
7 280 270<br />
8 215 200<br />
We want to test the claim: The prep classes work to improve FCAT math SSS scores.<br />
(In symbolic form: µ − µ > 0 )<br />
After Before<br />
Using the method from the previous section where we assume the two sets of data are drawn from<br />
independent populations, we get a test statistic of: t = 0.467, which is not significant. This means we<br />
cannot reject the null ( µ − µ ≤ 0 ), <strong>and</strong> we conclude that the prep classes are not effective at<br />
After Before<br />
raising FCAT SSS scores. Does that seem correct when we look at the table of values above? Isn’t it true<br />
that every student improved their math score after attending the prep classes? Then why did we get<br />
this result?<br />
The answer is that the method we used is not valid here. In the previous section, our assumption was<br />
that the two samples were independent, but that is not true here. The two samples above were drawn<br />
from the same students. We gave them the FCAT, <strong>and</strong> then we gave them prep classes <strong>and</strong> retested the<br />
same students.<br />
12