Confidence Intervals and Hypothesis Tests: Two Samples - Florida ...
Confidence Intervals and Hypothesis Tests: Two Samples - Florida ...
Confidence Intervals and Hypothesis Tests: Two Samples - Florida ...

You also want an ePaper? Increase the reach of your titles
YUMPU automatically turns print PDFs into web optimized ePapers that Google loves.
STATSprofessor.com<br />
Chapter 9<br />
9.11 <strong>Hypothesis</strong> Test to Compare <strong>Two</strong> Population Variances: Independent Sampling<br />
Comparing <strong>Two</strong> Population Variances: Independent Sampling<br />
There are a lot of situations where we want to know if the populations have the same variances. In fact,<br />
we just studied hypothesis testing methods for comparing two means from independent populations. In<br />
that section when the sample sizes were small we needed to assume either that the population<br />
variances were equal or that they weren’t, but with the test we learn here today, we won’t have to<br />
assume. At other times, we will actually want to compare the variances of two groups for its own sake<br />
instead of just performing the test to know if we can go forward with a test of the means. The following<br />
is an example of the latter type of problem:<br />
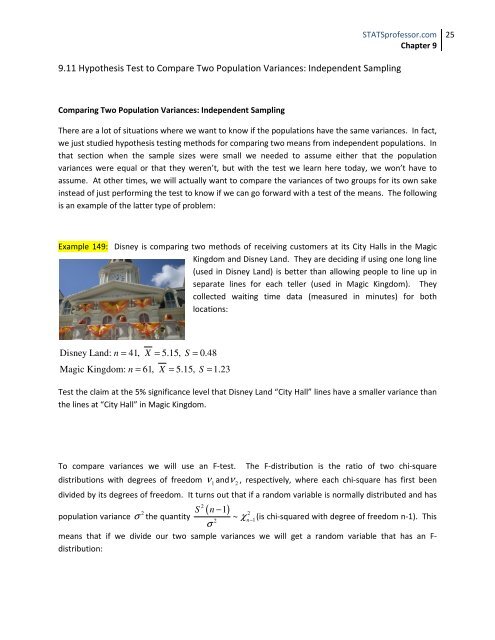
Example 149: Disney is comparing two methods of receiving customers at its City Halls in the Magic<br />
Kingdom <strong>and</strong> Disney L<strong>and</strong>. They are deciding if using one long line<br />
(used in Disney L<strong>and</strong>) is better than allowing people to line up in<br />
separate lines for each teller (used in Magic Kingdom). They<br />
collected waiting time data (measured in minutes) for both<br />
locations:<br />
Disney L<strong>and</strong>: n = 41, X = 5.15, S = 0.48<br />
Magic Kingdom: n = 61, X = 5.15, S = 1.23<br />
Test the claim at the 5% significance level that Disney L<strong>and</strong> “City Hall” lines have a smaller variance than<br />
the lines at “City Hall” in Magic Kingdom.<br />
To compare variances we will use an F-test. The F-distribution is the ratio of two chi-square<br />
distributions with degrees of freedom ν1 <strong>and</strong>ν 2 , respectively, where each chi-square has first been<br />
divided by its degrees of freedom. It turns out that if a r<strong>and</strong>om variable is normally distributed <strong>and</strong> has<br />
population variance<br />
2<br />
σ the quantity<br />
( − )<br />
2<br />
S n<br />
2<br />
σ<br />
1<br />
~ χn<br />
2<br />
−1<br />
(is chi-squared with degree of freedom n-1). This<br />
means that if we divide our two sample variances we will get a r<strong>and</strong>om variable that has an Fdistribution:<br />
25