Confidence Intervals and Hypothesis Tests: Two Samples - Florida ...
Confidence Intervals and Hypothesis Tests: Two Samples - Florida ...
Confidence Intervals and Hypothesis Tests: Two Samples - Florida ...

Create successful ePaper yourself
Turn your PDF publications into a flip-book with our unique Google optimized e-Paper software.
STATSprofessor.com<br />
Chapter 9<br />
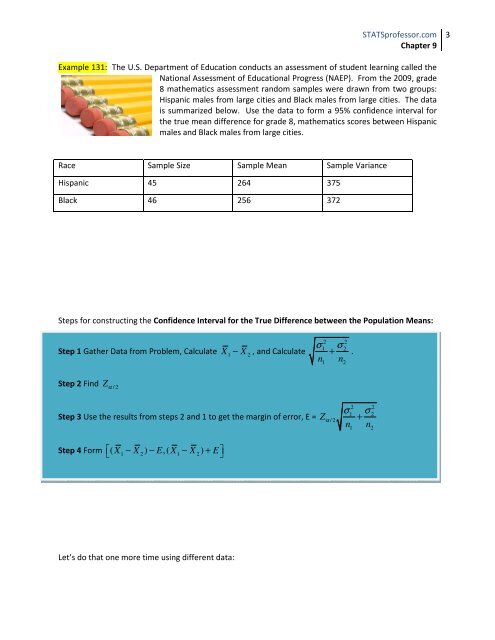
Example 131: The U.S. Department of Education conducts an assessment of student learning called the<br />
National Assessment of Educational Progress (NAEP). From the 2009, grade<br />
8 mathematics assessment r<strong>and</strong>om samples were drawn from two groups:<br />
Hispanic males from large cities <strong>and</strong> Black males from large cities. The data<br />
is summarized below. Use the data to form a 95% confidence interval for<br />
the true mean difference for grade 8, mathematics scores between Hispanic<br />
males <strong>and</strong> Black males from large cities.<br />
Race Sample Size Sample Mean Sample Variance<br />
Hispanic 45 264 375<br />
Black 46 256 372<br />
Steps for constructing the <strong>Confidence</strong> Interval for the True Difference between the Population Means:<br />
Step 1 Gather Data from Problem, Calculate X1 − X 2 , <strong>and</strong> Calculate<br />
Step 2 Find Zα / 2<br />
Step 3 Use the results from steps 2 <strong>and</strong> 1 to get the margin of error, E = Z<br />
⎡⎣ ( X − X ) − E,( X − X ) + E⎤⎦<br />
Step 4 Form 1 2 1 2<br />
Let’s do that one more time using different data:<br />
2 2<br />
σ1 σ 2 + .<br />
n n<br />
1 2<br />
α / 2<br />
σ σ<br />
+<br />
n n<br />
2 2<br />
1 2<br />
1 2<br />
3