Confidence Intervals and Hypothesis Tests: Two Samples - Florida ...
Confidence Intervals and Hypothesis Tests: Two Samples - Florida ...
Confidence Intervals and Hypothesis Tests: Two Samples - Florida ...

Create successful ePaper yourself
Turn your PDF publications into a flip-book with our unique Google optimized e-Paper software.
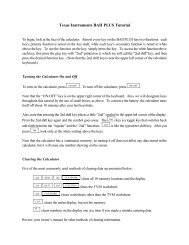
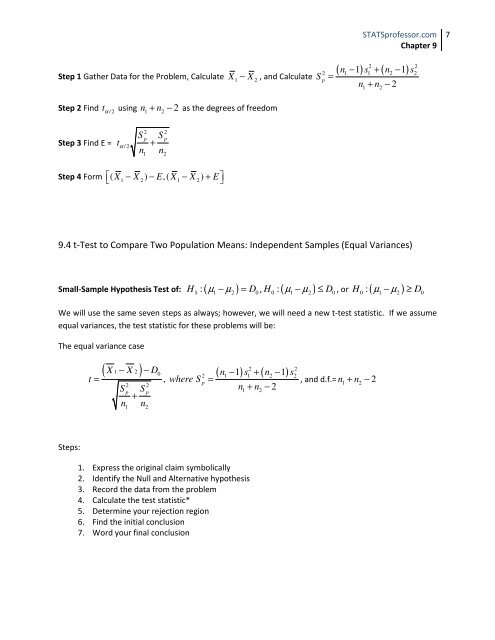
Step 1 Gather Data for the Problem, Calculate X1 − X 2 , <strong>and</strong> Calculate<br />
Step 2 Find / 2<br />
Step 3 Find E =<br />
tα using n1 + n2<br />
− 2 as the degrees of freedom<br />
S S<br />
2 2<br />
p p<br />
α / 2 +<br />
n1 n2<br />
t<br />
⎡⎣ ( X − X ) − E,( X − X ) + E⎤⎦<br />
Step 4 Form 1 2 1 2<br />
S<br />
2<br />
p<br />
=<br />
STATSprofessor.com<br />
Chapter 9<br />
( − 1) + ( −1)<br />
n s n s<br />
2 2<br />
1 1 2 2<br />
n + n − 2<br />
1 2<br />
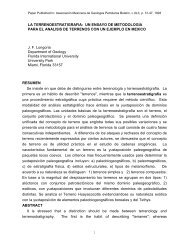
9.4 t-Test to Compare <strong>Two</strong> Population Means: Independent <strong>Samples</strong> (Equal Variances)<br />
Small-Sample <strong>Hypothesis</strong> Test of: H : ( µ − µ ) = D , H : ( µ − µ ) ≤ D , or : ( µ µ )<br />
0 1 2 0<br />
0 1 2 0<br />
H − ≥ D<br />
0 1 2 0<br />
We will use the same seven steps as always; however, we will need a new t-test statistic. If we assume<br />
equal variances, the test statistic for these problems will be:<br />
The equal variance case<br />
Steps:<br />
( − ) − ( − 1) + ( −1)<br />
X X D n s n s<br />
t = where S =<br />
1 2<br />
2 2<br />
0 2 1 1 2 2<br />
,<br />
2 2<br />
p<br />
S n1 n2<br />
2<br />
p S<br />
+ −<br />
p<br />
+<br />
n n<br />
1 2<br />
1. Express the original claim symbolically<br />
2. Identify the Null <strong>and</strong> Alternative hypothesis<br />
3. Record the data from the problem<br />
4. Calculate the test statistic*<br />
5. Determine your rejection region<br />
6. Find the initial conclusion<br />
7. Word your final conclusion<br />
, <strong>and</strong> d.f.= n1 + n2<br />
− 2<br />
7