Confidence Intervals and Hypothesis Tests: Two Samples - Florida ...
Confidence Intervals and Hypothesis Tests: Two Samples - Florida ...
Confidence Intervals and Hypothesis Tests: Two Samples - Florida ...

You also want an ePaper? Increase the reach of your titles
YUMPU automatically turns print PDFs into web optimized ePapers that Google loves.
Steps to determine the critical value for an F-test:<br />
a. Determine the number of tails <strong>and</strong> alpha (divide alpha<br />
in half if two-tails)<br />
b. Determine the table to use based on step a.<br />
c. Use the numerator degree of freedom for the top row<br />
of table <strong>and</strong> the denominator degree of freedom for<br />
the left column of the table.<br />
STATSprofessor.com<br />
Chapter 9<br />
6. Find the initial conclusion: Reject the null, support the alternative<br />
7. Word your final conclusion: The sample data support the claim that the waiting times at Disney<br />
L<strong>and</strong> have less variance than the waiting times at Magic Kingdom.<br />
Assumptions for the above test:<br />
1. The samples are r<strong>and</strong>om <strong>and</strong> independent<br />
2. Both populations are normally distributed (the test is very sensitive to violations of this<br />
assumption.)<br />
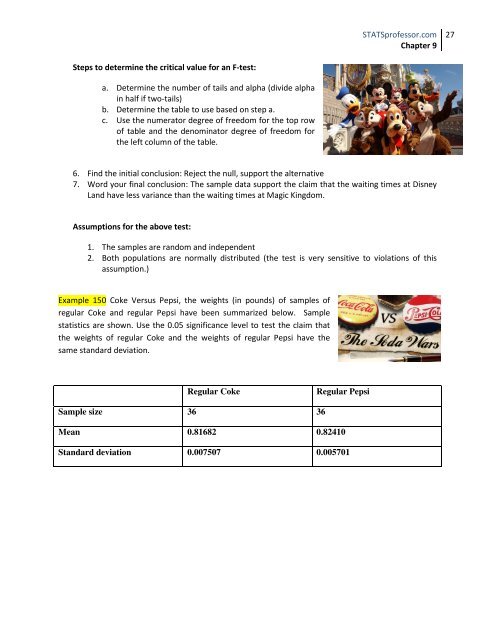
Example 150 Coke Versus Pepsi, the weights (in pounds) of samples of<br />
regular Coke <strong>and</strong> regular Pepsi have been summarized below. Sample<br />
statistics are shown. Use the 0.05 significance level to test the claim that<br />
the weights of regular Coke <strong>and</strong> the weights of regular Pepsi have the<br />
same st<strong>and</strong>ard deviation.<br />
Regular Coke Regular Pepsi<br />
Sample size 36 36<br />
Mean 0.81682 0.82410<br />
St<strong>and</strong>ard deviation 0.007507 0.005701<br />
27