Confidence Intervals and Hypothesis Tests: Two Samples - Florida ...
Confidence Intervals and Hypothesis Tests: Two Samples - Florida ...
Confidence Intervals and Hypothesis Tests: Two Samples - Florida ...
You also want an ePaper? Increase the reach of your titles
YUMPU automatically turns print PDFs into web optimized ePapers that Google loves.
STATSprofessor.com<br />
Chapter 9<br />
9.8 <strong>Confidence</strong> Interval to Compare <strong>Two</strong> Population Means: Matched-Pair Experiments<br />
The procedure to construct a confidence interval for data from a Matched-Pair Experiment involves the<br />
same approach that we used in our earlier work with the hypothesis test. We will first need to find all of<br />
the before – after differences.<br />
<strong>Confidence</strong> Interval for Paired Differences:<br />
Required assumptions:<br />
⎡ Sd S ⎤<br />
d<br />
⎢X d − tα / 2 , X d + tα<br />
/ 2 ⎥<br />
⎢⎣ nd nd<br />
⎥⎦<br />
1. We must assume that the sample was chosen r<strong>and</strong>omly from the target population.<br />
2. We must assume that the population of differences has a normal distribution.<br />
Steps to Form a <strong>Confidence</strong> Interval for Matched-Pairs Data:<br />
Step 1 Use subtraction to create your set of differences <strong>and</strong> determine , ,<br />
d d d<br />
level.<br />
Step 2 Find tα /2<br />
Step 3 Use the results from steps 2 <strong>and</strong> 1 to get the margin of error, E = tα<br />
/2<br />
Step 4 Form ( X − E, X + E)<br />
d d<br />
n X S , <strong>and</strong> your confidence<br />
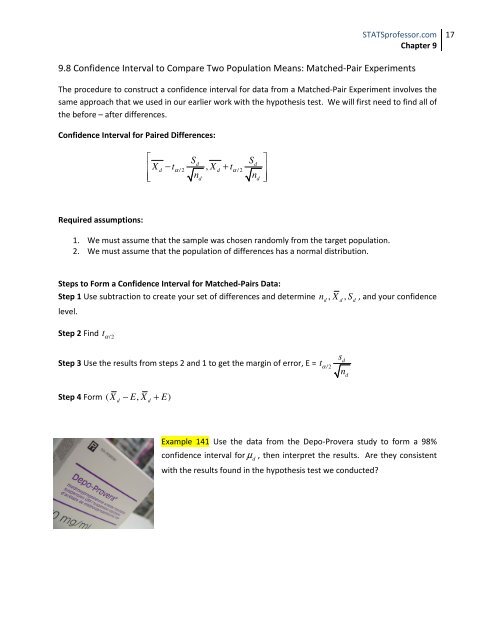
Example 141 Use the data from the Depo-Provera study to form a 98%<br />
confidence interval for µ d , then interpret the results. Are they consistent<br />
with the results found in the hypothesis test we conducted?<br />
s<br />
d<br />
n<br />
d<br />
17


