Electricity Ten Year Statement - National Grid
Electricity Ten Year Statement - National Grid
Electricity Ten Year Statement - National Grid

You also want an ePaper? Increase the reach of your titles
YUMPU automatically turns print PDFs into web optimized ePapers that Google loves.
2.4<br />
Generating capacity<br />
This section provides some more detail for<br />
the generation capacity backgrounds for the<br />
scenarios and outlines the key changes over the<br />
period to 2032 in each of the cases.<br />
2.4.1<br />
Generating Capacity<br />
Definition<br />
The values shown within this section are only<br />
for capacity that is classed as ‘transmission<br />
capacity’. This is generally generation capacity<br />
that is classified as ‘large’ 1 and therefore does<br />
not include any small embedded generation.<br />
Embedded generation not included in these<br />
values is accounted for in the assessment of<br />
transmission demand as discussed in the<br />
Section 2.3.<br />
Page 22<br />
2.4.2<br />
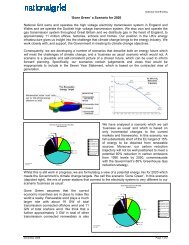
Slow Progression 2012<br />
This scenario has a lower emphasis on renewable<br />
generation over the period. The key messages for<br />
this scenario are shown below:<br />
Gas capacity increases over the period to 2020<br />
by 7 GW and to a total of 49 GW by 2032<br />
showing a total increase over the period of<br />
16 GW.<br />
Growth in wind capacity is considerably slower<br />
in this scenario in comparison to Gone Green<br />
and Accelerated Growth and reaches 13 GW<br />
by 2020 and 28 GW by 2032 (19 GW being<br />
offshore wind), showing a total increase over<br />
the period of approximately 22 GW (the vast<br />
majority of this being offshore wind).<br />
Other renewables excluding wind remain fairly<br />
static over the full period to 2032 showing only<br />
approximately a 300 MW increase.<br />
Coal capacity shows a slower decline than<br />
in the Gone Green scenario showing a<br />
7 GW decrease by 2020 leaving 18 GW<br />
of coal capacity. Between 2020 and 2032<br />
coal declines further, to 4 GW by the end of<br />
the period.<br />
Nuclear capacity remains fairly static over the<br />
period rising from 10 GW in 2012 to 13 GW by<br />
2030 before falling back to 11 GW by 2032.<br />
Figure 2.4.1 illustrates the capacity mix for<br />
Slow Progression;<br />
1 <strong>National</strong> <strong>Grid</strong>:<br />
What size is my power<br />
station classed as?<br />
www.nationalgrid.<br />
com/uk/<strong>Electricity</strong>/<br />
GettingConnected/FAQs/<br />
Question+12.htm