- Page 1: Electricity Ten Year Statement UK e
- Page 5 and 6: Contents Foreword /////////////////
- Page 7 and 8: future transmission reinforcement.
- Page 9 and 10: Falling fault levels on the system
- Page 11 and 12: Electricity Ten Year Statement Nove
- Page 13 and 14: 1.2 Methodology The document itself
- Page 15 and 16: The appendices include: System Sche
- Page 17 and 18: 2.1 Future Energy Scenarios Our ene
- Page 19 and 20: 2.3 Demand This section describes t
- Page 21 and 22: In Slow Progression, end-users’ p
- Page 23 and 24: Figure 2.4.1: Slow progression gene
- Page 25 and 26: Figure 2.4.3: Accelerated growth in
- Page 27 and 28: Figure 2.4.5: System development an
- Page 29 and 30: Figure 2.5.1: Contracted background
- Page 31 and 32: Figure 2.5.3: Scenario de-rated pla
- Page 33 and 34: 1 www.decc.gov.uk/en/ content/cms/m
- Page 35 and 36: The government review of ROC bandin
- Page 37 and 38: Figure 2.6.3: Offshore projects in
- Page 39 and 40: Figure 2.6.5: Onshore wind contract
- Page 41 and 42: Figure 2.6.7: Biomass contracted Vs
- Page 43 and 44: 2.8 Non-GB generation In addition t
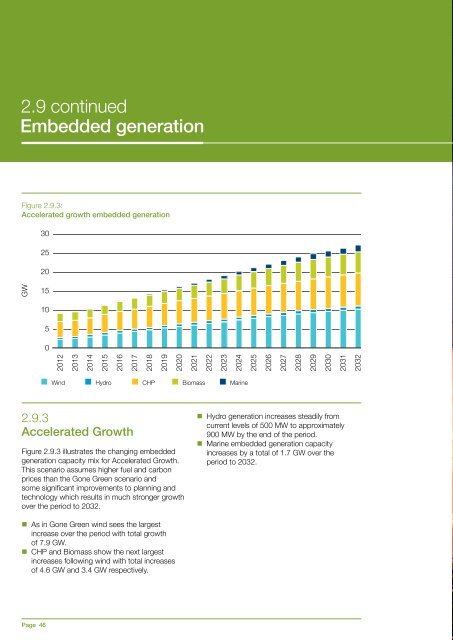
- Page 45: Figure 2.9.2: Gone green embedded g
- Page 49 and 50: 3.1 Introduction Electricity Ten Ye
- Page 51 and 52: 1 www.ofgem.gov. uk/Networks/Trans/
- Page 53 and 54: The boundary capability is then the
- Page 55 and 56: Co-ordinated designs have been deve
- Page 57 and 58: To manage this situation, we need t
- Page 59 and 60: 3.4.4 Opportunity Identification an
- Page 61 and 62: 3.4.5 Boundary Assessment in Transm
- Page 63 and 64: 3.4.7 Boundaries Assessed Local bou
- Page 65 and 66: 3.5 East Coast local boundaries 3.5
- Page 67 and 68: 2.3 Axioms 3.5.3 Boundary EC1 Figur
- Page 69 and 70: Table EC1.2: Reinforcement date for
- Page 71 and 72: Table EC3.1: List of potential rein
- Page 73 and 74: 3.5.5 Boundary EC5 Figure EC5.1: Ge
- Page 75 and 76: Figure EC5.2: Generation and capabi
- Page 77 and 78: Boundary Discussion and Opportuniti
- Page 79 and 80: Table EC7.1: List of potential rein
- Page 81 and 82: 3.6 North Wales local boundaries 3.
- Page 83 and 84: 3.6.3 Boundary NW1 Figure NW1.1: Ge
- Page 85 and 86: 1 Reinforcement date triggered by p
- Page 87 and 88: Table NW2.1: List of potential rein
- Page 89 and 90: 3.6.5 Boundary NW3 Figure NW3.1: Ge
- Page 91 and 92: 1 Reinforcement date triggered by p
- Page 93 and 94: Table NW4.1: List of potential rein
- Page 95 and 96: 3.7 Wider boundaries 3.7.1 Boundary
- Page 97 and 98:
Figure B1.2: Required transfer and
- Page 99 and 100:
Electricity Ten Year Statement Nove
- Page 101 and 102:
3.7.2 Boundary B2 Figure B2.1: Geog
- Page 103 and 104:
Figure B2.2: Required transfer and
- Page 105 and 106:
3.7.3 Boundary B3 Figure B3.1: Geog
- Page 107 and 108:
3.7.4 Boundary B4 Figure B4.1: Geog
- Page 109 and 110:
Figure B4.2: Required transfer and
- Page 111 and 112:
3.7.5 Boundary B5 Figure B5.1: Geog
- Page 113 and 114:
Table B5.2: Selection and timing of
- Page 115 and 116:
Table B6.1: List of potential reinf
- Page 117 and 118:
3.7.7 Boundary B7 Figure B7.1: Geog
- Page 119 and 120:
Figure B7.2: Required transfer and
- Page 121 and 122:
3.7.8 Boundary B7a Figure B7a.1: Ge
- Page 123 and 124:
Figure B7a.2: Required transfer and
- Page 125 and 126:
3.7.9 Boundary B8 Figure B8.1: Geog
- Page 127 and 128:
Changes in the capacity and geograp
- Page 129 and 130:
3.7.10 Boundary B9 Figure B9.1: Geo
- Page 131 and 132:
1 Reinforcement date triggered by p
- Page 133 and 134:
1 www.nationalgrid.com/uk/ Electric
- Page 135 and 136:
3.7.12 Boundary B11 Figure B11.1: G
- Page 137 and 138:
1 Reinforcement date triggered by p
- Page 139 and 140:
3.7.13 Boundary B12 Figure B12.1: G
- Page 141 and 142:
1 Reinforcement date triggered by p
- Page 143 and 144:
1 www.nationalgrid.com/uk/ Electric
- Page 145 and 146:
3.7.15 Boundary SC1 Figure SC 1.1:
- Page 147 and 148:
Table SC1.2: Selection and timing o
- Page 149 and 150:
Table B14.1: List of potential rein
- Page 151 and 152:
3.7.17 Boundary B14(e) Boundary B14
- Page 153 and 154:
In 2018 there is a proposal to conn
- Page 155 and 156:
Table B15.1: List of potential rein
- Page 157 and 158:
3.7.19 Boundary B16 Figure B16.1: G
- Page 159 and 160:
1 Reinforcement date triggered by p
- Page 161 and 162:
3.7.20 Boundary B17 Figure B17.1: G
- Page 163 and 164:
1 Reinforcement date triggered by p
- Page 165 and 166:
3.8.2 Inputs Future Energy Scenario
- Page 167 and 168:
The range of solutions identified w
- Page 169 and 170:
1 The Electricity Scenarios Illustr
- Page 171 and 172:
3.8.6 Development of current year o
- Page 173 and 174:
Figure 3.8.2: Stopping or delaying
- Page 175 and 176:
For regions where the boundary tran
- Page 177 and 178:
Table 3.8.5: Northern England trans
- Page 179 and 180:
Table 3.8.7: Northern England reinf
- Page 181 and 182:
Table 3.8.9: Lowest cost strategies
- Page 183 and 184:
East Coast and East Anglia Identifi
- Page 185 and 186:
Table 3.8.12: Lowest cost strategie
- Page 187 and 188:
The worst regrets for each of the o
- Page 189 and 190:
Table 3.8.15: Lowest cost strategie
- Page 191 and 192:
The worst regrets for each of the o
- Page 193 and 194:
Table 3.8.18: Lowest cost strategie
- Page 195 and 196:
1 www.legislation.gov.uk/ ukpga/200
- Page 197 and 198:
1 www.nationalgrid.com /NR/rdonlyre
- Page 199 and 200:
developed incrementally alongside t
- Page 201 and 202:
North Wales, South Wales and possib
- Page 203 and 204:
Table 3.12.1 It is expected that an
- Page 205 and 206:
The boundaries currently assessed r
- Page 207 and 208:
4.1 Introduction Electricity Ten Ye
- Page 209 and 210:
Figure 4.1.2: Gone green wind produ
- Page 211 and 212:
4.2 System operability Figure 4.2.1
- Page 213 and 214:
4.3 System design and operation cha
- Page 215 and 216:
Figure 4.3.3: System inertia change
- Page 217 and 218:
4.3.2 Impact on System Strength (Fa
- Page 219 and 220:
Figure 4.3.6: Fault level variation
- Page 221 and 222:
There are other factors which will
- Page 223 and 224:
Figure 4.3.9: Q/P ratio over a 24hr
- Page 225 and 226:
4.3.3 Power Flow Volatility In the
- Page 227 and 228:
Electricity Ten Year Statement Nove
- Page 229 and 230:
1 Impact of Intermittency, Poyry su
- Page 231 and 232:
1 Andersen, P., “Da stormen tog t
- Page 233 and 234:
4.4.2 Parallel Operation of AC and
- Page 235 and 236:
4.4.6 Energy Storage The storage of
- Page 237 and 238:
5.1 Introduction Electricity Ten Ye
- Page 239 and 240:
5.3 Stakeholder engagement The ETYS
- Page 241 and 242:
Electricity Ten Year Statement Nove
- Page 243 and 244:
Electricity Ten Year Statement Nove