LTI 20-20 UltraLyte 100 - Tele-Traffic
LTI 20-20 UltraLyte 100 - Tele-Traffic
LTI 20-20 UltraLyte 100 - Tele-Traffic

You also want an ePaper? Increase the reach of your titles
YUMPU automatically turns print PDFs into web optimized ePapers that Google loves.
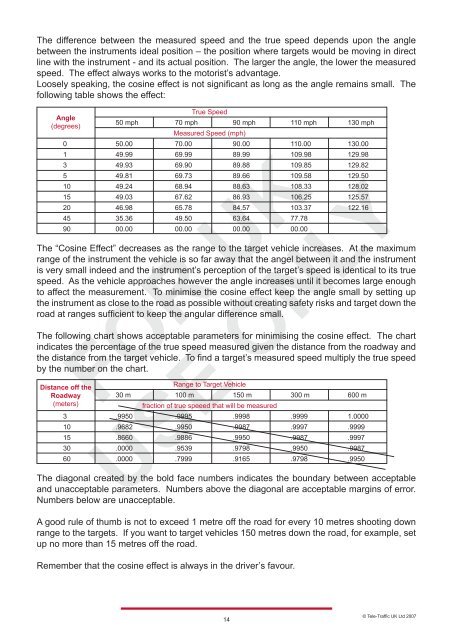
The difference between the measured speed and the true speed depends upon the angle<br />
between the instruments ideal position – the position where targets would be moving in direct<br />
line with the instrument - and its actual position. The larger the angle, the lower the measured<br />
speed. The effect always works to the motorist’s advantage.<br />
Loosely speaking, the cosine effect is not significant as long as the angle remains small. The<br />
following table shows the effect:<br />
Angle<br />
(degrees)<br />
50 mph<br />
True Speed<br />
70 mph 90 mph 110 mph 130 mph<br />
Measured Speed (mph)<br />
0 50.00 70.00 90.00 110.00 130.00<br />
1 49.99 69.99 89.99 109.98 129.98<br />
3 49.93 69.90 89.88 109.85 129.82<br />
5 49.81 69.73 89.66 109.58 129.50<br />
10 49.24 68.94 88.63 108.33 128.02<br />
15 49.03 67.62 86.93 106.25 125.57<br />
<strong>20</strong> 46.98 65.78 84.57 103.37 122.16<br />
45 35.36 49.50 63.64 77.78<br />
90 00.00 00.00 00.00 00.00<br />
The “Cosine Effect” decreases as the range to the target vehicle increases. At the maximum<br />
range of the instrument the vehicle is so far away that the angel between it and the instrument<br />
is very small indeed and the instrument’s perception of the target’s speed is identical to its true<br />
speed. As the vehicle approaches however the angle increases until it becomes large enough<br />
to affect the measurement. To minimise the cosine effect keep the angle small by setting up<br />
the instrument as close to the road as possible without creating safety risks and target down the<br />
road at ranges sufficient to keep the angular difference small.<br />
The following chart shows acceptable parameters for minimising the cosine effect. The chart<br />
indicates the percentage of the true speed measured given the distance from the roadway and<br />
the distance from the target vehicle. To find a target’s measured speed multiply the true speed<br />
by the number on the chart.<br />
Distance off the<br />
Range to Target Vehicle<br />
Roadway<br />
30 m <strong>100</strong> m 150 m 300 m 600 m<br />
(meters)<br />
fraction of true speeed that will be measured<br />
3 .9950 .9995 .9998 .9999 1.0000<br />
10 .9682 .9950 .9987 .9997 .9999<br />
15 .8660 .9886 .9950 .9987 .9997<br />
30 .0000 .9539 .9798 .9950 .9987<br />
60 .0000 .7999 .9165 .9798 .9950<br />
The diagonal created by the bold face numbers indicates the boundary between acceptable<br />
and unacceptable parameters. Numbers above the diagonal are acceptable margins of error.<br />
Numbers below are unacceptable.<br />
A good rule of thumb is not to exceed 1 metre off the road for every 10 metres shooting down<br />
range to the targets. If you want to target vehicles 150 metres down the road, for example, set<br />
up no more than 15 metres off the road.<br />
Remember that the cosine effect is always in the driver’s favour.<br />
14<br />
© <strong>Tele</strong>-<strong>Traffic</strong> UK Ltd <strong>20</strong>07