Decision Models in Skiable Areas - EPFL
Decision Models in Skiable Areas - EPFL
Decision Models in Skiable Areas - EPFL

You also want an ePaper? Increase the reach of your titles
YUMPU automatically turns print PDFs into web optimized ePapers that Google loves.
4 DATA 8<br />
View that that the Mult<strong>in</strong>om<strong>in</strong>al Logit Model is a generalization of the B<strong>in</strong>ary Logit<br />
Model, the property of IIA is also satisfied by the B<strong>in</strong>ary Logit Model.<br />
The assumption that the random terms are identically and <strong>in</strong>dependent causes problems<br />
with alternatives which are correlated. The red bus/blue bus paradox is illustrated<br />
<strong>in</strong> [2] or an other example <strong>in</strong> [1].<br />
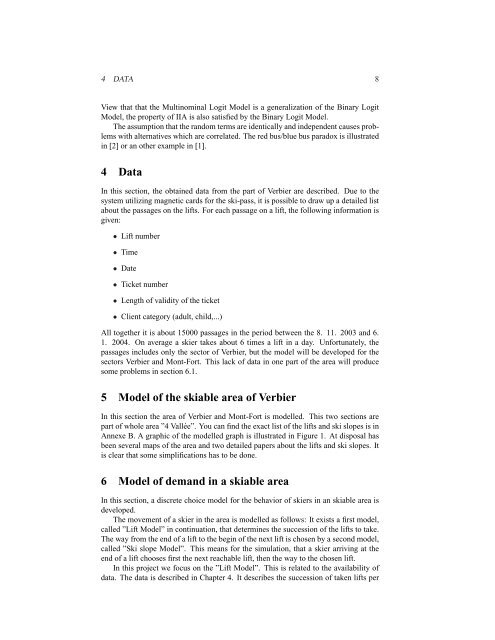
4 Data<br />
In this section, the obta<strong>in</strong>ed data from the part of Verbier are described. Due to the<br />
system utiliz<strong>in</strong>g magnetic cards for the ski-pass, it is possible to draw up a detailed list<br />
about the passages on the lifts. For each passage on a lift, the follow<strong>in</strong>g <strong>in</strong>formation is<br />
given:<br />
• Lift number<br />
• Time<br />
• Date<br />
• Ticket number<br />
• Length of validity of the ticket<br />
• Client category (adult, child,...)<br />
All together it is about 15000 passages <strong>in</strong> the period between the 8. 11. 2003 and 6.<br />
1. 2004. On average a skier takes about 6 times a lift <strong>in</strong> a day. Unfortunately, the<br />
passages <strong>in</strong>cludes only the sector of Verbier, but the model will be developed for the<br />
sectors Verbier and Mont-Fort. This lack of data <strong>in</strong> one part of the area will produce<br />
some problems <strong>in</strong> section 6.1.<br />
5 Model of the skiable area of Verbier<br />
In this section the area of Verbier and Mont-Fort is modelled. This two sections are<br />
part of whole area ”4 Vallée”. You can f<strong>in</strong>d the exact list of the lifts and ski slopes is <strong>in</strong><br />
Annexe B. A graphic of the modelled graph is illustrated <strong>in</strong> Figure 1. At disposal has<br />
been several maps of the area and two detailed papers about the lifts and ski slopes. It<br />
is clear that some simplifications has to be done.<br />
6 Model of demand <strong>in</strong> a skiable area<br />
In this section, a discrete choice model for the behavior of skiers <strong>in</strong> an skiable area is<br />
developed.<br />
The movement of a skier <strong>in</strong> the area is modelled as follows: It exists a first model,<br />
called ”Lift Model” <strong>in</strong> cont<strong>in</strong>uation, that determ<strong>in</strong>es the succession of the lifts to take.<br />
The way from the end of a lift to the beg<strong>in</strong> of the next lift is chosen by a second model,<br />
called ”Ski slope Model”. This means for the simulation, that a skier arriv<strong>in</strong>g at the<br />
end of a lift chooses first the next reachable lift, then the way to the chosen lift.<br />
In this project we focus on the ”Lift Model”. This is related to the availability of<br />
data. The data is described <strong>in</strong> Chapter 4. It describes the succession of taken lifts per