- Page 1 and 2:
Towards a [ ] ADVANCE COPY ONLINE R
- Page 3:
Towards a Pathways to Sustainable D
- Page 7:
Foreword Nearly 20 years after the
- Page 11 and 12:
Introduction Setting the stage for
- Page 13 and 14:
Contents Introduction 1 Introductio
- Page 15 and 16:
policies, including pricing and reg
- Page 17 and 18:
one form of capital to meet today
- Page 19 and 20:
will be required to assess and moni
- Page 21 and 22:
Box 1: Towards a green economy: A t
- Page 23 and 24:
overall transition to a green econo
- Page 25 and 26:
References Adelman, Irma (1999).
- Page 27:
Introduction 27
- Page 30 and 31:
iStockphoto/Klaus Hollitzer
- Page 32 and 33:
32 Acknowledgements Chapter Coordin
- Page 34 and 35:
Towards a green economy 34 List of
- Page 36 and 37:
Towards a green economy 36 Key mess
- Page 38 and 39:
Towards a green economy 38 1 Introd
- Page 40 and 41:
Towards a green economy 40 contribu
- Page 42 and 43:
Towards a green economy 42 instance
- Page 44 and 45:
Towards a green economy 44 2 Challe
- Page 46 and 47:
Towards a green economy 46 Figure 8
- Page 48 and 49:
Towards a green economy 48 2°C). F
- Page 50 and 51:
Towards a green economy 50 3 The ca
- Page 52 and 53:
Towards a green economy 52 Box 4: C
- Page 54 and 55:
Towards a green economy 54 Improvin
- Page 56 and 57:
Towards a green economy 56 Box 8: O
- Page 58 and 59:
Towards a green economy 58 is almos
- Page 60 and 61:
Towards a green economy 60 Overall,
- Page 62 and 63:
Towards a green economy 62 small fa
- Page 64 and 65:
Towards a green economy 64 telemetr
- Page 66 and 67:
Towards a green economy 66 friendly
- Page 68 and 69:
Towards a green economy 68 Annex 2.
- Page 70 and 71:
Towards a green economy 70 Annex 3.
- Page 72 and 73:
Towards a green economy 72 Referenc
- Page 74 and 75:
Towards a green economy 74 Irz, X.,
- Page 76 and 77:
Towards a green economy 76 Singh, H
- Page 78 and 79:
iStockphoto/Nico Smit
- Page 80 and 81:
Towards a green economy 80 Acknowle
- Page 82 and 83:
Towards a green economy 82 List of
- Page 84 and 85:
Towards a green economy 84 Key mess
- Page 86 and 87:
Towards a green economy 86 1 Introd
- Page 88 and 89:
Towards a green economy 88 Fishing
- Page 90 and 91:
Towards a green economy 90 1950s Th
- Page 92 and 93:
Towards a green economy 92 most sig
- Page 94 and 95:
Towards a green economy 94 Item (un
- Page 96 and 97:
Towards a green economy 96 Current
- Page 98 and 99:
Towards a green economy 98 and recr
- Page 100 and 101:
Towards a green economy 100 special
- Page 102 and 103:
Towards a green economy 102 limits
- Page 104 and 105:
Towards a green economy 104 success
- Page 106 and 107:
Towards a green economy 106 private
- Page 108 and 109:
Towards a green economy 108 Referen
- Page 110 and 111:
Towards a green economy 110 Perry,
- Page 112 and 113:
iStockphoto/Morgan Mansour
- Page 114 and 115:
Towards a green economy 114 Acknowl
- Page 116 and 117:
Towards a green economy 116 List of
- Page 118 and 119:
Towards a green economy 118 Key mes
- Page 120 and 121:
Towards a green economy 120 1 Intro
- Page 122 and 123:
Towards a green economy 122 1 5 The
- Page 124 and 125:
Towards a green economy 124 Another
- Page 126 and 127:
Towards a green economy 126 3 Chall
- Page 128 and 129:
Towards a green economy 128 Little
- Page 130 and 131:
water withdrawals, assuming no e�
- Page 132 and 133:
Towards a green economy 132 Biome/e
- Page 134 and 135:
Towards a green economy 134 Accessi
- Page 136 and 137:
Towards a green economy 136 China -
- Page 138 and 139:
Towards a green economy 138 5 Enabl
- Page 140 and 141:
Towards a green economy 140 Regions
- Page 142 and 143:
Towards a green economy Total retur
- Page 144 and 145:
Towards a green economy 144 % 100 9
- Page 146 and 147:
Towards a green economy 146 devolve
- Page 148 and 149:
Towards a green economy 148 6 Concl
- Page 150 and 151:
Towards a green economy 150 linkage
- Page 152 and 153:
iStockphoto/Fenykepez
- Page 154 and 155:
Towards a green economy 154 Acknowl
- Page 156 and 157:
Towards a green economy 156 List of
- Page 158 and 159:
Towards a green economy 158 Key mes
- Page 160 and 161:
Towards a green economy 160 1 Intro
- Page 162 and 163:
Towards a green economy 162 Scope E
- Page 164 and 165:
Towards a green economy 164 more so
- Page 166 and 167:
Towards a green economy 166 Box 3:
- Page 168 and 169:
Towards a green economy 168 still c
- Page 170 and 171:
Towards a green economy 170 the per
- Page 172 and 173:
Towards a green economy 172 forests
- Page 174 and 175:
Towards a green economy 174 The two
- Page 176 and 177:
Towards a green economy 176 or cabl
- Page 178 and 179:
Towards a green economy 178 tropica
- Page 180 and 181:
Towards a green economy 180 Type of
- Page 182 and 183:
Towards a green economy 182 with di
- Page 184 and 185:
Towards a green economy 184 Million
- Page 186 and 187:
Towards a green economy 186 5 Enabl
- Page 188 and 189:
Towards a green economy 188 Box 13:
- Page 190 and 191:
Towards a green economy 190 However
- Page 192 and 193:
Towards a green economy 192 Referen
- Page 194 and 195:
Towards a green economy 194 forests
- Page 197 and 198:
Part II Investing in energy and res
- Page 199 and 200:
Renewable energy Investing in energ
- Page 201 and 202:
Contents Renewable energy Key messa
- Page 203 and 204:
Renewable energy 203
- Page 205 and 206:
Renewable energy 7. Increasing inve
- Page 207 and 208:
non-OECD countries are also expecte
- Page 209 and 210:
About half of these costs will be b
- Page 211 and 212:
efficiency in low-income countries,
- Page 213 and 214:
derived from fossil fuels. The scen
- Page 215 and 216:
US$ (2008) per MWh 9,0 8,0 7,0 6,0
- Page 217 and 218:
US$ billion 80 Growth: 48% 48% 34%
- Page 219 and 220:
study in Aragon, Spain, for example
- Page 221 and 222:
spans of power plants and distribut
- Page 223 and 224:
Mtoe/yr 20000 15000 10000 5000 0 13
- Page 225 and 226:
Effects on employment - increasing
- Page 227 and 228:
Country Renewable energy technology
- Page 229 and 230:
More formal Less formal Stage 1 R&D
- Page 231 and 232:
GDP/capita (thousand 2008 US$) 95 8
- Page 233 and 234:
The challenge of adapting the curre
- Page 235 and 236:
References AFREPREN/FWD Energy, Env
- Page 237 and 238:
WHO (2009): “The Poor man’s fue
- Page 239 and 240:
Manufacturing Investing in energy a
- Page 241 and 242:
Contents Manufacturing Key messages
- Page 243 and 244:
Manufacturing 243
- Page 245 and 246:
Manufacturing 5. While direct job e
- Page 247 and 248:
Aluminium global mass �ow in �n
- Page 249 and 250:
Historically, GDP has grown more ra
- Page 251 and 252:
Gigabarrels annually 40 30 20 10 0
- Page 253 and 254:
Against this background, resource-i
- Page 255 and 256:
Source: Adapted from Mannan (2009),
- Page 257 and 258:
Manufacturing 3 Opportunities - Str
- Page 259 and 260:
Production side Eco-efficiency stra
- Page 261 and 262:
The major obstacle to re-manufactur
- Page 263 and 264:
Table 6: Examples of investment and
- Page 265 and 266:
the impact of greener practices on
- Page 267 and 268:
As suggested by the USA auto indust
- Page 269 and 270:
labor intensity, also due to the fa
- Page 271 and 272:
6 Enabling conditions for a green t
- Page 273 and 274:
principles of industrial symbiosis
- Page 275 and 276:
debate on sector approaches provide
- Page 277 and 278:
impacts of paper, plastic and cloth
- Page 279 and 280:
7 Conclusions This chapter has prov
- Page 281 and 282:
References ABB Switzerland Ltd., Az
- Page 283 and 284:
Renzetti, S. (2005). «Economic Ins
- Page 285 and 286:
Waste Investing in energy and resou
- Page 287 and 288:
Contents Key messages. . . . . . .
- Page 289 and 290:
Waste 289
- Page 291 and 292:
illion in 2008 and projected to gro
- Page 293 and 294:
■ Energy recovery, which harnesse
- Page 295 and 296:
Q1 Q2 Q3 Q4 GDP per capita (USD) 45
- Page 297 and 298:
200 150 100 1980 Index: 1980=100 19
- Page 299 and 300:
In developing countries, owing to l
- Page 301 and 302:
Percentage 1980 100 80 60 40 20 0 U
- Page 303 and 304:
Targets Examples Resource efficienc
- Page 305 and 306:
Particulars Low-income countries Mi
- Page 307 and 308:
Box 3: Cost savings and resource re
- Page 309 and 310:
Box 5: Turning urban manure into or
- Page 311 and 312:
Renewable waste Thousand TeraJoule
- Page 313 and 314:
Peru (1) and Uruguay (1), has been
- Page 315 and 316:
illion for G2. The allocation for w
- Page 317 and 318:
Transition (CEIT) in complying with
- Page 319 and 320:
waste handling, storage, treatment
- Page 321 and 322:
and standards. Developing countries
- Page 323 and 324:
References Acurio G., Rossin A., Te
- Page 325 and 326:
hod=view&docSeq=194&bbsCode=res_mat
- Page 327 and 328:
Waste 327
- Page 329 and 330:
Buildings Investing in energy and r
- Page 331 and 332:
Contents Buildings Key messages 334
- Page 333 and 334:
Buildings 333
- Page 335 and 336:
Buildings 4. Greening the building
- Page 337 and 338:
2 Challenges and opportunities 2 1
- Page 339 and 340:
Some aspects of improved well-being
- Page 341 and 342:
penetration at certain times of day
- Page 343 and 344:
New construction potential 10 8 6 4
- Page 345 and 346:
3 The case for investment in green
- Page 347 and 348:
new residential construction, an es
- Page 349 and 350:
Box 3: Retrofitting existing office
- Page 351 and 352:
as noise pollution, chemical pollut
- Page 353 and 354:
such as distributing cooking stoves
- Page 355 and 356:
Speanding category Impact Amount (m
- Page 357 and 358:
Scenarios Emission intensity - CO e
- Page 359 and 360:
4 Enabling conditions and policy in
- Page 361 and 362:
Box 7: Reliable measurement and acc
- Page 363 and 364:
water, indoor air quality and finan
- Page 365 and 366:
energy reduction targets had been p
- Page 367 and 368:
5 Conclusions The building sector s
- Page 369 and 370:
References ADB (2009). ARM090554 In
- Page 371 and 372:
Addressing a multi-faceted phenomen
- Page 373 and 374:
Transport Investing in energy and r
- Page 375 and 376:
Contents Transport Key messages 378
- Page 377 and 378:
List of acronyms ADB ‑ Asian Deve
- Page 379 and 380:
Transport 4. Investment in public t
- Page 381 and 382:
2 Challenges and opportunities in t
- Page 383 and 384:
Region* GNP, 1997 (USD billion) Tab
- Page 385 and 386:
Strategy Developed Countries Develo
- Page 387 and 388:
3 Transport in a green economy This
- Page 389 and 390:
Avoid - Shift - Improve Avoid Avoid
- Page 391 and 392:
4 Quantifying the economic implicat
- Page 393 and 394:
Index of emissions (1990 = 100) 160
- Page 395 and 396:
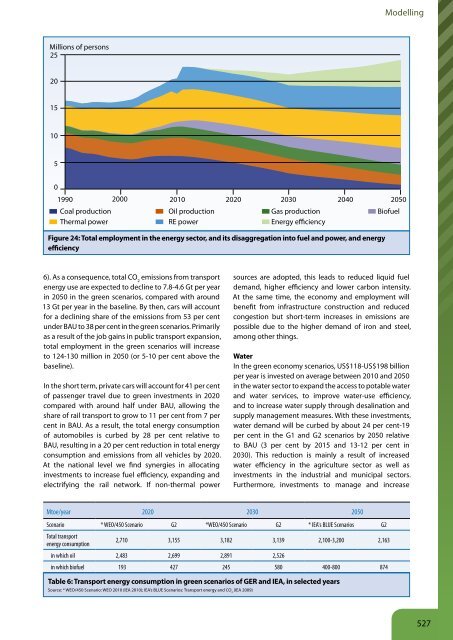
Total employment in the transport s
- Page 397 and 398:
Outer Middle Business-as-usual (dis
- Page 399 and 400:
Funding stream Avoid Shift Improve
- Page 401 and 402:
■ Equity - both horizontally (i.e
- Page 403 and 404:
efficiency measures at a global sca
- Page 405 and 406:
References ADB (2009b) Transport Op
- Page 407 and 408:
VTPI (2007) Transportation Cost and
- Page 409 and 410:
Tourism Investing in energy and res
- Page 411 and 412:
Contents Acknowledgements 410 Key m
- Page 413 and 414:
List of acronyms BAU - Business-as-
- Page 415 and 416:
Tourism 6. Tourists are demanding t
- Page 417 and 418:
2 Challenges and opportunities for
- Page 419 and 420:
Loss of biological diversity There
- Page 421 and 422:
fees. WTP for entrance fees from in
- Page 423 and 424:
For the EU 27, GHK (2007) estimates
- Page 425 and 426:
Tourist RM300 100% tourism incomes
- Page 427 and 428:
that overall financial cost-recover
- Page 429 and 430:
US$1 billion and a significantly hi
- Page 431 and 432:
4 Overcoming barriers: enabling con
- Page 433 and 434:
a selection of larger firms. Smalle
- Page 435 and 436:
Tourism investment from government
- Page 437 and 438:
and bankers. Long-term contracts fo
- Page 439 and 440:
y sustainable local, small, medium,
- Page 441 and 442:
Annex 2: Drivers and likely implica
- Page 443 and 444:
Annex 3: Assumptions of the model 1
- Page 445 and 446:
References Adamson, M. (2001): “E
- Page 447:
Tourism 447
- Page 450 and 451:
Towards a green economy 450 Acknowl
- Page 452 and 453:
Towards a green economy 452 List of
- Page 454 and 455:
Towards a green economy 454 Key mes
- Page 456 and 457:
Towards a green economy 456 1 Intro
- Page 458 and 459:
Towards a green economy 458 Nationa
- Page 460 and 461:
Towards a green economy 460 of ener
- Page 462 and 463:
Towards a green economy 462 3 The c
- Page 464 and 465:
Towards a green economy 464 compare
- Page 466 and 467:
Towards a green economy 466 Fifth,
- Page 468 and 469:
Towards a green economy 468 ■ Psy
- Page 470 and 471:
Towards a green economy 470 4 Green
- Page 472 and 473:
Towards a green economy 472 cities
- Page 474 and 475:
Towards a green economy 474 capita
- Page 476 and 477: Towards a green economy 476 on wate
- Page 478 and 479: Towards a green economy 478 Environ
- Page 480 and 481: Towards a green economy 480 Second,
- Page 482 and 483: Towards a green economy 482 Referen
- Page 484 and 485: Towards a green economy 484 America
- Page 486 and 487: Towards a green economy 486 Appendi
- Page 488 and 489: Towards a green economy 488 [access
- Page 491: Part III Supporting the transition
- Page 494 and 495: Towards a green economy 494 Acknowl
- Page 496 and 497: Towards a green economy 496 List of
- Page 498 and 499: Towards a green economy 498
- Page 500 and 501: Towards a green economy 500 Key mes
- Page 502 and 503: Towards a green economy 502 1 Intro
- Page 504 and 505: Towards a green economy 504 scarce
- Page 506 and 507: Towards a green economy 506 Environ
- Page 508 and 509: Towards a green economy 508 BAU Sce
- Page 510 and 511: Towards a green economy 510 to the
- Page 512 and 513: Towards a green economy 512 Million
- Page 514 and 515: Towards a green economy 514 depend
- Page 516 and 517: Towards a green economy 516 Natural
- Page 518 and 519: Towards a green economy 518 Box 1:
- Page 520 and 521: Towards a green economy 520 Percent
- Page 522 and 523: Towards a green economy 522 Billion
- Page 524 and 525: Towards a green economy 524 BAU U (
- Page 528 and 529: Towards a green economy 528 Thousan
- Page 530 and 531: Towards a green economy 530 Economi
- Page 532 and 533: Towards a green economy 532 2011 20
- Page 534 and 535: Towards a green economy 534 2015 20
- Page 536 and 537: Towards a green economy 536 Society
- Page 538 and 539: Towards a green economy 538 added a
- Page 540 and 541: Towards a green economy 540 interve
- Page 543 and 544: Enabling conditions Supporting the
- Page 545 and 546: Contents Enabling conditions Key me
- Page 547 and 548: Enabling conditions 4. A well-desig
- Page 549 and 550: 2 Key policy tools The sections bel
- Page 551 and 552: Box 1: Investing in green infrastru
- Page 553 and 554: For example, depending on the suppo
- Page 555 and 556: provides countries with the ability
- Page 557 and 558: environmentally harmful in other ca
- Page 559 and 560: considers key national regulatory t
- Page 561 and 562: MEAs can play a significant role in
- Page 563 and 564: application of new technologies in
- Page 565 and 566: 3 Supporting actions Depending on t
- Page 567 and 568: are able to learn and understand th
- Page 569 and 570: Annex 1 - Enabling conditions: A se
- Page 571 and 572: Enabling condition Rationale: How i
- Page 573 and 574: National Ecology Institute of Mexic
- Page 575 and 576: Finance Supporting the transition t
- Page 577 and 578:
Contents Key messages 580 Finance 1
- Page 579 and 580:
List of acronyms A/R Afforestation
- Page 581 and 582:
Finance 4. Advances in disclosure a
- Page 583 and 584:
2 The state of play 2 1 The scale o
- Page 585 and 586:
Global market size Share committed
- Page 587 and 588:
3 Emerging investment in the green
- Page 589 and 590:
increasingly affect the context wit
- Page 591 and 592:
Box 2: Overview of REDD+ Reducing E
- Page 593 and 594:
to learn how a cap-and-trade system
- Page 595 and 596:
£/tCO2e 250 200 150 100 50 £40 0
- Page 597 and 598:
Box 5: Financial materiality and fi
- Page 599 and 600:
to investment, but progress in putt
- Page 601 and 602:
policy makers. The risk pooling aff
- Page 603 and 604:
elevant to both the insurance and i
- Page 605 and 606:
example, it has been established th
- Page 607 and 608:
enchmarking. Public and private ban
- Page 609 and 610:
Exchanges that have taken such init
- Page 611 and 612:
green venture capital funds in deve
- Page 613 and 614:
green subsidies, grants and subsidi
- Page 615 and 616:
own resources to leverage the finan
- Page 617 and 618:
Strengthening the resilience of the
- Page 619:
Finance 619
- Page 622 and 623:
Towards a green economy 622 Conclus
- Page 624:
Towards a green economy 624 the lat