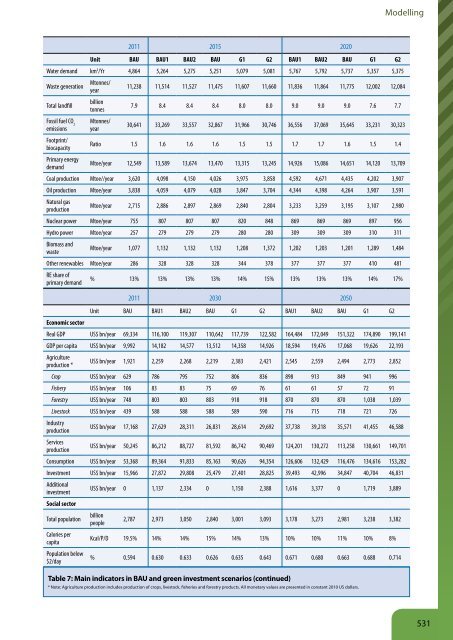
Towards a green economy 530 Economic sector 2011 2015 2020 Unit BAU BAU1 BAU2 BAU G1 G2 BAU1 BAU2 BAU G1 G2 Real GDP US$ bn/year 69,334 78,651 79,306 77,694 78,384 78,690 91,028 92,583 88,738 90,915 92,244 GDP per capita US$ bn/year 9,992 10,868 10,959 10,737 10,832 10,874 12,000 12,205 11,698 11,983 12,156 Agriculture production * US$ bn/year 1,921 1,965 1,967 1,945 1,963 1,976 2,066 2,071 2,035 2,146 2,167 Crop US$ bn/year 629 674 677 657 679 691 713 718 690 726 744 Fishery US$ bn/year 106 101 101 99 73 75 95 95 88 69 72 Forestry US$ bn/year 748 718 718 718 740 740 747 747 747 840 840 Livestock US$ bn/year 439 471 471 471 471 471 511 511 511 511 511 Industry production US$ bn/year 17,168 19,304 19,457 19,146 19,363 19,439 22,091 22,444 21,727 22,330 22,642 Services production US$ bn/year 50,245 57,382 57,882 56,604 57,058 57,275 66,871 68,068 64,975 66,439 67,434 Consumption US$ bn/year 53,368 60,539 61,044 59,803 60,334 60,569 70,066 71,263 68,303 69,979 71,002 Investment US$ bn/year 15,966 18,874 19,798 17,892 18,240 18,502 21,847 23,118 20,435 21,157 21,689 Additional investment Social sector US$ bn/year 0 763 1,535 0 760 1,524 885 1,798 0 883 1,788 Total population billion people 6.9 7.2 7.2 7.2 7.2 7.2 7.6 7.6 7.6 7.6 7.6 Calories per capita Kcal/P/D 2,787 2,829 2,857 2,791 2,834 2,865 2,887 2,946 2,802 2,897 2,955 Population below $2/day % 19.5% 18.1% 17.9% 18.3% 18.1% 18.1% 16.4% 16.2% 16.9% 16.5% 16.2% HDI Index 0.594 0.600 0.601 0.600 0.600 0.601 0.610 0.611 0.608 0.611 0.613 Total employment Agriculture Industry Services Fisheries Forestry Transportation Energy Waste Water million people million people million people million people million people million people million people million people million people million people 3,187 3,407 3,419 3,392 3,420 3,441 3,685 3,722 3,641 3,676 3,701 1,075 1,119 1,123 1,113 1,147 1,167 1,185 1,200 1,167 1,215 1,244 662 725 728 723 722 721 803 810 796 793 790 1,260 1,366 1,371 1,361 1,357 1,357 1,491 1,506 1,476 1,465 1,461 29 28 28 28 21 21 27 27 24 19 20 21 20 20 20 21 21 21 21 21 24 24 70 75 75 74 79 79 79 80 78 85 85 19 20 20 20 20 21 20 20 20 19 21 20 20 20 20 20 21 21 21 21 21 21 31 34 34 34 33 33 37 37 37 35 35 Environmental sector Forest land billion ha 3.9 3.9 3.9 3.9 4.0 4.0 3.9 3.9 3.9 4.0 4.0 Arable land billion ha 1.6 1.6 1.6 1.6 1.6 1.6 1.6 1.6 1.6 1.6 1.6 Harvested area billion ha 1.20 1.2 1.2 1.2 1.2 1.2 1.2 1.2 1.2 1.2 1.2 Table 7: Main indicators in BAU and green investment scenarios * Note: Agriculture production includes production of crops, livestock, fisheries and forestry products. All monetary values are presented in constant 2010 US dollars.
2011 2015 2020 Unit BAU BAU1 BAU2 BAU G1 G2 BAU1 BAU2 BAU G1 G2 Water demand km 3 /Yr 4,864 5,264 5,275 5,251 5,079 5,081 5,767 5,792 5,737 5,357 5,375 Waste generation Total landfill Fossil fuel CO2 emissions Footprint/ biocapacity Primary energy demand Mtonnes/ year billion tonnes Mtonnes/ year Modelling 11,238 11,514 11,527 11,475 11,607 11,660 11,836 11,864 11,775 12,002 12,084 7.9 8.4 8.4 8.4 8.0 8.0 9.0 9.0 9.0 7.6 7.7 30,641 33,269 33,557 32,867 31,966 30,746 36,556 37,069 35,645 33,231 30,323 Ratio 1.5 1.6 1.6 1.6 1.5 1.5 1.7 1.7 1.6 1.5 1.4 Mtoe/year 12,549 13,589 13,674 13,470 13,315 13,245 14,926 15,086 14,651 14,120 13,709 Coal production Mtoe//year 3,620 4,098 4,150 4,026 3,975 3,858 4,592 4,671 4,435 4,202 3,907 Oil production Mtoe/year 3,838 4,059 4,079 4,028 3,847 3,704 4,344 4,398 4,264 3,907 3,591 Natural gas production Mtoe/year 2,715 2,886 2,897 2,869 2,840 2,804 3,233 3,259 3,195 3,107 2,980 Nuclear power Mtoe/year 755 807 807 807 820 848 869 869 869 897 956 Hydro power Mtoe/year 257 279 279 279 280 280 309 309 309 310 311 Biomass and waste Mtoe/year 1,077 1,132 1,132 1,132 1,208 1,372 1,202 1,203 1,201 1,289 1,484 Other renewables Mtoe/year 286 328 328 328 344 378 377 377 377 410 481 RE share of primary demand % 13% 13% 13% 13% 14% 15% 13% 13% 13% 14% 17% 2011 2030 2050 Unit BAU BAU1 BAU2 BAU G1 G2 BAU1 BAU2 BAU G1 G2 Economic sector Real GDP US$ bn/year 69,334 116,100 119,307 110,642 117,739 122,582 164,484 172,049 151,322 174,890 199,141 GDP per capita US$ bn/year 9,992 14,182 14,577 13,512 14,358 14,926 18,594 19,476 17,068 19,626 22,193 Agriculture production * US$ bn/year 1,921 2,259 2,268 2,219 2,383 2,421 2,545 2,559 2,494 2,773 2,852 Crop US$ bn/year 629 786 795 752 806 836 898 913 849 941 996 Fishery US$ bn/year 106 83 83 75 69 76 61 61 57 72 91 Forestry US$ bn/year 748 803 803 803 918 918 870 870 870 1,038 1,039 Livestock US$ bn/year 439 588 588 588 589 590 716 715 718 721 726 Industry production US$ bn/year 17,168 27,629 28,311 26,831 28,614 29,692 37,738 39,218 35,571 41,455 46,588 Services production US$ bn/year 50,245 86,212 88,727 81,592 86,742 90,469 124,201 130,272 113,258 130,661 149,701 Consumption US$ bn/year 53,368 89,364 91,833 85,163 90,626 94,354 126,606 132,429 116,476 134,616 153,282 Investment US$ bn/year 15,966 27,872 29,808 25,479 27,401 28,825 39,493 42,996 34,847 40,704 46,831 Additional investment Social sector US$ bn/year 0 1,137 2,334 0 1,150 2,388 1,616 3,377 0 1,719 3,889 Total population billion people 2,787 2,973 3,050 2,840 3,001 3,093 3,178 3,273 2,981 3,238 3,382 Calories per capita Kcal/P/D 19.5% 14% 14% 15% 14% 13% 10% 10% 11% 10% 8% Population below $2/day % 0.594 0.630 0.633 0.626 0.635 0.643 0.671 0.680 0.663 0.688 0.714 Table 7: Main indicators in BAU and green investment scenarios (continued) * Note: Agriculture production includes production of crops, livestock, fisheries and forestry products. All monetary values are presented in constant 2010 US dollars. 531
- Page 1 and 2:
Towards a [ ] ADVANCE COPY ONLINE R
- Page 3:
Towards a Pathways to Sustainable D
- Page 7:
Foreword Nearly 20 years after the
- Page 11 and 12:
Introduction Setting the stage for
- Page 13 and 14:
Contents Introduction 1 Introductio
- Page 15 and 16:
policies, including pricing and reg
- Page 17 and 18:
one form of capital to meet today
- Page 19 and 20:
will be required to assess and moni
- Page 21 and 22:
Box 1: Towards a green economy: A t
- Page 23 and 24:
overall transition to a green econo
- Page 25 and 26:
References Adelman, Irma (1999).
- Page 27:
Introduction 27
- Page 30 and 31:
iStockphoto/Klaus Hollitzer
- Page 32 and 33:
32 Acknowledgements Chapter Coordin
- Page 34 and 35:
Towards a green economy 34 List of
- Page 36 and 37:
Towards a green economy 36 Key mess
- Page 38 and 39:
Towards a green economy 38 1 Introd
- Page 40 and 41:
Towards a green economy 40 contribu
- Page 42 and 43:
Towards a green economy 42 instance
- Page 44 and 45:
Towards a green economy 44 2 Challe
- Page 46 and 47:
Towards a green economy 46 Figure 8
- Page 48 and 49:
Towards a green economy 48 2°C). F
- Page 50 and 51:
Towards a green economy 50 3 The ca
- Page 52 and 53:
Towards a green economy 52 Box 4: C
- Page 54 and 55:
Towards a green economy 54 Improvin
- Page 56 and 57:
Towards a green economy 56 Box 8: O
- Page 58 and 59:
Towards a green economy 58 is almos
- Page 60 and 61:
Towards a green economy 60 Overall,
- Page 62 and 63:
Towards a green economy 62 small fa
- Page 64 and 65:
Towards a green economy 64 telemetr
- Page 66 and 67:
Towards a green economy 66 friendly
- Page 68 and 69:
Towards a green economy 68 Annex 2.
- Page 70 and 71:
Towards a green economy 70 Annex 3.
- Page 72 and 73:
Towards a green economy 72 Referenc
- Page 74 and 75:
Towards a green economy 74 Irz, X.,
- Page 76 and 77:
Towards a green economy 76 Singh, H
- Page 78 and 79:
iStockphoto/Nico Smit
- Page 80 and 81:
Towards a green economy 80 Acknowle
- Page 82 and 83:
Towards a green economy 82 List of
- Page 84 and 85:
Towards a green economy 84 Key mess
- Page 86 and 87:
Towards a green economy 86 1 Introd
- Page 88 and 89:
Towards a green economy 88 Fishing
- Page 90 and 91:
Towards a green economy 90 1950s Th
- Page 92 and 93:
Towards a green economy 92 most sig
- Page 94 and 95:
Towards a green economy 94 Item (un
- Page 96 and 97:
Towards a green economy 96 Current
- Page 98 and 99:
Towards a green economy 98 and recr
- Page 100 and 101:
Towards a green economy 100 special
- Page 102 and 103:
Towards a green economy 102 limits
- Page 104 and 105:
Towards a green economy 104 success
- Page 106 and 107:
Towards a green economy 106 private
- Page 108 and 109:
Towards a green economy 108 Referen
- Page 110 and 111:
Towards a green economy 110 Perry,
- Page 112 and 113:
iStockphoto/Morgan Mansour
- Page 114 and 115:
Towards a green economy 114 Acknowl
- Page 116 and 117:
Towards a green economy 116 List of
- Page 118 and 119:
Towards a green economy 118 Key mes
- Page 120 and 121:
Towards a green economy 120 1 Intro
- Page 122 and 123:
Towards a green economy 122 1 5 The
- Page 124 and 125:
Towards a green economy 124 Another
- Page 126 and 127:
Towards a green economy 126 3 Chall
- Page 128 and 129:
Towards a green economy 128 Little
- Page 130 and 131:
water withdrawals, assuming no e�
- Page 132 and 133:
Towards a green economy 132 Biome/e
- Page 134 and 135:
Towards a green economy 134 Accessi
- Page 136 and 137:
Towards a green economy 136 China -
- Page 138 and 139:
Towards a green economy 138 5 Enabl
- Page 140 and 141:
Towards a green economy 140 Regions
- Page 142 and 143:
Towards a green economy Total retur
- Page 144 and 145:
Towards a green economy 144 % 100 9
- Page 146 and 147:
Towards a green economy 146 devolve
- Page 148 and 149:
Towards a green economy 148 6 Concl
- Page 150 and 151:
Towards a green economy 150 linkage
- Page 152 and 153:
iStockphoto/Fenykepez
- Page 154 and 155:
Towards a green economy 154 Acknowl
- Page 156 and 157:
Towards a green economy 156 List of
- Page 158 and 159:
Towards a green economy 158 Key mes
- Page 160 and 161:
Towards a green economy 160 1 Intro
- Page 162 and 163:
Towards a green economy 162 Scope E
- Page 164 and 165:
Towards a green economy 164 more so
- Page 166 and 167:
Towards a green economy 166 Box 3:
- Page 168 and 169:
Towards a green economy 168 still c
- Page 170 and 171:
Towards a green economy 170 the per
- Page 172 and 173:
Towards a green economy 172 forests
- Page 174 and 175:
Towards a green economy 174 The two
- Page 176 and 177:
Towards a green economy 176 or cabl
- Page 178 and 179:
Towards a green economy 178 tropica
- Page 180 and 181:
Towards a green economy 180 Type of
- Page 182 and 183:
Towards a green economy 182 with di
- Page 184 and 185:
Towards a green economy 184 Million
- Page 186 and 187:
Towards a green economy 186 5 Enabl
- Page 188 and 189:
Towards a green economy 188 Box 13:
- Page 190 and 191:
Towards a green economy 190 However
- Page 192 and 193:
Towards a green economy 192 Referen
- Page 194 and 195:
Towards a green economy 194 forests
- Page 197 and 198:
Part II Investing in energy and res
- Page 199 and 200:
Renewable energy Investing in energ
- Page 201 and 202:
Contents Renewable energy Key messa
- Page 203 and 204:
Renewable energy 203
- Page 205 and 206:
Renewable energy 7. Increasing inve
- Page 207 and 208:
non-OECD countries are also expecte
- Page 209 and 210:
About half of these costs will be b
- Page 211 and 212:
efficiency in low-income countries,
- Page 213 and 214:
derived from fossil fuels. The scen
- Page 215 and 216:
US$ (2008) per MWh 9,0 8,0 7,0 6,0
- Page 217 and 218:
US$ billion 80 Growth: 48% 48% 34%
- Page 219 and 220:
study in Aragon, Spain, for example
- Page 221 and 222:
spans of power plants and distribut
- Page 223 and 224:
Mtoe/yr 20000 15000 10000 5000 0 13
- Page 225 and 226:
Effects on employment - increasing
- Page 227 and 228:
Country Renewable energy technology
- Page 229 and 230:
More formal Less formal Stage 1 R&D
- Page 231 and 232:
GDP/capita (thousand 2008 US$) 95 8
- Page 233 and 234:
The challenge of adapting the curre
- Page 235 and 236:
References AFREPREN/FWD Energy, Env
- Page 237 and 238:
WHO (2009): “The Poor man’s fue
- Page 239 and 240:
Manufacturing Investing in energy a
- Page 241 and 242:
Contents Manufacturing Key messages
- Page 243 and 244:
Manufacturing 243
- Page 245 and 246:
Manufacturing 5. While direct job e
- Page 247 and 248:
Aluminium global mass �ow in �n
- Page 249 and 250:
Historically, GDP has grown more ra
- Page 251 and 252:
Gigabarrels annually 40 30 20 10 0
- Page 253 and 254:
Against this background, resource-i
- Page 255 and 256:
Source: Adapted from Mannan (2009),
- Page 257 and 258:
Manufacturing 3 Opportunities - Str
- Page 259 and 260:
Production side Eco-efficiency stra
- Page 261 and 262:
The major obstacle to re-manufactur
- Page 263 and 264:
Table 6: Examples of investment and
- Page 265 and 266:
the impact of greener practices on
- Page 267 and 268:
As suggested by the USA auto indust
- Page 269 and 270:
labor intensity, also due to the fa
- Page 271 and 272:
6 Enabling conditions for a green t
- Page 273 and 274:
principles of industrial symbiosis
- Page 275 and 276:
debate on sector approaches provide
- Page 277 and 278:
impacts of paper, plastic and cloth
- Page 279 and 280:
7 Conclusions This chapter has prov
- Page 281 and 282:
References ABB Switzerland Ltd., Az
- Page 283 and 284:
Renzetti, S. (2005). «Economic Ins
- Page 285 and 286:
Waste Investing in energy and resou
- Page 287 and 288:
Contents Key messages. . . . . . .
- Page 289 and 290:
Waste 289
- Page 291 and 292:
illion in 2008 and projected to gro
- Page 293 and 294:
■ Energy recovery, which harnesse
- Page 295 and 296:
Q1 Q2 Q3 Q4 GDP per capita (USD) 45
- Page 297 and 298:
200 150 100 1980 Index: 1980=100 19
- Page 299 and 300:
In developing countries, owing to l
- Page 301 and 302:
Percentage 1980 100 80 60 40 20 0 U
- Page 303 and 304:
Targets Examples Resource efficienc
- Page 305 and 306:
Particulars Low-income countries Mi
- Page 307 and 308:
Box 3: Cost savings and resource re
- Page 309 and 310:
Box 5: Turning urban manure into or
- Page 311 and 312:
Renewable waste Thousand TeraJoule
- Page 313 and 314:
Peru (1) and Uruguay (1), has been
- Page 315 and 316:
illion for G2. The allocation for w
- Page 317 and 318:
Transition (CEIT) in complying with
- Page 319 and 320:
waste handling, storage, treatment
- Page 321 and 322:
and standards. Developing countries
- Page 323 and 324:
References Acurio G., Rossin A., Te
- Page 325 and 326:
hod=view&docSeq=194&bbsCode=res_mat
- Page 327 and 328:
Waste 327
- Page 329 and 330:
Buildings Investing in energy and r
- Page 331 and 332:
Contents Buildings Key messages 334
- Page 333 and 334:
Buildings 333
- Page 335 and 336:
Buildings 4. Greening the building
- Page 337 and 338:
2 Challenges and opportunities 2 1
- Page 339 and 340:
Some aspects of improved well-being
- Page 341 and 342:
penetration at certain times of day
- Page 343 and 344:
New construction potential 10 8 6 4
- Page 345 and 346:
3 The case for investment in green
- Page 347 and 348:
new residential construction, an es
- Page 349 and 350:
Box 3: Retrofitting existing office
- Page 351 and 352:
as noise pollution, chemical pollut
- Page 353 and 354:
such as distributing cooking stoves
- Page 355 and 356:
Speanding category Impact Amount (m
- Page 357 and 358:
Scenarios Emission intensity - CO e
- Page 359 and 360:
4 Enabling conditions and policy in
- Page 361 and 362:
Box 7: Reliable measurement and acc
- Page 363 and 364:
water, indoor air quality and finan
- Page 365 and 366:
energy reduction targets had been p
- Page 367 and 368:
5 Conclusions The building sector s
- Page 369 and 370:
References ADB (2009). ARM090554 In
- Page 371 and 372:
Addressing a multi-faceted phenomen
- Page 373 and 374:
Transport Investing in energy and r
- Page 375 and 376:
Contents Transport Key messages 378
- Page 377 and 378:
List of acronyms ADB ‑ Asian Deve
- Page 379 and 380:
Transport 4. Investment in public t
- Page 381 and 382:
2 Challenges and opportunities in t
- Page 383 and 384:
Region* GNP, 1997 (USD billion) Tab
- Page 385 and 386:
Strategy Developed Countries Develo
- Page 387 and 388:
3 Transport in a green economy This
- Page 389 and 390:
Avoid - Shift - Improve Avoid Avoid
- Page 391 and 392:
4 Quantifying the economic implicat
- Page 393 and 394:
Index of emissions (1990 = 100) 160
- Page 395 and 396:
Total employment in the transport s
- Page 397 and 398:
Outer Middle Business-as-usual (dis
- Page 399 and 400:
Funding stream Avoid Shift Improve
- Page 401 and 402:
■ Equity - both horizontally (i.e
- Page 403 and 404:
efficiency measures at a global sca
- Page 405 and 406:
References ADB (2009b) Transport Op
- Page 407 and 408:
VTPI (2007) Transportation Cost and
- Page 409 and 410:
Tourism Investing in energy and res
- Page 411 and 412:
Contents Acknowledgements 410 Key m
- Page 413 and 414:
List of acronyms BAU - Business-as-
- Page 415 and 416:
Tourism 6. Tourists are demanding t
- Page 417 and 418:
2 Challenges and opportunities for
- Page 419 and 420:
Loss of biological diversity There
- Page 421 and 422:
fees. WTP for entrance fees from in
- Page 423 and 424:
For the EU 27, GHK (2007) estimates
- Page 425 and 426:
Tourist RM300 100% tourism incomes
- Page 427 and 428:
that overall financial cost-recover
- Page 429 and 430:
US$1 billion and a significantly hi
- Page 431 and 432:
4 Overcoming barriers: enabling con
- Page 433 and 434:
a selection of larger firms. Smalle
- Page 435 and 436:
Tourism investment from government
- Page 437 and 438:
and bankers. Long-term contracts fo
- Page 439 and 440:
y sustainable local, small, medium,
- Page 441 and 442:
Annex 2: Drivers and likely implica
- Page 443 and 444:
Annex 3: Assumptions of the model 1
- Page 445 and 446:
References Adamson, M. (2001): “E
- Page 447:
Tourism 447
- Page 450 and 451:
Towards a green economy 450 Acknowl
- Page 452 and 453:
Towards a green economy 452 List of
- Page 454 and 455:
Towards a green economy 454 Key mes
- Page 456 and 457:
Towards a green economy 456 1 Intro
- Page 458 and 459:
Towards a green economy 458 Nationa
- Page 460 and 461:
Towards a green economy 460 of ener
- Page 462 and 463:
Towards a green economy 462 3 The c
- Page 464 and 465:
Towards a green economy 464 compare
- Page 466 and 467:
Towards a green economy 466 Fifth,
- Page 468 and 469:
Towards a green economy 468 ■ Psy
- Page 470 and 471:
Towards a green economy 470 4 Green
- Page 472 and 473:
Towards a green economy 472 cities
- Page 474 and 475:
Towards a green economy 474 capita
- Page 476 and 477:
Towards a green economy 476 on wate
- Page 478 and 479:
Towards a green economy 478 Environ
- Page 480 and 481: Towards a green economy 480 Second,
- Page 482 and 483: Towards a green economy 482 Referen
- Page 484 and 485: Towards a green economy 484 America
- Page 486 and 487: Towards a green economy 486 Appendi
- Page 488 and 489: Towards a green economy 488 [access
- Page 491: Part III Supporting the transition
- Page 494 and 495: Towards a green economy 494 Acknowl
- Page 496 and 497: Towards a green economy 496 List of
- Page 498 and 499: Towards a green economy 498
- Page 500 and 501: Towards a green economy 500 Key mes
- Page 502 and 503: Towards a green economy 502 1 Intro
- Page 504 and 505: Towards a green economy 504 scarce
- Page 506 and 507: Towards a green economy 506 Environ
- Page 508 and 509: Towards a green economy 508 BAU Sce
- Page 510 and 511: Towards a green economy 510 to the
- Page 512 and 513: Towards a green economy 512 Million
- Page 514 and 515: Towards a green economy 514 depend
- Page 516 and 517: Towards a green economy 516 Natural
- Page 518 and 519: Towards a green economy 518 Box 1:
- Page 520 and 521: Towards a green economy 520 Percent
- Page 522 and 523: Towards a green economy 522 Billion
- Page 524 and 525: Towards a green economy 524 BAU U (
- Page 526 and 527: Towards a green economy 526 Million
- Page 528 and 529: Towards a green economy 528 Thousan
- Page 532 and 533: Towards a green economy 532 2011 20
- Page 534 and 535: Towards a green economy 534 2015 20
- Page 536 and 537: Towards a green economy 536 Society
- Page 538 and 539: Towards a green economy 538 added a
- Page 540 and 541: Towards a green economy 540 interve
- Page 543 and 544: Enabling conditions Supporting the
- Page 545 and 546: Contents Enabling conditions Key me
- Page 547 and 548: Enabling conditions 4. A well-desig
- Page 549 and 550: 2 Key policy tools The sections bel
- Page 551 and 552: Box 1: Investing in green infrastru
- Page 553 and 554: For example, depending on the suppo
- Page 555 and 556: provides countries with the ability
- Page 557 and 558: environmentally harmful in other ca
- Page 559 and 560: considers key national regulatory t
- Page 561 and 562: MEAs can play a significant role in
- Page 563 and 564: application of new technologies in
- Page 565 and 566: 3 Supporting actions Depending on t
- Page 567 and 568: are able to learn and understand th
- Page 569 and 570: Annex 1 - Enabling conditions: A se
- Page 571 and 572: Enabling condition Rationale: How i
- Page 573 and 574: National Ecology Institute of Mexic
- Page 575 and 576: Finance Supporting the transition t
- Page 577 and 578: Contents Key messages 580 Finance 1
- Page 579 and 580: List of acronyms A/R Afforestation
- Page 581 and 582:
Finance 4. Advances in disclosure a
- Page 583 and 584:
2 The state of play 2 1 The scale o
- Page 585 and 586:
Global market size Share committed
- Page 587 and 588:
3 Emerging investment in the green
- Page 589 and 590:
increasingly affect the context wit
- Page 591 and 592:
Box 2: Overview of REDD+ Reducing E
- Page 593 and 594:
to learn how a cap-and-trade system
- Page 595 and 596:
£/tCO2e 250 200 150 100 50 £40 0
- Page 597 and 598:
Box 5: Financial materiality and fi
- Page 599 and 600:
to investment, but progress in putt
- Page 601 and 602:
policy makers. The risk pooling aff
- Page 603 and 604:
elevant to both the insurance and i
- Page 605 and 606:
example, it has been established th
- Page 607 and 608:
enchmarking. Public and private ban
- Page 609 and 610:
Exchanges that have taken such init
- Page 611 and 612:
green venture capital funds in deve
- Page 613 and 614:
green subsidies, grants and subsidi
- Page 615 and 616:
own resources to leverage the finan
- Page 617 and 618:
Strengthening the resilience of the
- Page 619:
Finance 619
- Page 622 and 623:
Towards a green economy 622 Conclus
- Page 624:
Towards a green economy 624 the lat