MITRA-AnnualReport2011 (1.2MB).pdf - Announcements - Bursa ...
MITRA-AnnualReport2011 (1.2MB).pdf - Announcements - Bursa ...
MITRA-AnnualReport2011 (1.2MB).pdf - Announcements - Bursa ...

Create successful ePaper yourself
Turn your PDF publications into a flip-book with our unique Google optimized e-Paper software.
Notes to The Financial Statements (cont’d)<br />
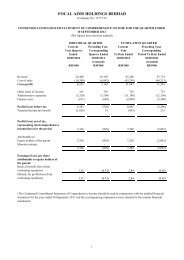
33. SEGMENT REpoRTING (CoNT’D)<br />
(a) Business Segments (cont’d)<br />
property Manufacturing<br />
Construction development and trading Healthcare others Eliminations Consolidated<br />
2011 2010 2011 2010 2011 2010 2011 2010 2011 2010 2011 2010 2011 2010<br />
RM'000 RM'000 RM'000 RM'000 RM'000 RM'000 RM'000 RM'000 RM'000 RM'000 RM'000 RM'000 RM'000 RM'000<br />
Revenue<br />
External sales 141,599 146,952 95,384 155,276 1,600 5,427 20,109 21,921 3,140 2,292 - - 261,832 331,868<br />
Inter-segment sales 697 581 40,896 92,080 - 79 - - 30,610 9,839 (72,203) (102,579) - -<br />
Total segment revenue 142,296 147,533 136,280 247,356 1,600 5,506 20,109 21,921 33,750 12,131 (72,203) (102,579) 261,832 331,868<br />
Segment results 27,202 32,164 34,392 46,172 (316) 811 (892) 672 (887) 4,964 (306) (6,167) 59,193 78,616<br />
Results from operating activities<br />
Finance cost (508) (707) (2,169) (2,695) (3) (27) (433) (454) (4) (44) 686 2,022 (2,431) (1,905)<br />
Share of results of an associate (10) -<br />
Taxation (15,743) (20,478)<br />
Profit net of tax 41,009 56,233<br />
Non-controlling interest (212) (6,355)<br />
Net profit attributable to<br />
owners of the parent 40,797 49,878<br />
94 <strong>MITRA</strong>JAYA HOLDINGS BERHAD ANNUAL REPORT 2011<br />
Segments assests 67,643 72,622 386,813 405,493 2,104 1,555 24,003 21,298 14,467 7,413 - - 495,030 508,381<br />
Total assets 495,030 508,381<br />
Segment liabilities 46,664 56,012 25,351 32,117 427 727 9,507 6,788 3,164 3,096 - - 85,113 98,740<br />
Unallocated corporate liabilities 57,432 90,322<br />
Total liabilities 142,545 189,062<br />
Investment in an associate - - - - - - 4,490 - - - - - 4,490 -<br />
Capital expenditure 2,346 1,542 2,153 73 2 12 7,533 1,176 99 45 - - 12,133 2,848<br />
Depreciation 1,167 1,212 951 1,996 18 11 3,855 3,641 317 477 - - 6,308 7,337<br />
Impairment of investment<br />
properties 2,082 - - - - - - - - - - - 2,082 -<br />
Non-cash expenses other than<br />
depreciation 174 (189) 564 (42) (5) 15 281 145 (245) (5) - - 769 (76)