Evonik Industries AG
Evonik Industries AG
Evonik Industries AG

Create successful ePaper yourself
Turn your PDF publications into a flip-book with our unique Google optimized e-Paper software.
10 SEPTEMBER 21, 2010<br />
GLOBAL CORPORATE FINANCE<br />
and real estate divisions posted a decline in EBITDA of 19% and 16%, respectively, notwithstanding<br />
that the real estate business benefited from a one-off gain on disposals in FY 2008.<br />
For H1 2010, EI reported a 24% year-on-year increase in sales to €7.8 billion, supported by a sharp<br />
improvement in the performance of the group’s chemicals business. The chemicals division posted a<br />
34% increase in revenues, to €6.3 billion, driven by higher volumes (+25%) and prices (+7%).<br />
Currency effects and changes in the scope of consolidation were more or less neutral (+1%<br />
respectively), while the revenues of the energy and real estate businesses were flat to slightly down (-1%<br />
and -3%, respectively). EBITDA was sharply up (+83% to €1.5 billion), again mainly supported by<br />
the chemicals business (+91% to €1.2 billion).<br />
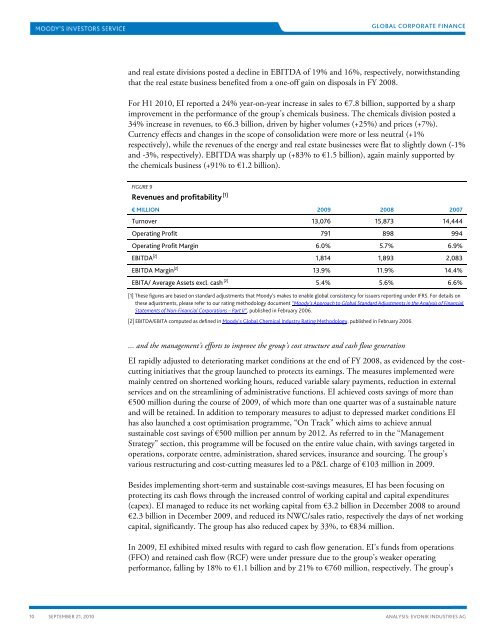
FIGURE 9<br />
Revenues and profitability [1]<br />
€ MILLION 2009 2008 2007<br />
Turnover 13,076 15,873 14,444<br />
Operating Profit 791 898 994<br />
Operating Profit Margin 6.0% 5.7% 6.9%<br />
EBITDA [2] 1,814 1,893 2,083<br />
EBITDA Margin [2] 13.9% 11.9% 14.4%<br />
EBITA/ Average Assets excl. cash [2] 5.4% 5.6% 6.6%<br />
[1] These figures are based on standard adjustments that Moody’s makes to enable global consistency for issuers reporting under IFRS. For details on<br />
these adjustments, please refer to our rating methodology document “Moody’s Approach to Global Standard Adjustments in the Analysis of Financial<br />
Statements of Non-Financial Corporations – Part II”, published in February 2006.<br />
[2] EBITDA/EBITA computed as defined in Moody’s Global Chemical Industry Rating Methodology, published in February 2006.<br />
... and the management’s efforts to improve the group’s cost structure and cash flow generation<br />
EI rapidly adjusted to deteriorating market conditions at the end of FY 2008, as evidenced by the costcutting<br />
initiatives that the group launched to protects its earnings. The measures implemented were<br />
mainly centred on shortened working hours, reduced variable salary payments, reduction in external<br />
services and on the streamlining of administrative functions. EI achieved costs savings of more than<br />
€500 million during the course of 2009, of which more than one quarter was of a sustainable nature<br />
and will be retained. In addition to temporary measures to adjust to depressed market conditions EI<br />
has also launched a cost optimisation programme, “On Track” which aims to achieve annual<br />
sustainable cost savings of €500 million per annum by 2012. As referred to in the “Management<br />
Strategy” section, this programme will be focused on the entire value chain, with savings targeted in<br />
operations, corporate centre, administration, shared services, insurance and sourcing. The group’s<br />
various restructuring and cost-cutting measures led to a P&L charge of €103 million in 2009.<br />
Besides implementing short-term and sustainable cost-savings measures, EI has been focusing on<br />
protecting its cash flows through the increased control of working capital and capital expenditures<br />
(capex). EI managed to reduce its net working capital from €3.2 billion in December 2008 to around<br />
€2.3 billion in December 2009, and reduced its NWC/sales ratio, respectively the days of net working<br />
capital, significantly. The group has also reduced capex by 33%, to €834 million.<br />
In 2009, EI exhibited mixed results with regard to cash flow generation. EI’s funds from operations<br />
(FFO) and retained cash flow (RCF) were under pressure due to the group’s weaker operating<br />
performance, falling by 18% to €1.1 billion and by 21% to €760 million, respectively. The group’s<br />
ANALYSIS: EVONIK INDUSTRIES <strong>AG</strong>