Programa Especial de Cambio Climático 2009-2012 - Semarnat
Programa Especial de Cambio Climático 2009-2012 - Semarnat
Programa Especial de Cambio Climático 2009-2012 - Semarnat

You also want an ePaper? Increase the reach of your titles
YUMPU automatically turns print PDFs into web optimized ePapers that Google loves.
<strong>Programa</strong> <strong>Especial</strong> <strong>de</strong> <strong>Cambio</strong> <strong>Climático</strong> <strong>2009</strong>-<strong>2012</strong> – DOF 28/08/<strong>2009</strong><br />
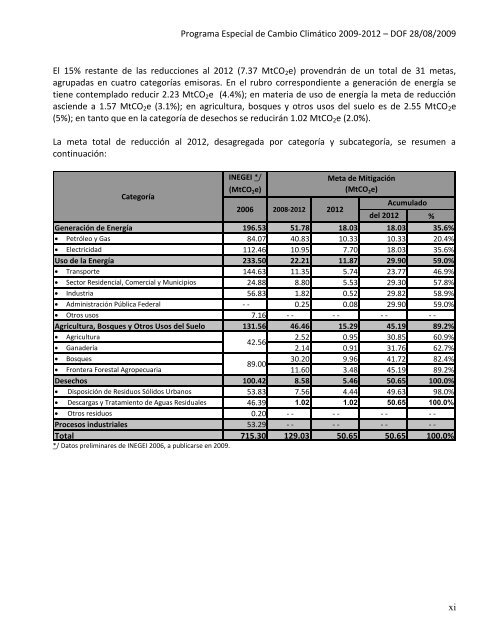
El 15% restante <strong>de</strong> las reducciones al <strong>2012</strong> (7.37 MtCO2e) provendrán <strong>de</strong> un total <strong>de</strong> 31 metas,<br />
agrupadas en cuatro categorías emisoras. En el rubro correspondiente a generación <strong>de</strong> energía se<br />
tiene contemplado reducir 2.23 MtCO2e (4.4%); en materia <strong>de</strong> uso <strong>de</strong> energía la meta <strong>de</strong> reducción<br />
ascien<strong>de</strong> a 1.57 MtCO2e (3.1%); en agricultura, bosques y otros usos <strong>de</strong>l suelo es <strong>de</strong> 2.55 MtCO2e<br />
(5%); en tanto que en la categoría <strong>de</strong> <strong>de</strong>sechos se reducirán 1.02 MtCO2e (2.0%).<br />
La meta total <strong>de</strong> reducción al <strong>2012</strong>, <strong>de</strong>sagregada por categoría y subcategoría, se resumen a<br />
continuación:<br />
Categoría<br />
INEGEI */<br />
(MtCO 2e)<br />
Meta <strong>de</strong> Mitigación<br />
(MtCO 2e)<br />
2006 2008-<strong>2012</strong> <strong>2012</strong><br />
Acumulado<br />
<strong>de</strong>l <strong>2012</strong> %<br />
Generación <strong>de</strong> Energía 196.53 51.78 18.03 18.03 35.6%<br />
Petróleo y Gas 84.07 40.83 10.33 10.33 20.4%<br />
Electricidad 112.46 10.95 7.70 18.03 35.6%<br />
Uso <strong>de</strong> la Energía 233.50 22.21 11.87 29.90 59.0%<br />
Transporte 144.63 11.35 5.74 23.77 46.9%<br />
Sector Resi<strong>de</strong>ncial, Comercial y Municipios 24.88 8.80 5.53 29.30 57.8%<br />
Industria 56.83 1.82 0.52 29.82 58.9%<br />
Administración Pública Fe<strong>de</strong>ral - - 0.25 0.08 29.90 59.0%<br />
Otros usos 7.16 - - - - - - - -<br />
Agricultura, Bosques y Otros Usos <strong>de</strong>l Suelo 131.56 46.46 15.29 45.19 89.2%<br />
Agricultura<br />
Gana<strong>de</strong>ría<br />
42.56<br />
2.52<br />
2.14<br />
0.95<br />
0.91<br />
30.85<br />
31.76<br />
60.9%<br />
62.7%<br />
Bosques<br />
Frontera Forestal Agropecuaria<br />
89.00<br />
30.20<br />
11.60<br />
9.96<br />
3.48<br />
41.72<br />
45.19<br />
82.4%<br />
89.2%<br />
Desechos 100.42 8.58 5.46 50.65 100.0%<br />
Disposición <strong>de</strong> Residuos Sólidos Urbanos 53.83 7.56 4.44 49.63 98.0%<br />
Descargas y Tratamiento <strong>de</strong> Aguas Residuales 46.39 1.02 1.02 50.65 100.0%<br />
Otros residuos 0.20 - - - - - - - -<br />
Procesos industriales 53.29 - - - - - - - -<br />
Total<br />
*/ Datos preliminares <strong>de</strong> INEGEI 2006, a publicarse en <strong>2009</strong>.<br />
715.30 129.03 50.65 50.65 100.0%<br />
xi