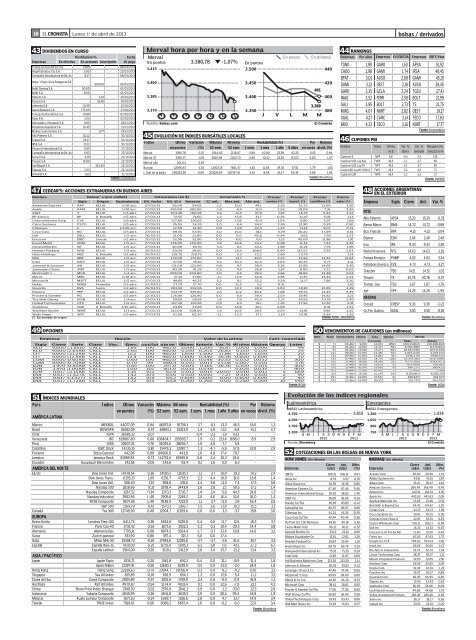
10 EL CRONISTA Lunes 1° de abril de 2013 43 DIVIDENDOS EN CURSO Distribucion % Fecha Empresas En efectivo En acciones Suscripción de pago Transp. De Gas del Sur S.A. 14,89 08/04/2013 Angel Estrada y Cia. S.A. 5,00 22/03/2013 Compañí a Introductora de Bs. As. S 8,27 08/03/2013 Impo. Y Expo. De la Patagonia S.A. 900,00 05/03/2013 Boldt Gaming S.A. 50,00 01/03/2013 Boldt S.A. 8,00 01/03/2013 Fiplasto S.A. 3,29 30/01/2013 Ferrum S.A. 18,58 29/01/2013 Ledesma S.A. 16,59 22/01/2013 Garcia Reguera S.A. 175,00 07/01/2013 Transp. De Gas del Sur S.A. 18,88 02/01/2013 Aluar S.A. 1,03 02/01/2013 Garovaglio y Zorraquin S.A. 9,60 28/12/2012 Petrobras Argentina S.A. 10,45 21/12/2012 Molinos Juan Semino S.A. 9,77 19/12/2012 Alto Palermo S.A. 111,12 30/11/2012 Cresud S.A. 24,17 30/11/2012 IRSA S.A. 31,11 30/11/2012 Ovoprot International S.A. 0,95 27/11/2012 Compañí a Introductora de Bs. As. S 6,93 23/11/2012 Ferrum S.A. 6,19 23/11/2012 Tenaris S.A. 13,00 22/11/2012 San Miguel S.A. 322,45 22/11/2012 Fiplasto S.A. 2,53 22/11/2012 Grimoldi S.A. 1,63 21/11/2012 Fuente: Economática 47 CEDEAR’S: ACCIONES EXTRANJERAS EN BUENOS AIRES 49 OPCIONES 45 EVOLUCIÓN DE ÍNDICES BURSÁTILES LOCALES Í ndice Último Variación Máximo Mí nimo Rentabilidad (%) Per Retorno en puntos (%) 52 sem. 52 sem. 1 sem. 1 mes 1 año 5 años en veces divid. (%) Merval 3380,78 -1,07 3544,85 2118,07 -2,99 10,90 25,59 62,25 0,55 0,94 Merval 25 3396,37 -1,09 3566,98 2160,70 -2,99 10,42 23,29 63,03 0,60 1,07 Merval u$s 401,04 -2,59 - - - - - - - - Burcap 12096,93 -1,01 12503,15 7661,47 -1,82 11,84 29,52 57,61 1,79 1,55 I. Gral de la bolsa 198283,30 -0,90 203225,03 130787,61 -1,61 8,68 26,17 69,34 2,89 1,94 Empresa Opción Valor de la prima Cant. negociada Sigla Cierre Serie Clase Vto. Ejerc. Accs/loteLote en $Último Anterior Var. % Mí nimoMáximoOperac. Lotes ALU 9,600 C1.85JU CALL - 1.85 100 960,0 1,000 1,200 -16,67 1,000 1,000 2 44 ALU 9,600C2.65AB CALL - 2.65 100 960,0 0,150 0,205 -26,83 0,150 0,150 1 25 CIT 9,600 C11.2AB CALL - 11.2 100 960,0 1,650 1,400 17,86 1,650 1,650 1 20 CIT 9,600C12.4AB CALL - 12.4 100 960,0 0,600 0,440 36,36 0,600 0,600 1 10 COM 9,600 0.60AB CALL - 0.60 100 960,0 0,032 0,046 -30,43 0,032 0,032 1 300 COM 9,600 0.70AB CALL - 0.70 99 950,4 0,010 0,013 -23,08 0,007 0,010 3 576 EDN 3,970 0.85AB CALL - 0.85 100 397,0 0,105 0,165 -36,36 0,100 0,105 3 400 EDN 3,970C1.00AB CALL - 1.00 101 401,0 0,035 0,039 - 0,025 0,035 7 900 EDN 0,617 C1.15AB CALL - 1.15 102 62,9 0,012 0,015 -20,00 0,010 0,012 5 669 ERA 0,617 C1.427A CALL - 1.42 103 63,6 0,510 0,550 -7,27 0,510 0,510 2 90 ERA 0,617 C1.427J CALL - 1.42 104 64,2 0,600 0,600 0,00 0,600 0,600 2 40 ERA 0,617 C1.72AB CALL - 1.72 105 64,8 0,260 0,260 0,00 0,240 0,260 10 590 Fuente: BCBA Fuente: Bloomberg Nombre Cedear´s (por unidad) Cotizaciones (en $) Incremento % Precio/ Precio/ Precio/ Precio Sigla Origen Equivalencia Ult. fecha Ult. dí a Anterior C/ ant. Mes ant. Año ant. ventas (*) benef. (*) cashflow (*) valor (*) American Express AXP EE.UU. 1/10 acc. 27/03/13 56,00 54,65 2,5 15,0 44,1 2,26 15,33 11,05 3,95 Apple AAPL EE.UU. 1/10 acc. 27/03/13 385,00 392,00 -1,8 6,9 11,0 2,52 10,04 7,31 3,26 At&T T EE.UU. 1/3 adrs 27/03/13 104,40 100,95 3,4 11,4 37,9 1,67 15,75 5,42 2,22 BP Amoco BP G. Bretaña 1/5 adrs 27/03/13 72,55 71,60 1,3 15,6 31,7 0,36 11,47 5,01 1,13 Chevrontexaco Corp CVX EE.UU. 1/8 adrs 27/03/13 127,80 126,65 0,9 13,6 41,4 1,04 9,80 5,97 1,69 Cisco Systems CSCO EE.UU. 1/5 adrs 27/03/13 35,05 34,35 2,0 6,4 34,3 2,36 12,90 9,39 2,00 Citigroup C EE.UU. 1/100 acc. 27/03/13 12,50 12,40 0,8 13,6 42,4 1,43 11,14 9,07 0,72 Coca-Cola KO EE.UU. 1/5 adrs 27/03/13 69,55 67,50 3,0 15,0 41,1 3,79 20,22 17,09 5,51 Dell DELL EE.UU. 1/5 acc. 26/02/13 21,00 21,00 0,0 0,0 45,8 0,44 9,62 7,58 2,33 Ericsson ERIC Suecia 1/2 adrs 20/12/12 32,90 32,90 0,0 0,0 0,0 1,15 45,09 11,86 1,91 Exxon Mobil XOM EE.UU. 1/5 acc. 27/03/13 155,05 150,00 3,4 10,6 34,2 0,98 11,42 7,43 2,45 General Electric GE EE.UU. 1/5 acc. 27/03/13 40,00 38,70 3,4 8,1 43,4 1,68 15,21 7,76 1,96 Hewlett-Packard HPQ EE.UU. 1/5 acc. 26/03/13 39,00 39,00 0,0 19,4 108,6 0,40 113,52 3,93 2,03 Hsbc Holdings HBC G. Bretaña 1/2 adrs 25/03/13 218,75 218,75 0,0 -3,3 23,2 2,46 13,79 - 1,14 IBM IBM EE.UU. 1/5 acc. 27/03/13 179,00 173,00 3,5 14,7 39,0 2,33 13,94 12,42 12,64 Intel INTC EE.UU. 1/5 acc. 27/03/13 37,00 35,10 5,4 10,4 32,4 2,05 10,25 5,77 2,11 Johnson & Johnson JNJ EE.UU. 1/5 acc. 27/03/13 131,00 132,00 -0,8 9,7 38,4 3,36 15,92 14,65 3,49 Jpmorgan Chase JPM EE.UU. 1/5 acc. 27/03/13 40,30 41,35 -2,5 5,4 36,8 1,67 8,00 7,22 0,93 Mcdonald's MCD EE.UU. 1/4 acc. 27/03/13 208,00 204,00 2,0 9,5 39,2 3,66 18,60 14,48 6,54 Merck MRK EE.UU. 1/10 acc. 27/03/13 37,15 37,80 -1,7 13,4 32,9 2,85 11,57 13,45 2,52 Microsoft MSFT EE.UU. 1/5 acc. 27/03/13 48,65 46,25 5,2 9,1 32,2 3,29 11,17 7,86 3,30 Nokia NOKA Finlandia 1/5 adrs 22/03/13 27,70 27,70 0,0 -11,5 3,2 0,31 - - 1,16 Novartis NVS Suiza 1/2 adrs 25/03/13 293,55 293,55 0,0 12,2 38,9 3,03 18,10 12,09 2,49 Pepsico PEP EE.UU. 1/2 adrs 27/03/13 333,70 325,60 2,5 11,2 40,2 1,88 19,34 14,49 5,49 Procter & Gamble PG EE.UU. 1/5 adrs 22/03/13 126,90 126,90 0,0 6,9 39,4 2,54 19,46 14,82 3,21 The Walt Disney DISN EE.UU. 1/4 acc. 27/03/13 59,60 58,65 1,6 7,9 42,4 2,37 18,56 13,78 2,49 United Technologies UTX EE.UU. 1/5 acc. 27/03/13 157,30 155,95 0,9 6,4 41,1 1,45 17,50 12,57 3,31 Vodafone VOD G. Bretaña 1/10 adrs 27/03/13 23,65 23,65 0,0 15,6 35,1 2,08 - 6,31 1,32 Wal-Mart Stores WMT EE.UU. 1/3 acc. 27/03/13 212,00 208,00 1,9 10,5 39,5 0,54 14,91 9,85 3,25 Wells Fargo (*) En moneda de orígen WFC EE.UU. 1/5 adrs 27/03/13 61,50 62,20 -1,1 13,3 37,1 2,14 10,91 3,34 1,35 Fuente: BCBA - Bloomberg 51 ÍNDICES MUNDIALES Paí s Í ndice Último Variación Máximo Mí nimo Rentabilidad (%) Per Retorno en puntos (%) 52 sem. 52 sem. 1 sem. 1 mes 1 año 5 años en veces divid. (%) AMÉRICA LATINA México MEXBOL 44077,09 0,94 46075,0 36756,1 3,7 -0,1 13,3 46,5 18,6 1,3 Brasil BOVESPA 56352,09 0,57 65593,1 52212,9 1,4 -1,9 -13,1 -6,8 41,1 4,7 Chile IGPA 21698,32 0,07 - - -0,4 -2,3 -1,9 62,1 - - Venezuela IBC 619867,80 0,00 638404,7 195993,7 -1,9 -0,2 213,4 1658,0 8,9 2,9 Perú IGRA 30607,01 0,76 34092,6 28196,7 1,0 -2,0 -7,7 5,8 - - Colombia IGBC Stock 14135,35 0,30 15478,3 12987,7 1,3 -4,7 -5,9 57,8 18,8 2,9 Panamá Bolsa General 442,96 0,00 100106,0 443,0 1,0 4,8 17,4 70,7 - - Jamaica Jamaica Stock 81989,84 -0,73 114752,6 81989,8 -0,8 -2,4 -10,3 -24,6 - - Ecuador Guayaquil Bolsa Index 142,56 0,05 142,6 92,4 0,1 1,6 5,8 6,3 - - AMÉRICA DEL NORTE EE.UU. Dow Jones Ind. 14578,54 0,36 14585,1 12035,1 1,1 3,7 10,9 19,3 14,2 2,4 Dow Jones Trans. 6255,33 1,00 6291,7 4795,3 2,3 4,4 19,0 31,6 18,8 1,4 Dow Jones Util. 508,40 1,15 508,8 435,6 2,4 5,8 11,5 7,4 17,5 3,8 Nasdaq 100 2818,69 0,31 2878,4 2443,9 1,6 2,9 2,1 59,5 17,2 1,4 Nasdaq Composite 3267,52 0,34 3270,3 2726,7 1,4 3,4 5,6 44,5 24,8 1,5 Nasdaq Industrial 2902,96 0,48 2905,8 2249,2 2,0 4,6 16,4 52,6 26,0 1,4 NYSE Composite 9107,05 0,40 9128,9 7222,9 1,1 2,7 11,5 3,9 16,4 2,6 S&P 500 1569,19 0,41 1570,3 1266,7 1,5 3,6 11,8 19,3 15,5 2,1 Canadá Tse 300 12749,90 0,40 12904,7 11209,6 0,0 -0,6 3,3 -3,7 15,8 3,0 EUROPA Reino Unido Londres Ftse-100 6411,74 0,38 6534,0 5229,8 0,4 0,8 11,7 12,6 18,3 3,7 Francia Paris Cac-40 3731,42 0,53 3871,6 2922,3 -1,2 0,2 10,4 -20,5 14,4 3,8 Alemania Alemania Dax 7795,31 0,08 8074,5 5914,4 -1,7 0,7 13,4 18,8 14,6 3,3 Suiza Zurich general 333,90 -0,86 557,4 321,1 -5,0 0,0 -17,4 - - - Italia Milan Mib-30 15338,72 -0,10 17983,6 12295,8 -3,7 -3,7 -3,6 -51,6 35,7 3,5 España España Ibex-35 7920,00 0,25 8755,9 5905,3 -5,2 -3,8 0,1 -41,1 27,3 6,7 España Latibex 2564,00 0,20 3110,1 2412,9 2,6 3,4 -15,7 -21,2 13,4 3,2 ASIA / PACÍ FICO Japón Japón Topix 1034,71 -0,20 1061,8 692,2 -0,4 0,0 21,1 -15,9 21,4 1,8 Japón Nikkei 12397,91 0,50 12650,3 8239,0 0,5 0,0 23,0 -2,0 24,9 1,6 Hong Kong Hang Seng 22299,63 -0,74 23944,7 18056,4 0,3 0,0 8,2 -4,2 10,6 3,2 Singapur Ses All index 815,89 -0,16 818,9 654,1 1,3 0,0 12,6 5,4 11,2 3,2 Corea del Sur Corea Composite 2004,89 0,57 2051,8 1759,0 2,3 0,0 -0,5 17,8 51,8 1,2 Australia ASX All index 4979,87 -0,54 5174,4 4033,4 0,1 0,0 12,6 -7,8 22,1 4,2 China Shore Price Index Shangai 2340,92 0,02 2570,0 2041,2 -3,9 0,0 -1,2 -33,0 12,3 2,6 Indonesia Yakarta Composite 4940,99 0,26 4941,0 3635,3 2,9 0,0 20,4 99,4 18,8 1,9 Malasia Kuala Lumpur Composite 1671,63 -0,14 1699,7 1526,6 2,8 0,0 4,7 33,7 14,9 3,4 Taiwán TWSE indec 7918,61 0,66 8089,2 6857,4 1,6 0,0 -0,2 -6,0 22,6 3,4 Fuente: Bloomberg 44 RANKINGS Empresas Per años Empresas EV/EBITDA Empresas EBIT/Vtas 46 CUPONES PBI 48 54 50 VENCIMIENTOS DE CAUCIONES (en millones) bolsas / derivados ACCIONES ARGENTINAS EN EL EXTERIOR Fuente: Economática Fuente: PUENTE Empresa Sigla Cierre Ant. Var. % NYSE Alto Palermo APSA 15,20 15,20 -0,33 Banco Macro BMA 14,72 14,72 -0,88 Bco. Francés BFR 4,15 4,15 -3,04 Edenor EDN 2,48 2,48 2,48 Irsa IRS 9,43 9,43 2,50 Nortel Inversora NTL 14,63 14,63 -1,81 Pampa Energí a PAMP 4,02 4,02 5,24 Petrobras Energí a PZE 4,73 4,73 -3,27 Telecóm TEO 14,51 14,51 -1,02 Tenaris TS 40,78 40,78 0,57 Transp. Gas TGS 1,67 1,67 -1,76 Ypf YPF 14,29 14,29 -1,99 NASDAQ Cresud CRESY 9,39 9,39 -0,21 Gr. Fin. Galicia GGAL 5,50 5,50 0,55 Fuente: Bloomberg Mon Plazo Vencimiento Ultimo Tasa Operac. Monto Promedio Ctdo Futuro $ 7 03-Abr 9,00 14,03 859 139.113.863 139.488.362 $ 8 04-Abr 14,50 14,37 59 8.350.489 8.376.803 $ 9 05-Abr 14,00 15,37 60 10.531.236 10.571.156 $ 12 08-Abr 15,00 14,48 55 4.015.030 4.034.153 $ 13 09-Abr 15,00 14,85 41 1.936.279 1.946.525 $ 14 10-Abr 16,00 14,74 128 16.379.381 16.471.986 $ 15 11-Abr 14,50 14,58 35 4.573.266 4.600.671 $ 16 12-Abr 16,10 16,10 5 425.909 428.915 $ 19 15-Abr 16,00 15,89 9 386.227 389.423 $ 20 16-Abr 17,00 16,99 1 2.000 2.018 $ 21 17-Abr 15,50 15,25 24 8.194.811 8.266.741 $ 23 19-Abr 16,00 15,59 6 389.847 393.677 $ 26 22-Abr 16,00 16,00 3 261.277 264.255 $ 28 24 Abr 16 00 15 60 8 138 401 Fuente: 140 058 BCBA 52 COTIZACIONES EN LAS BOLSAS DE NUEVA YORK DOW JONES (En dólares) Cierre Ant. Difer. Empresas (u$s) (u$s) (%) 3M Co 106,31 106,31 0,97 Alcoa Inc 8,52 8,52 0,35 Altria Group Inc 34,39 34,39 -0,06 American Express Co 67,46 67,46 0,46 American International Group 38,82 38,82 1,49 At&T Inc 36,69 36,69 0,19 Boeing Co/The 85,85 85,85 -0,41 Caterpillar Inc 86,97 86,97 0,08 Citigroup Inc 44,24 44,24 -0,49 Coca-Cola Co/The 40,44 40,44 0,55 Du Pont (E.I.) De Nemours 49,16 49,16 0,55 Exxon Mobil Corp 90,11 90,11 -0,52 General Electric Co 23,12 23,12 0,09 Motors Liquidation Co 12,61 12,61 -1,29 Hewlett-Packard Co 23,84 23,84 1,10 Home Depot Inc 69,78 69,78 0,19 Honeywell International Inc 75,35 75,35 0,24 Intel Corp 21,85 21,87 0,09 Intl Business Machines Corp 213,30 213,30 1,14 Johnson & Johnson 81,53 81,53 0,32 Jpmorgan Chase & Co 47,46 47,46 -0,65 Mcdonald' S Corp 99,69 99,69 0,80 Merck & Co. Inc. 44,20 44,20 0,23 Microsoft Corp 28,61 28,61 0,85 Procter & Gamble Co/The 77,06 77,06 0,00 Walt Disney Co/The 56,80 56,80 0,58 United Technologies Corp 93,43 93,43 0,89 Wal-Mart Stores Inc 74,83 74,83 0,07 TGNO 1,90 GARO 1,50 APSA 51,92 CADO 2,98 GAMI 1,74 IRSA 48,45 BPAT 3,01 AUSO 2,08 GAMI 45,19 GAMI 3,12 OEST 2,18 AUSO 28,45 GARO 3,35 GCLA 2,24 TGSU 27,41 INAG 3,52 FERR 2,58 BOLT 21,99 GALI 3,95 BOLT 2,73 TS 21,75 MIRG 4,07 NORT 2,82 OEST 19,17 GGAL 4,27 CARC 3,14 TECO 17,83 BRIO 4,33 TECO 3,16 NORT 17,77 Nombre Ticker Ultimo Var. % Var. % Recupero inv. en $ diaria semanal a dic/12 en % Cupón en $ TVPP 6,8 -0,4 2,3 136 Cupón en USD. Ley Arg. TVPA 46,5 -1,1 -3,7 69 Cupón en USD. Ley NY TVPY 46,5 -1,0 -3,7 69 Cupón USD. Ley NY (2010) TVY0 45,3 -3,2 -6,1 71 Cupón en EUR TVPE 56,4 -1,2 -3,1 72 NASDAQ (En dólares) Cierre Ant. Difer. Empresas (u$s) (u$s) (%) Acxiom Corp 20,40 20,40 1,19 Adobe Systems Inc 43,51 43,51 1,99 Altera Corp 35,47 35,47 2,16 Amazon.Com Inc 266,49 266,49 0,45 Amgen Inc 102,51 102,51 2,36 Apple Inc 442,63 442,63 -2,09 Applied Materials Inc 13,48 13,48 0,52 Bed Bath & Beyond Inc 64,42 64,42 -1,26 Cintas Corp 44,13 44,13 1,38 Cisco Systems Inc 20,91 20,91 0,38 Comcast Corp-Class A 42,01 42,01 0,62 Costco Wholesale Corp 106,11 106,11 -0,50 Dell Inc 14,33 14,33 -0,07 Ericsson (Lm) Tel-Sp Adr 12,60 12,60 0,48 Fiserv Inc 87,83 87,83 1,75 Google Inc-Cl A 794,03 794,03 -1,08 Intuit Inc 65,65 65,65 0,27 Kla-Tencor Corporation 52,74 52,74 1,93 Linear Technology Corp 38,37 38,37 1,11 Maxim Integrated Products 32,65 32,65 1,56 Nordson Corp 65,95 65,95 2,09 Oracle Corp 32,34 32,34 1,22 Paychex Inc 35,07 35,07 0,89 Qual<strong>com</strong>m Inc 66,95 66,95 0,40 Staples Inc 13,43 13,43 0,52 Starbucks Corp 56,96 56,96 0,09 Iac/Interactivecorp 44,68 44,68 1,78 Virtus Investment Partners 186,28 186,28 -0,65 Xilinx Inc 38,17 38,17 0,58 Yahoo! Inc 23,53 23,53 -0,25 Fuente: Bloomberg
materias primas / divisas 56 COTIZACIONES EN BOLSAS EUROPEAS LONDRES (En libras esterlinas) Empresa Jue.28 Mié.27 Var % Anglo American 1692,0 1692,0 -1,74 Astrazeneca 3299,5 3299,5 1,59 Aviva 296,2 296,2 -0,44 Bae Systems 394,3 394,3 2,74 Barclays 291,2 291,2 1,13 BG Group 1129,0 1129,0 0,58 Bp 459,9 459,9 -0,77 British American Tobacco 3527,0 3527,0 0,38 BT Group 278,0 278,0 1,28 Centrica 367,7 367,7 0,19 Compass 840,5 840,5 1,39 Hsbc 702,5 702,5 0,70 Imperial Tobacco 2299,0 2299,0 2,04 lloyds Banking 48,7 48,7 -0,02 National Grid 765,0 765,0 1,86 Prudential 1065,0 1065,0 1,33 Reckitt Benckiser 4718,0 4718,0 -1,19 Rio Tinto 3085,0 3085,0 -0,63 Rolls-Royce 1130,0 1130,0 1,89 Royal Dutch Shell 2129,0 2129,0 -0,93 Sabmiller 3464,0 3464,0 0,41 Standard Chartered 1703,5 1703,5 -0,03 Unilever 2784,0 2784,0 1,24 Vodafone PARIS (En euros) 186,6 186,6 0,32 Empresa Jue.28 Mié.27 Var. % Accor sa 27,1 27,1 0,65 Air liquide 94,8 94,8 0,51 Alcatel Lucent 1,1 1,1 2,64 Axa 13,4 13,4 -0,37 Banq natl paris 40,0 40,0 0,93 Bic 90,6 90,6 1,80 Carrefour 21,4 21,4 2,35 Danone 54,3 54,3 0,87 France tele<strong>com</strong> 7,9 7,9 -0,20 Legrand 34,0 34,0 0,34 L' oreal 123,7 123,7 2,53 Michelin-b 65,3 65,3 -0,59 Peugeot citroen 5,7 5,7 -0,91 Renault sa 48,9 48,9 -0,83 Soc generale-a 25,6 25,6 0,61 Thomson csf 33,0 33,0 1,32 Total MADRID (En euros) Ibex 37,4 37,4 -0,23 Empresa Jue.28 Mié.27 Var. % Abertis Infraestructuras Sa 13,1 13,1 -0,53 Acciona S.A. 42,5 42,5 -3,19 Acerinox Sa 8,0 8,0 0,00 Acs Actividades Const y Ser 18,2 18,2 0,97 Banco Bilbao Vizcaya Arg 6,8 6,8 -0,12 Banco de Sabadell S.A. 1,4 1,4 -0,14 Banco Español Crédito 3,2 3,2 1,09 Banco Popular Espanol 0,6 0,6 -0,34 Banco Santander Ctral Hisp 5,2 5,2 0,21 Bankinter S.A. 3,8 3,8 -0,79 Corporacion Mapfre S.A. 2,4 2,4 -0,82 Enagas 18,2 18,2 0,11 Endesa S.A. 16,5 16,5 0,67 Fomento De Construc y Con 7,4 7,4 -2,49 Gamesa Corp Tecnológica 2,4 2,4 -2,34 Gas Natural Sdg Sa 13,8 13,8 -1,36 Gestevisión Telecinco Sa 5,6 5,6 0,18 Grupo Ferrovial 12,4 12,4 0,41 Iberdrola Sa 3,6 3,6 -0,47 Inditex 103,4 103,4 2,27 Indra Sistemas S.A. 9,3 9,3 0,98 Metrovacesa S.A. 2,3 2,3 0,00 Nh Hoteles S.A. 2,5 2,5 5,58 Promot. Inform. Prisa 0,2 0,2 -2,17 Repsol Ypf S.A. 15,9 15,9 -0,03 Sacyr ValleHermoso Sa 1,4 1,4 -0,50 Telefonica S.A. 10,5 10,5 -0,19 Zeltia Latibex 1,3 1,3 1,19 Empresa Jue.28 Mié.27 Var. % Alfa S.a. de CV 1,9 1,9 1,06 América Móvil Sa CvSer L 0,9 0,9 1,92 Banco Bradesco S.A.-Pref 13,1 13,1 1,59 Banco De Chile 0,1 0,1 0,00 Bbva Banco Frances Sa 1,1 1,1 0,00 Bradespar Sa 10,0 10,0 -1,52 Bradespar Sa -Pref 10,1 10,1 -0,49 Braskem S.a. Pref. A 5,2 5,2 -3,66 Centrais Eletricas Bras B 4,9 4,9 12,80 Cí a Energét Minas Gerais 9,1 9,1 -0,28 Cí a Paranaense de Energí a 11,9 11,9 -0,21 Cí a Vale Do Rí o Doce 13,4 13,4 -0,44 Empresa Nac Electric Chile 1,3 1,3 0,37 Enersis Sa Chile 0,3 0,3 -0,33 Gerdau S.A. 6,0 6,0 1,05 Grupo Elektra S.a. Cv 32,0 32,0 -1,39 Grupo Modelo S.a. Serie C 7,1 7,1 -0,49 Net Servicos Comunic P 11,2 11,2 0,00 Petrobras - Petroleo Brazili 6,4 6,4 -1,45 Petrobras Petroleo Braz Pr 7,1 7,1 -1,88 T.v. Azteza S.a. cpo. 0,6 0,6 0,36 Usinas Sider. Minas 4,3 4,3 -1,49 Volcan Cí a Minera SaCmn B 0,7 0,7 1,33 74 VACUNOS Categorí a Precio por categoria Mí nimo Máximo Entrada (cabezas) 9.845 NOVILLOS - - 431 a 460 kgs 8,000 11,220 461 a 490 kgs. 8,000 11,000 491 a 520 kgs 8,900 10,800 + de 520 kgs 7,600 10,000 Nov. Regulares pes 7,200 7,200 Nov. Regulares Liv 9,100 11,000 Cruzas indicas 10,600 10,600 Cruzas europeas 8,500 8,500 Promedio novillos $ 8.973 Novillitos 300/350 - - Novillitos 351/390 7,000 12,100 Novillitos 391/430 7,000 11,700 Vaquillonas 300/340 - - Vaquillonas 351/390 8,000 11,020 Vaquillonas 391/430 7,300 10,200 Terneros 8,000 13,000 Vacas consumo 3,500 10,000 Vacas conserva 3,180 5,000 Toros 4,500 9,000 Fuente: Mercado de Liniers 75 MERCADO DISPONIBLE DE CEREALES ($ por Tonelada) Fuente: Bloomberg Grano B. Aires Rosario B. Blanca Quequén Trigo s/ctz s/ctz s/ctz s/ctz Maiz s/ctz s/ctz s/ctz s/ctz Sorgo s/ctz 830,00 s/ctz s/ctz Mijo s/ctz s/ctz s/ctz s/ctz Soja s/ctz s/ctz 1650,00 s/ctz Giras. s/ctz 1800,00 1620,00 1615,00 Lino s/ctz s/ctz s/ctz s/ctz Trigo Art 12 s/ctz s/ctz s/ctz s/ctz Fuente: Bolsa de Cereales de Bs. As. 57 FUTUROS AGROPECUARIOS Mes Mí nimo Máximo Último Anterior Var. % CHICAGO MAÍ Z (centavos de u$s x 25,401 kgs) Mar-2013 730,00 749,00 - 741,25 - May-2013 673,00 679,00 673,25 695,25 -3,16 Jul-2013 651,75 657,25 652,25 676,00 -3,51 Sep-2013 560,25 562,50 560,75 563,00 -0,40 Dic-2013 537,00 542,00 539,75 538,50 0,23 AVENA (centavos de u$s x 14,515 kgs) Mar-2013 0,00 0,00 - 423,25 - May-2013 392,75 395,00 392,75 396,25 -0,88 Jul-2013 385,00 385,50 385,25 391,25 -1,53 Sep-2013 361,00 363,50 361,00 378,25 -4,56 Dic-2013 356,00 357,00 356,00 361,00 -1,39 SOJA (centavos de u$s x 27,215 kgs) May-2013 1400,25 1403,75 1402,25 1404,75 -0,18 Jul-2013 1381,00 1384,75 1383,50 1385,50 -0,14 Ago-2013 1342,00 1342,00 1342,00 1346,75 -0,35 Sep-2013 1281,00 1284,00 1284,00 1285,00 -0,08 Nov-2013 1250,00 1252,75 1252,25 1251,50 0,06 HARINA DE SOJA (u$s x tonelada) May-2013 403,40 405,00 403,90 404,60 -0,17 Jul-2013 399,50 400,80 399,80 400,50 -0,17 Ago-2013 385,50 385,50 385,50 385,50 0,00 Sep-2013 - - 363,10 363,10 0,00 Oct-2013 348,00 348,00 348,00 347,90 0,03 ACEITE DE SOJA (centavos de u$s x libra) May-2013 49,81 50,07 50,07 50,11 -0,08 Jul-2013 50,16 50,32 50,32 50,35 -0,06 Ago-2013 50,20 - 50,20 50,34 -0,28 Sep-2013 - - 50,22 50,22 0,00 Oct-2013 - - 49,92 49,92 0,00 TRIGO (centavos de u$s x 27,215 kgs) Mar-2013 712,00 712,25 - 707,25 - May-2013 681,25 685,25 683,75 687,75 -0,58 Jul-2013 685,00 689,00 687,00 691,00 -0,58 Sep-2013 693,50 698,00 695,00 699,25 -0,61 Dic-2013 706,75 710,00 709,00 713,25 -0,60 NUEVA YORK AZÚCAR (centavos de u$s x libra) May-2013 17,56 17,95 17,62 17,85 -1,29 Jul-2013 17,60 17,91 17,68 17,82 -0,79 Oct-2013 18,04 18,31 18,11 18,25 -0,77 Mar-2014 18,94 19,18 19,01 19,14 -0,68 May-2014 19,13 19,35 19,21 19,30 -0,47 CAFÉ C (centavos de u$s x libra) Mar-2013 133,70 133,70 133,70 136,50 -2,05 May-2013 135,85 137,75 136,50 136,60 -0,07 Jul-2013 138,50 140,25 139,10 139,20 -0,07 Sep-2013 141,65 143,00 141,85 141,95 -0,07 Dic-2013 145,50 146,80 146,00 145,80 0,14 CACAO (u$s x tonelada) Mar-2013 - - - 2159,00 - May-2013 2142,00 2195,00 2167,00 2150,00 0,79 Jul-2013 2159,00 2209,00 2180,00 2163,00 0,79 Sep-2013 2176,00 2219,00 2194,00 2175,00 0,87 Dic-2013 2182,00 2224,00 2206,00 2184,00 1,01 LONDRES AZÚCAR (u$s x tonelada) May-2013 501,60 508,90 503,20 508,40 -1,02 Ago-2013 492,20 499,40 494,20 497,40 -0,64 Oct-2013 492,50 498,30 495,60 496,40 -0,16 Dic-2013 502,20 505,90 504,90 505,10 -0,04 Mar-2014 511,00 514,60 511,00 514,20 -0,62 CACAO (libras x tonelada) Mar-2013 1444,00 1458,00 - 1452,00 - May-2013 1452,00 1474,00 1468,00 1452,00 1,10 Jul-2013 1463,00 1484,00 1478,00 1463,00 1,03 Sep-2013 1478,00 1493,00 1486,00 1474,00 0,81 NUEVA YORK ALGODÓN (centavos de u$s x libra) May-2013 87,93 90,27 88,39 88,53 -0,16 Jul-2013 89,20 91,58 89,76 89,80 -0,04 Oct-2013 88,56 88,56 88,56 87,80 0,87 Dic-2013 86,90 88,48 87,25 87,25 0,00 Mar-2014 87,00 88,00 87,06 87,01 0,06 73 LEGUMBRES, ACEITES Y OTROS Fuente: Bloomberg 68 PRODUCTOS AVÍCOLAS Productos Unidad Precio Precio Insumos aví colas (en $ sin IVA) Min. Max. Pollas recriadas de 14 semanas de color c/u 24,00 26,00 Pollas recriadas de 14 semanas blanca c/u 24,00 25,00 Pollas recriadas de 18 semanas de color c/u 29,00 32,00 Pollas recriadas de 18 semanas blanca c/u 28,00 30,00 Pollita BB de alta postura blanca c/u 5,20 5,70 Pollita BB de alta postura color c/u 5,40 5,80 Pollito BB parrillero c/u 2,80 3,40 Gallina liviana blanca fuera de ciclo c/u 2,30 2,40 Gallina liviana color fuera de ciclo c/u 2,50 2,60 Pollo parrilero vivo (2,500 kg. a 2,800 kg.) c/u 7,75 8,25 Pollo parrill. evisc. mayorista CF y GBA Kg. 9,09 9,50 Pollo parrill. evisc. mayorista interior Kg. 9,30 9,71 Pollo con menudos mayorista Kg. - 4,07 Pollo sin menudos mayorista Kg. - 5,57 Pollo con menudos minorista Kg. - 6,03 Pollo sin menudos minorista Kg. - 8,26 Prod. aví colas (en $ con IVA) Prov. Bs. As. Huevo blanco grande Gran Merc Metrop. 12 7,00 7,50 Huevo color grande Gran Merc Metrop. 12 7,50 8,00 Huevo fresco puesto en fábrica Kg. 6,00 6,50 Cajón de 23,5 kg. promedio - 148,05 152,75 Fuente: Catedra Avícola Especie $ Pago LEGUMBRES (Embolsado, preparado sobre Bs. As. Por Kg) Arvejas 1,20 Contado Lentejas 4,5 mm arriba 3,50 Contado Porotos Alubias 210/100 3,20 Contado Colorados 2,50 Contado Manteca s/c. Contado Negros 2,80 Contado Pallares 6,00 Contado Especie u$s $ ACEITES (por Tm.) Algodón Neutro s/c. S/C Girasol Crudo s/c. 3.780 Girasol Refinado s/c. 4.260 Girasol (Crudo-Exp. Darsena) s/c. S/C Maní (Crudo-Exportación) s/c. S/C Maní (Crudo-Cons. Bs. As.) s/c. S/C Lino s/c. S/C Soja (Crudo-Exportación) s/c. S/c Soja (Refinado) s/c. 3.850 Soja (Crudo) s/c. 3.360 HARINA (Por Kg. En molino a granel) "0000" s/c. 2,300 "000" s/c. 0,942 "00" s/c. S/C MIEL EXPORTACION (En tambores y por Kg.) Extra Blanca s/c. 8,600 Ambar Clara s/c. 8,600 Cera (por Kg.) s/c. s/c. PASTO ALFALFA (Por Tm., pago a 15 dí as) Buenos Aires s/c. 890 Córdoba s/c. s/c. Santiago del Estero s/c. 670 Fuente: Bolsa de Cereales de Bs. As. 58 TIPOS DE CAMBIO CRUZADOS 61 MONEDAS DE ORO (u$s) Moneda Compra Venta Krugerrand 1.120 1.615 Mexicano 1.350 1.950 Chileno 660 950 Libra Elizabeth 265 380 Doble Aguila 1.120 1.615 Argentino 260 375 64 66 (cents. u$s Aust./kg.) Fecha Compra Venta Abr-13 - - Jun-13 1205 - Ago-13 - - Oct-13 - - Dic-13 - - Feb-14 - - Fuente: PUENTE. CHICAGO (u$s/onT) Entrega Compra Venta Abr-13 28,23 28,26 May-13 28,27 28,28 Jul-13 28,32 28,34 Dic-13 28,46 28,48 Ene-14 28,45 28,57 Mar-14 28,50 28,57 MERCADO CENTRAL DE BUENOS AIRES Corporación del Mercado central de Buenos Aires Precios modales mayoristas por Kg. netos de impuestos Plazo Contrato Apertura Mí nimo Máximo Cierre May-13 29/05/2013 1.598,0 1.598,0 1.601,0 1.601,0 Jun-13 26/06/2013 1.598,1 1.597,7 1.601,6 1.601,4 Ago-13 28/08/2013 1.607,1 1.596,5 1.608,6 1.597,9 Oct-13 29/10/2013 1.608,8 1.598,6 1.609,2 1.599,1 Dic-13 27/12/2013 1.606,2 1.605,9 1.606,2 1.606,0 PRIMERA RUEDA Aluminio 1ra calidad u$s por tn. -Fuente: 1881,5 BNA y Puente 1910,5 Hnos. Aleación Aluminio u$s por tn. - 1803 1815 Cobre alta pureza (*) u$s por tn. PlomoMETALES EN u$s LONDRES por tn. - - 7582 2094 7613,5 2115 Ní quel u$s por tn. - 16540 16700 Estaño alta pureza u$s por tn. - 23150 23190 Cinc alta pureza SEGUNDA RUEDA u$s por tn. - 1870,5 1898,5 Aluminio 1ra calidad u$s por tn. - 1885 1914 Aleación Aluminio u$s por tn. - 1805 1815 Cobre alta pureza u$s por tn. - 7576 7605 Plomo u$s por tn. - 2100 2120 Ní quel u$s por tn. - 16660 16730 Estaño alta pureza u$s por tn. - 23155 23200 Cinc alta pureza u$s por tn. - 1872 1903 Platino u$s p/oz. Tr. - 1576 Paladio u$s p/oz. Tr. - 770 (*) Datos del dia: 31-03-13 Fuente: Bloomberg LANAS EN SYDNEY 69 Euro Libra sueca danesa suizo noruega Dólar canadiense australiano neozelandés Yenes Euro - 1,1872 0,1197 0,1341 0,8217 0,1335 0,7811 0,7678 0,8130 0,6532 0,8288 Libra esterlina 0,8424 - 0,1008 0,1130 0,6922 0,1124 0,6580 0,6467 0,6848 0,5503 0,6981 Corona sueca 8,3583 9,9226 - 1,1208 6,8666 1,1153 6,5272 6,4161 6,7941 5,4594 6,9252 Corona danesa 7,4553 8,8508 0,8922 - 6,1264 0,9948 5,8235 5,7243 6,0611 4,8696 6,1789 Franco suizo 1,2169 1,4447 0,1456 0,1632 - 16,2425 0,9506 0,9343 0,9894 0,7950 1,0085 Corona noruega 7,4931 8,8934 0,0090 1,0050 6,1567 - 5,8526 5,7529 6,0912 4,8946 6,2094 Dólar 1,2802 1,5198 0,1532 0,1717 1,0520 0,1709 - 0,9829 1,0408 0,8363 0,0106 Dólar canadiense 1,3024 1,5462 0,1559 0,1747 1,0702 0,1738 1,0173 - 1,0589 0,8508 0,0108 Dólar australiano 1,2300 1,4602 0,1472 0,1650 1,0107 0,1642 0,9608 0,9444 - 0,8035 1,0193 Dólar neozelandés 1,5308 1,8173 0,1831 0,2053 1,2578 0,2043 1,1957 1,1754 1,2445 - 0,0127 Yen 120,6600 143,2470 14,4410 16,1850 99,1540 16,1046 94,2500 92,6460 98,1050 78,8250 - Fuente: Bloomberg 59 MERCADO DE ORO EN BS. AS. Gramaje Bco Ciudad (en $) Puente (en u$s) Barras Superville (en $) Compra Venta Compra Venta de oro Compra Venta 18 Kl x g. 174,99 - - - - - - 24 Kl x g. 249,98 401,4 - - - - - 24 Kl x 100 g. 24.998,00 38.642,90 4650 5550 - - - 24 Kl x 1000 g. 249.980,00 386.429,29 46500 55900 - - - 70 62 ORO FUTURO NUEVA YORK (u$s por onza troy) PLATA A FUTURO Fuente: Bloomberg Fuente: Bloomberg 77 Fuente: Bloomberg 60 ORO / PLATA DISPONIBLE Plazo Compra Venta Anterior ORO (u$s por onza troy) N. York 1.597,75 1.598,25 1.598,75 Londres 1.597,75 1.598,25 1.598,25 Hong Kong 1.504,05 1.504,55 - PLATA (u$s por onza troy) N. York 27,75 28,25 28,46 Londres 28,64 28,64 - Fuente: Bloomberg MERCADO CAMBIARIO (en $) 65 CAMBIO CONTRA u$s EN AMÉRICA LATINA Moneda Unidad Banco Nación Argentina Casa de cambio Paí s Último Anterior Var. % Compra Venta Compra Venta Bolivia (Peso) 7,010 6,910 1,443 Libra esterlina 1 7,6799 7,7557 7,5051 8,0421 Brasil (Real) 2,022 2,011 0,532 Dólar EE.UU. 1 5,0820 5,1220 5,1050 5,1550 Chile (Pesos) 472,150 471,670 0,102 Franco Suizo Yen Dólar Canadiense Corona Danesa Corona Noruega 100 100 100 100 100 532,6586 5,3807 499,8000 86,9428 86,5613 537,5937 5,4306 504,3436 88,1482 87,8080 500,4902 5,2092 468,3486 77,3485 70,9028 560,3261 5,7921 536,9792 95,4630 97,2642 Colombia (Pesos) 1825,000 1827,270 México (Pesos) 12,335 12,331 Paraguay (Guaraní ) 4008,000 4008,000 Perú (Sol) 2,590 2,590 Uruguay (Pesos) 18,850 18,820 Venezuela (Bolivar) 6292,100 6292,100 -0,124 0,034 0,000 0,000 0,159 0,000 Corona Sueca EURO 100 1 77,7548 6,4862 78,9482 6,5500 71,9014 6,6299 84,5082 6,7802 Fuente: Bloomberg Dólar Australiano 100 - - 495,6311 554,3011 Yuang 100 76,1940 88,8793 Reales 100 - - 255,2500 271,3158 Uruguayos 100 - - 26,7277 29,9709 Chilenos 100 - - 1,0635 1,2573 Mexicanos 100 - - 38,0970 41,5726 Bolí vares 100 - - 51,0500 125,7317 Colombianos 100 - - 0,2553 0,2946 Guaraní es 100 - - 0,1160 0,1432 71 METALES EN LONDRES 76 PRECIOS FOB Cierre de rueda al 28/03/2013 Productos Unidad Fuente: Banco Nación y PUENTE Contado 3 Meses Compra Venta Venta FRUTAS Ult. Dif % Ant. HORTALIZAS Ult. Dif % Ant. Anana Comercial 0,00 0,00 2.03 Acelga Comercial 1.57 -1.25 1.59 Banana Brasil Comercial 0,00 0,00 0.74 Ajo Comercial 0.86 -1.14 0.87 Banana Brasil Común 0,00 0,00 0.56 Ajo Común 0.47 -2.08 0.48 Banana Importada Comercial 4.83 0,00 5.08 Apio Comercial 4.53 0.89 4.49 Banana Importada Común 3.54 0,00 3.86 Batata Comercial 3.09 -0.64 3.11 Banana Nacional Comercial 0,00 -4.92 1.00 Berenjena Comercial 0.98 1.03 0.97 Banana Nacional Común 0,00 -8.29 3.47 Berenjena Común 0,00 0,00 3.45 Ciruela Comercial 0,00 -1.09 2.93 Cebolla Comercial 1.69 0.00 1.69 Ciruela Común 0,00 0,00 2.14 Cebolla Común 0,00 0,00 1.36 Durazno Comercial 5.50 0,00 6.10 Chaucha Comercial 3.86 -1.78 3.93 Durazno Común 4.16 0,00 3.50 Chaucha Común 0,00 0,00 1.10 Frutilla Comercial 0,00 0,00 9.80 Choclo Comercial 0,00 0,00 3.64 Frutilla Común 0,00 0,00 8.89 Choclo Común 0,00 0,00 1.26 Kiwi Comercial 0,00 0,00 2.89 Coliflor Comercial 1.38 0.00 1.38 Limon Comercial 3.02 -9.83 3.51 Lechuga Comercial 1.86 47.61 1.26 Limon Común 1.76 18.85 2.32 Papa Comercial 1.99 2.05 1.95 Limon Bolsa Comercial 0,00 -6.61 0.26 Papa Común 1.14 -0.86 1.15 Limon Bolsa Común 0,00 0,00 0.21 Papa Superior 0,00 0,00 1.22 Mandarina Comercial 0,00 0,00 2.06 Pepino Comercial 1.50 0.00 1.50 Mandarina Criolla Comercial 0,00 0,00 0.26 Pimiento Comercial 0,00 0,00 1.17 Mandarina Criolla Común 0,00 0,00 0.21 Pimiento Común 0,00 0,00 2.74 Manzana G. Smith Comercial 4.65 -3.92 4.84 Pimiento Verde Comercial 2.11 -0.47 2.12 Manzana G. Smith Común 3.69 -2.38 3.78 Remolacha Comercial 0,00 0,00 3.27 Manzana Red Delici Comercial 4.65 -5.10 4.90 Repollo Comercial 0,00 -1.71 3.50 Manzana Red Delici Común 3.39 3.66 3.27 Tomate Perita Comercial 0,00 0.75 1.33 Melon Comercial 0,00 0,00 3.00 Tomate Perita Común 0,00 0.00 1.76 Naranja Jugo Comercial 2.45 -6.84 2.63 Tomate Redondo Comercial 0,00 0.00 1.53 Naranja Jugo Común 1.86 -7.46 2.01 Tomate Redondo Común 3.21 -0.92 3.24 Naranja Ombligo Comercial 0,00 0,00 0.40 Tomate Redondo Superior 2.24 -4.27 2.34 Naranja Ombligo Común 0,00 0,00 0.30 Zanahoria Comercial 4.05 0.24 4.04 Pera Comercial 4.40 0.68 4.37 Zanahoria Común 3.22 0.31 3.21 Pomelo Comercial 0,00 0,00 3.27 Zapallito Comercial 3.97 -0.25 3.98 Pomelo Blanco Comercial 0,00 0,00 1.12 Zapallito Común 2.07 -0.95 2.09 Uva Comercial 0,00 0,00 4.65 Zapallito Anco Comercial 2.36 -0.42 2.37 Uva Común 0,00 0,00 3.95 Zapallito Anco Común 1.05 -1.86 1.07 Datos al 26-Mar-13 Fuente: Nosis/Mercado Central de Bs. As. Pto. Argentino Trigo Maí z Soja Girasol Mar-13 325,00 - - 620,00 Abr-13 - 275,68 - - May-13 - 275,68 548,87 - Golfo de México Trigo Maí z Sorgo Soja Mar-13 294,60 - 303,60 - Abr-13 294,60 316,62 - 563,20 May-13 294,30 314,85 307,60 562,83 Jun-13 290,65 311,41 307,60 554,84 Jul-13 288,81 308,65 299,70 554,84 Fuente: Bolsa de Cereales de Bs. As. Lunes 1° de abril de 2013 Fuente: Bco. Ciudad/PUENTE. 67 MERCADO A TERMINO DE BUENOS AIRES Inicial Alto Bajo Variación Vol.. Val. Tons (Tons) Producto Tons operado abiertas ?Trigo BA Disp. $ -.- -.- -.- 0.00 -.- -.- -.- Trigo BA Disp. u$s -.- -.- -.- 0.00 -.- -.- -.- Trigo BA 05/13 -.- -.- -.- 0.00 -.- -.- -.- Trigo BA 07/13 252.0 252.0 252.0 0.00 500 126.000 87.000 Trigo BA 09/13 -.- -.- -.- 0.00 -.- -.- 900 Trigo BA 01/14 185.0 185.0 185.0 0.00 3.900 721.500 25.400 Trigo BA 02/14 -.- -.- -.- 0.00 -.- -.- -.- Trigo BA 03/14 -.- -.- -.- 0.00 -.- -.- 200 Trigo Chicago 07/13 -.- 795.00 675.00 0.51 800 588.000 100 Trigo Chicago 09/14 -.- 801.75 681.75 0.58 1.000 741.750 400 Trigo Chicago 12/14 -.- 814.50 694.50 1.00 400 301.800 500 Cebada QQ Disp. u$s -.- -.- -.- -2.33 -.- -.- -.- Cebada QQ 05/13 -.- -.- -.- -2.22 -.- -.- 100 Cebada QQ 01/14 -.- -.- -.- -2.72 -.- -.- 100 Maí z BA Disp. $ 880.0 880.0 880.0 -2.22 -.- -.- -.- Maí z Ros Disp. u$s -.- -.- -.- 0.29 -.- -.- -.- Maí z Ros 04/13 171.0 172.0 171.0 0.29 34.700 5.968.400 230.700 Maí z Ros 05/13 -.- -.- -.- -0.58 17.300 2.966.950 27.400 Maí z Ros 06/13 -.- -.- -.- -0.58 -.- -.- -.- Maí z Ros 07/13 172.0 173.0 172.0 -0.29 16.900 2.923.700 189.800 Maí z Ros 09/13 -.- -.- -.- 0.58 3.500 605.500 10.800 Maí z Ros 12/13 -.- -.- -.- 0.28 -.- -.- 1.500 Maí z Ros 04/14 170.0 170.0 170.0 -0.59 1.000 168.500 5.600 Maí z Chicago 05/13 -.- 775.50 695.50 0.58 600 441.300 2.000 Maí z Chicago 07/14 -.- 756.50 676.50 0.56 1.000 716.500 700 Sorgo Ros Disp. u$s -.- -.- -.- 0.00 -.- -.- -.- Sorgo Ros 04/13 -.- -.- -.- 0.00 -.- -.- 1.000 Gira. Ros Disp. u$s -.- -.- -.- 0.00 -.- -.- -.- Gira. Ros 07/13 -.- -.- -.- 0.00 -.- -.- -.- Soja Ros Disp. $ -.- -.- -.- 0.60 -.- -.- -.- Soja Ros Disp.Fáb. $ -.- -.- -.- 0.60 -.- -.- -.- Soja Ros Disp. u$s -.- -.- -.- -0.85 -.- -.- -.- Soja Ros 04/13 326.0 327.0 326.0 -0.55 7.100 2.321.700 37.400 Soja Ros 05/13 328.0 328.0 326.3 -0.24 37.800 12.375.720 844.000 Soja Ros 07/13 331.0 332.0 330.0 -0.06 11.000 3.652.000 304.800 Soja Ros 09/13 -.- -.- -.- -0.30 -.- -.- 1.400 Soja Ros 11/13 333.9 335.0 333.9 -0.21 10.400 3.480.880 205.500 Soja Ros 05/14 305.5 305.5 305.0 -0.16 1.600 488.000 10.900 Soja Chicago 05/13 -.- 1523.50 1383.50 0.35 1.100 1.598.850 100 Soja Chicago 07/13 -.- 1500.00 1360.00 0.21 1.633 2.335.304 5.308 Soja Chicago 11/13 -.- 1349.00 1209.00 0.12 1.497 1.914.650 5.716 TOTALES 153.730 44.437.005 1.999.323 Dólares por tonelada Fuente: Bolsa de Cereales de Bs. As. 72 MERCADO A TERMINO DE ROSARIO Cierre de rueda al 27/03/13 Posición Anterior Primero Mí n. Máx. Ultimo Vol. Ajuste Var.% TVPP052013 6,872 6,825 6,775 6,845 6,845 375 6,845 -0,39 TVPP122013 7,885 7,8 7,8 7,8 7,8 200 7,813 -0,91 DLR032013 5,121 5,123 5,122 5,123 5,122 15.150 5,1223 0,03 DLR042013 5,222 5,228 5,221 5,23 5,222 49.930 5,222 DLR052013 5,317 5,328 5,31 5,328 5,319 17.242 5,319 0,04 DLR062013 5,4 5,41 5,41 5,427 5,415 13.165 5,415 0,28 DLR072013 5,51 5,52 5,516 5,52 5,516 3.266 5,516 0,11 DLR082013 5,61 5,63 5,623 5,63 5,623 12.160 5,623 0,23 DLR092013 5,705 5,73 5,73 5,73 5,73 1.000 5,73 0,44 DLR102013 5,828 5,85 5,839 5,85 5,85 10.820 5,85 0,38 DLR112013 5,95 5,96 0,17 DLR122013 6,061 6,06 6,06 6,06 6,06 67 6,06 -0,02 DLR012014 6,166 6,166 RFX000000 5,12 5,1221 0,04 ECU032013 6,598 6,5402 -0,88 ECU042013 6,794 6,762 -0,47 ECU052013 6,83 6,83 6,832 6,832 5.000 6,831 ORO042013 1.621,30 1.629,00 0,48 ORO052013 1.628,30 1.637,00 0,53 ORO062013 1.635,30 1.645,00 1.634,70 1.645,00 1.645,00 940 1.645,00 0,59 ORO122013 1.679,50 1.686,00 1.686,00 1.690,90 1.690,90 82 1.690,90 0,68 WTI052013 96,83 97,19 0,37 WTI112013 94,69 95,01 94,95 95,01 94,95 57 94,95 0,28 ISR052013 323,1 323 322,2 325 325 419 325 0,59 ISR072013 326,6 326,1 326 327,7 327,7 600 328,1 0,46 ISR112013 331,7 331,2 331,2 332,7 332,7 141 332,7 0,3 ISR052014 303 303 MAI000000 173 171 -1,16 MAI042013 173 170 170 171 171 29 171 -1,16 MAI052013 172,5 171,5 -0,58 MAI072013 173,5 173 -0,29 CRN042013 287,5 289,5 289,5 289,5 289,5 150 289,5 0,7 CRN112013 227 225,9 225,9 227 227 616 227 SOF000000 327,5 326 -0,46 SOJ000000 329 327 -0,61 SOF042013 327,5 327 325,5 327 325,5 92 326 -0,46 SOF052013 326 326,5 326,5 327,5 327,5 357 327,5 0,46 SOJ052013 327,5 327,6 327,5 328,5 328,5 248 328,5 0,31 SOJ062013 330 331 0,3 SOF072013 330,4 330 330 331,5 331,5 20 331,5 0,33 SOJ072013 331,5 332 0,15 SOF092013 332,5 332,3 332,3 332,3 332,3 4 333 0,15 SOF112013 335,5 335,5 335,5 336,2 336,2 21 336,2 0,21 SOJ112013 336 336,5 0,15 Producto Tipo Volumen Volumen Interés Abierto Interés Abierto Variación IA Variación IA (Ctos) (Tons) (Ctos) (Tons) (Ctos) (Tons) Indice Soja Rosafé Futuro 1.160 34.800 5.710 171.300 -108 -3.240 Indice Soja Rosafé Put 113 3.390 1.539 46.170 -33 -990 Indice Soja Rosafé Call 95 2.850 2.831 84.930 1 30 Trigo Futuro 17 510 706 21.180 2 60 Maí z Futuro 29 870 1.060 31.800 -12 -360 Soja Futuro 742 22.260 12.516 375.480 -272 -8.160 Dólar USA A3500 Futuro 122.800 1.493.776 -402.858 Dólar USA A3500 Call 6.006 -444 Euro EU Futuro 5.000 5.750 -650 Oro Futuro 1.022 14.524 -258 Oro Call 26.202 Petróleo Crudo WTI Futuro 57 790 39 Soja Chicago Futuro 732 3.660 3.188 15.940 -199 -995 Maí z Chicago Futuro 766 3.830 574 2.870 Cupón PBI Futuro 575 2.513 -475 GRANOS MERCADO OPCIONES (u$s. por Tonelada) EL CRONISTA 11 63 PETROLEO WTI (u$s por barril) Fuente: Bloomberg Fuente: Rofex® Posición Mes Prec. Ejerc. Máximo Mí nimo Cierre CALL Soja Rosario Nov.13 330,00 4,50 4,50 4,50 350,00 1,00 1,00 1,00 362,00 6,70 6,50 6,70 370,00 0,10 0,10 0,10 Nov.13 360,00 6,50 6,50 6,50 PUT Maí z Rosario May.13 290,00 0,10 0,10 0,10 310,00 5,90 5,80 5,80 322,00 6,50 6,50 6,50 326,00 5,20 5,10 5,10 330,00 7,50 7,50 7,50 Fuente: Bolsa de Cereales de Bs. As.