Lineamientos Operativos del Sistema de Monitoreo para la Gestión
Lineamientos Operativos del Sistema de Monitoreo para la Gestión
Lineamientos Operativos del Sistema de Monitoreo para la Gestión
Create successful ePaper yourself
Turn your PDF publications into a flip-book with our unique Google optimized e-Paper software.
SEGUNDO NIVEL<br />
Porcentaje o minutos<br />
Porcentaje<br />
Comportamiento <strong><strong>de</strong>l</strong> tiempo <strong>de</strong> espera y satisfacción por tiempo <strong>de</strong> espera en<br />
urgencias<br />
100<br />
90<br />
80<br />
70<br />
60<br />
50<br />
40<br />
30<br />
20<br />
10<br />
0<br />
n =<br />
ENE FEB<br />
1 14<br />
M AR ABR M AY JUN JUL AGO SEPT OCT NOV DIC<br />
21 21 18 18 20 22 24 25 27 23<br />
Mes y número <strong>de</strong> entida<strong>de</strong>s que informan<br />
100<br />
90<br />
80<br />
70<br />
60<br />
50<br />
40<br />
30<br />
20<br />
10<br />
estándar <strong>de</strong><br />
sa tisfa cc. X tiem po<br />
<strong>de</strong> espera<br />
% sa tisfa cc. x<br />
tiempo <strong>de</strong> espera<br />
estándar <strong>de</strong><br />
tiempo <strong>de</strong> espera<br />
minutos <strong>de</strong> tiempo<br />
<strong>de</strong> espera<br />
GRÁFICA 4<br />
Comportamiento <strong><strong>de</strong>l</strong> surtido <strong>de</strong> recetas y satisfacción en urgencias<br />
0<br />
n =<br />
ENE FEB<br />
1 14<br />
M AR ABR M AY JUN JUL AGO SEPT OCT NOV DIC<br />
21 21 18 18 20 22 24 25 27 23<br />
Mes y número <strong>de</strong> entida<strong>de</strong>s que informan<br />
estándar<br />
% sa tisfa cc. x<br />
recetas surtidas<br />
% <strong>de</strong> re ce ta s<br />
surtidas<br />
GRÁFICA 5<br />
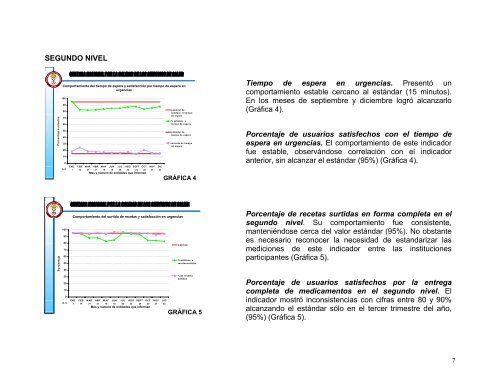
Tiempo <strong>de</strong> espera en urgencias. Presentó un<br />
comportamiento estable cercano al estándar (15 minutos).<br />
En los meses <strong>de</strong> septiembre y diciembre logró alcanzarlo<br />
(Gráfica 4).<br />
Porcentaje <strong>de</strong> usuarios satisfechos con el tiempo <strong>de</strong><br />
espera en urgencias. El comportamiento <strong>de</strong> este indicador<br />
fue estable, observándose corre<strong>la</strong>ción con el indicador<br />
anterior, sin alcanzar el estándar (95%) (Gráfica 4).<br />
Porcentaje <strong>de</strong> recetas surtidas en forma completa en el<br />
segundo nivel. Su comportamiento fue consistente,<br />
manteniéndose cerca <strong><strong>de</strong>l</strong> valor estándar (95%). No obstante<br />
es necesario reconocer <strong>la</strong> necesidad <strong>de</strong> estandarizar <strong>la</strong>s<br />
mediciones <strong>de</strong> este indicador entre <strong>la</strong>s instituciones<br />
participantes (Gráfica 5).<br />
Porcentaje <strong>de</strong> usuarios satisfechos por <strong>la</strong> entrega<br />
completa <strong>de</strong> medicamentos en el segundo nivel. El<br />
indicador mostró inconsistencias con cifras entre 80 y 90%<br />
alcanzando el estándar sólo en el tercer trimestre <strong><strong>de</strong>l</strong> año,<br />
(95%) (Gráfica 5).<br />
7


