26. obtención de financiamiento para los proyectos del plan maestro
26. obtención de financiamiento para los proyectos del plan maestro
26. obtención de financiamiento para los proyectos del plan maestro

Create successful ePaper yourself
Turn your PDF publications into a flip-book with our unique Google optimized e-Paper software.
Plan Maestro <strong>de</strong> Transporte Urbano <strong>para</strong> el Área Metropolitana <strong>de</strong> Lima y Callao en la República <strong>de</strong>l Perú<br />
(Fase 1)<br />
Borrador <strong>de</strong>l Informe Final<br />
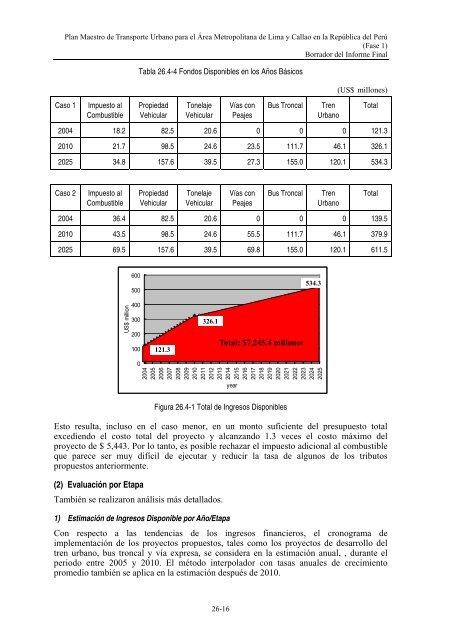
Tabla <strong>26.</strong>4-4 Fondos Disponibles en <strong>los</strong> Años Básicos<br />
(US$ millones)<br />
Caso 1<br />
Impuesto al<br />
Combustible<br />
Propiedad<br />
Vehicular<br />
Tonelaje<br />
Vehicular<br />
Vías con<br />
Peajes<br />
Bus Troncal<br />
Tren<br />
Urbano<br />
Total<br />
2004 18.2 82.5 20.6 0 0 0 121.3<br />
2010 21.7 98.5 24.6 23.5 111.7 46.1 3<strong>26.</strong>1<br />
2025 34.8 157.6 39.5 27.3 155.0 120.1 534.3<br />
Caso 2<br />
Impuesto al<br />
Combustible<br />
Propiedad<br />
Vehicular<br />
Tonelaje<br />
Vehicular<br />
Vías con<br />
Peajes<br />
Bus Troncal<br />
Tren<br />
Urbano<br />
Total<br />
2004 36.4 82.5 20.6 0 0 0 139.5<br />
2010 43.5 98.5 24.6 55.5 111.7 46.1 379.9<br />
2025 69.5 157.6 39.5 69.8 155.0 120.1 611.5<br />
600<br />
500<br />
534.3 534.3<br />
US$ million<br />
400<br />
300<br />
200<br />
100<br />
121.3<br />
121.3<br />
3<strong>26.</strong>1<br />
3<strong>26.</strong>1<br />
Total: $7,245.4 millones<br />
0<br />
2004<br />
2005<br />
2006<br />
2007<br />
2008<br />
2009<br />
2010<br />
2011<br />
2012<br />
2013<br />
2014<br />
2015<br />
2016<br />
2017<br />
2018<br />
2019<br />
2020<br />
2021<br />
2022<br />
2023<br />
2024<br />
2025<br />
year<br />
Figura <strong>26.</strong>4-1 Total <strong>de</strong> Ingresos Disponibles<br />
Esto resulta, incluso en el caso menor, en un monto suficiente <strong>de</strong>l presupuesto total<br />
excediendo el costo total <strong>de</strong>l proyecto y alcanzando 1.3 veces el costo máximo <strong>de</strong>l<br />
proyecto <strong>de</strong> $ 5,443. Por lo tanto, es posible rechazar el impuesto adicional al combustible<br />
que parece ser muy difícil <strong>de</strong> ejecutar y reducir la tasa <strong>de</strong> algunos <strong>de</strong> <strong>los</strong> tributos<br />
propuestos anteriormente.<br />
(2) Evaluación por Etapa<br />
También se realizaron análisis más <strong>de</strong>tallados.<br />
1) Estimación <strong>de</strong> Ingresos Disponible por Año/Etapa<br />
Con respecto a las ten<strong>de</strong>ncias <strong>de</strong> <strong>los</strong> ingresos financieros, el cronograma <strong>de</strong><br />
implementación <strong>de</strong> <strong>los</strong> <strong>proyectos</strong> propuestos, tales como <strong>los</strong> <strong>proyectos</strong> <strong>de</strong> <strong>de</strong>sarrollo <strong>de</strong>l<br />
tren urbano, bus troncal y vía expresa, se consi<strong>de</strong>ra en la estimación anual, , durante el<br />
periodo entre 2005 y 2010. El método interpolador con tasas anuales <strong>de</strong> crecimiento<br />
promedio también se aplica en la estimación <strong>de</strong>spués <strong>de</strong> 2010.<br />
26-16