INFORME FINAL DEL PRECESAM - El Colegio de México
INFORME FINAL DEL PRECESAM - El Colegio de México
INFORME FINAL DEL PRECESAM - El Colegio de México

You also want an ePaper? Increase the reach of your titles
YUMPU automatically turns print PDFs into web optimized ePapers that Google loves.
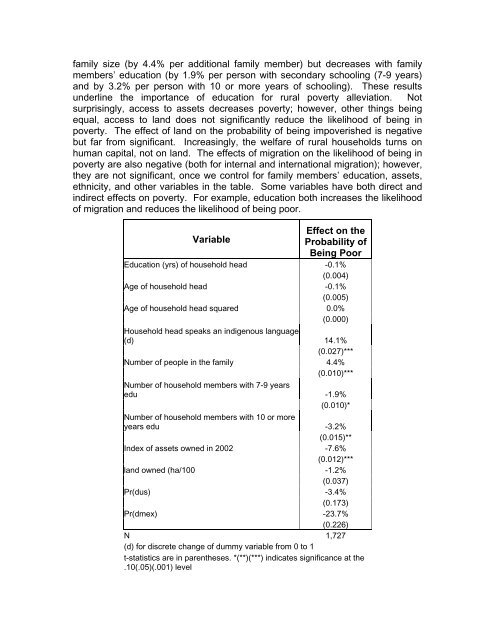
family size (by 4.4% per additional family member) but <strong>de</strong>creases with family<br />
members’ education (by 1.9% per person with secondary schooling (7-9 years)<br />
and by 3.2% per person with 10 or more years of schooling). These results<br />
un<strong>de</strong>rline the importance of education for rural poverty alleviation. Not<br />
surprisingly, access to assets <strong>de</strong>creases poverty; however, other things being<br />
equal, access to land does not significantly reduce the likelihood of being in<br />
poverty. The effect of land on the probability of being impoverished is negative<br />
but far from significant. Increasingly, the welfare of rural households turns on<br />
human capital, not on land. The effects of migration on the likelihood of being in<br />
poverty are also negative (both for internal and international migration); however,<br />
they are not significant, once we control for family members’ education, assets,<br />
ethnicity, and other variables in the table. Some variables have both direct and<br />
indirect effects on poverty. For example, education both increases the likelihood<br />
of migration and reduces the likelihood of being poor.<br />
Effect on the<br />
Variable<br />
Probability of<br />
Being Poor<br />
Education (yrs) of household head -0.1%<br />
(0.004)<br />
Age of household head -0.1%<br />
(0.005)<br />
Age of household head squared 0.0%<br />
(0.000)<br />
Household head speaks an indigenous language<br />
(d) 14.1%<br />
(0.027)***<br />
Number of people in the family 4.4%<br />
(0.010)***<br />
Number of household members with 7-9 years<br />
edu -1.9%<br />
(0.010)*<br />
Number of household members with 10 or more<br />
years edu -3.2%<br />
(0.015)**<br />
In<strong>de</strong>x of assets owned in 2002 -7.6%<br />
(0.012)***<br />
land owned (ha/100 -1.2%<br />
(0.037)<br />
Pr(dus) -3.4%<br />
(0.173)<br />
Pr(dmex) -23.7%<br />
(0.226)<br />
N 1,727<br />
(d) for discrete change of dummy variable from 0 to 1<br />
t-statistics are in parentheses. *(**)(***) indicates significance at the<br />
.10(.05)(.001) level