Indicadores <strong>de</strong> Hierro y Acero, Acad. Manu<strong>el</strong> Torres Parra y Econ. María RojasAnexo 9VENTAS DE MINERAL DE HIERRO (Exterior y <strong>Nacional</strong>es: Miles <strong>de</strong> Tons. Métricas y Valor en Millones <strong>de</strong> Bs. y $)Precios ReferencialesOtrosExportación Mineral <strong>de</strong> Hierro Fob Spot % Exportado/Total Ventas Internas Mineral <strong>de</strong> Hierro Servicio TOTAL VENTASVz<strong>la</strong> ChinasTM Mill.Bs. Mill.$ $/TM 58% 62% TM Fe Vtas. TM Mill.Bs. Mill.$ $/TM Mill.Bs. TM Mill.Bs.Fe FeFe700 700 -19511952 1.700 56 16,6 9,8 1.700 561953 1.982 58 17,4 8,8 99,9% 2 1.984 581954 5.505 120 35,9 6,5 6,64 100,0% 1 5.506 1201955 7.833 165 49,3 6,3 6,63 100,0% 1 7.834 1651956 10.919 258 77,1 7,1 7,34 100,0% 4 10.923 2581957 15.626 394 117,6 7,5 8,05 99,9% 8 15.635 3941958 15.615 398 118,8 7,6 7,92 99,9% 8 15.623 3981959 17.024 431 128,7 7,6 7,91 100,0% 4 17.028 4311960 19.280 526 157,1 8,1 8,93 100,0% 3 19.283 5261961 14.586 417 124,5 8,5 8,93 99,6% 55 14.641 4171962 13.314 375 111,9 8,4 8,93 96,3% 511 13.825 3751963 12.370 308 91,9 7,4 7,79 96,6% 439 12.809 3081964 14.893 470 109,2 7,3 7,93 96,3% 574 15.468 4701965 17.006 450 104,7 6,2 8,13 96,4% 629 17.635 4501966 17.037 542 126,0 7,4 8,13 96,6% 603 17.640 5421967 16.456 519 120,6 7,3 8,13 94,5% 960 17.416 5191968 15.005 452 105,2 7,0 8,13 96,5% 541 15.546 4521969 18.992 572 133,1 7,0 8,13 96,8% 628 19.620 5721970 21.094 8,50 96,7% 714 21.807 -1971 18.900 7,51 99,0% 197 19.097 -1972 16.509 7,94 100,0% 8 16.517 -1973 21.660 7,85 99,4% 127 21.787 -1974 26.277 1.146 266,4 10,1 10,39 99,1% 94,5% 237 28 6,5 27,39 39 26.514 1.2131975 19.405 1.091 253,7 13,1 13,86 98,8% 91,8% 230 24 5,5 24,1 74 19.635 1.1891976 15.672 1.085 252,3 16,1 14,76 98,2% 90,5% 282 25 5,8 20,6 89 15.954 1.1981977 11.936 712 165,5 13,9 13,91 97,9% 86,3% 250 40 9,3 37,2 73 12.186 8251978 12.828 588 136,6 10,7 10,68 96,1% 82,3% 514 25 5,8 11,3 102 13.343 7141979 12.976 593 138,0 10,6 10,71 94,8% 80,0% 716 34 8,0 11,1 114 13.692 7421980 11.752 635 147,6 12,6 12,59 79,9% 66,8% 2.952 203 47,2 16,0 112 14.705 9491981 12.422 722 167,9 13,5 13,60 12,15 80,8% 68,7% 2.954 195 45,4 15,4 134 15.376 1.0521982 6.616 364 84,6 12,8 12,55 14,05 62,6% 51,6% 3.957 248 57,7 14,6 93 10.573 7041983 7.535 382 45,8 6,1 12,62 12,54 68,0% 56,7% 3.542 235 28,2 8,0 56 11.077 6741984 7.886 531 40,5 5,1 10,83 11,31 63,5% 58,5% 4.528 326 24,9 5,5 51 12.414 9081985 9.036 720 50,6 5,6 11,49 65,6% 61,7% 4.738 345 24,2 5,1 103 13.774 1.1681986 10.026 925 48,2 4,8 11,36 64,8% 64,9% 5.453 415 21,6 4,0 86 15.479 1.4261987 11.700 1.634 60,9 5,2 10,94 68,0% 72,4% 5.498 490 18,3 3,3 134 17.198 2.2571988 12.289 1.946 56,1 4,6 12,03 70,8% 72,2% 5.080 490 14,1 2,8 261 17.369 2.6971989 1<strong>4.4</strong>36 6.479 161,0 11,2 14,05 75,9% 85,5% 4.595 673 16,7 3,6 425 19.031 7.5771990 13.619 9.618 204,1 15,0 14,05 70,3% 71,7% 5.747 2.140 45,4 7,9 1.649 19.366 13.4081991 13.385 12.606 219,1 16,4 15,03 66,5% 64,4% 6.735 4.550 79,1 11,7 2.404 20.120 19.5601992 10.003 11.130 157,0 15,7 14,31 61,1% 57,7% 6.369 5.813 82,0 12,9 2.337 16.371 19.2791993 10.646 13.397 142,8 13,4 12,58 64,1% 57,8% 5.960 7.187 76,6 12,9 2.592 16.606 23.1761994 10.711 19.363 125,3 11,7 11,45 61,9% 52,0% 6.593 13.972 90,4 13,7 3.887 17.305 37.2221995 10.611 27.966 101,7 9,6 12,27 60,2% 53,8% 7.013 19.096 69,4 9,9 4.923 17.624 51.9861996 9.529 66.115 172,6 18,1 12,97 52,8% 45,7% 8.502 65.571 171,2 20,1 13.141 18.031 144.8261997 9.321 71.174 145,1 15,6 13,09 53,2% 42,3% 8.199 80.715 164,6 20,1 16.192 17.520 168.0811998 8.603 77.746 144,5 16,8 13,41 52,5% 41,6% 7.799 85.456 158,8 20,4 23.495 16.402 186.6971999 6.614 53.068 86,9 13,1 11,93 47,1% 33,1% 7.416 91.000 149,1 20,1 16.238 14.030 160.3062000 6.884 59.603 88,0 12,8 12,45 40,2% 27,0% 10.242 137.413 202,8 19,8 23.833 17.126 220.8482001 6.857 68.000 92,8 13,5 12,99 43,2% 27,6% 9.015 132.457 180,8 20,1 46.161 15.872 246.6182002 6.884 12,68 40,2% 10.242 - 17.1262003 6.873 13,82 40,8% 9.992 16.8652004 8.736 16,39 43,6% 11.317 20.0532005 7.657 28,11 30,6% 17.389 25.0462006 5.594 33,45 25,3% 16.506 22.1002007 5.889 36,63 28,5% 14.761 20.6502008 5.471 60,80 25,4% 16.029 21.5002009 3.465 77,99 23,3% 11.435 14.9002010 146,72Fte: Anuarios Estadísticos, OCEI, 1987, 1990; INE, 2002.Fte: Hierro y otros datos estadísticos, Min. Energía y Minas, 1968, 1984, 1991,1995.Fte: Conapri, 2007. Volumen 2001-2005.Fte: Ste<strong>el</strong> Statistical Yearbook, SSY-2011. Volumen 2006-2009 y estimación <strong>de</strong> ventas internas.Fte:FMI. Cotización Spot China Iron Ore 1981-2011 $/TM118
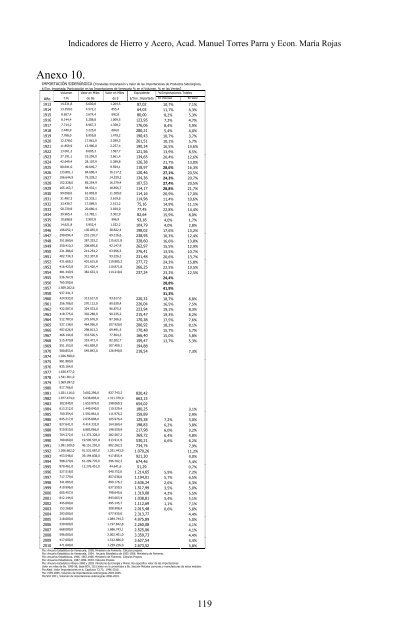
Indicadores <strong>de</strong> Hierro y Acero, Acad. Manu<strong>el</strong> Torres Parra y Econ. María RojasAnexo 10.IMPORTACIÓN SIDERÚRGICA (Tone<strong>la</strong>das Importación y Valor <strong>de</strong> <strong>la</strong>s Importaciones <strong>de</strong> Productos Si<strong>de</strong>rúrgicos,$/Ton. importada, Participación en <strong>la</strong>s Importaciones <strong>de</strong> Venezue<strong>la</strong> % en <strong>el</strong> Volumen, % en <strong>la</strong>s Ventas)Volumen Valor en Miles Valor en Miles Equivalente %/Importaciones TotalesAño T.M. <strong>de</strong> Bs. <strong>de</strong> $ $/Ton. Importada En Volumen En Valor1913 14.531,8 6.600,8 1.264,5 87,02 10,7% 7,1%1914 13.359,0 4.572,2 855,4 64,03 11,7% 6,3%1915 8.657,4 3.674,4 692,6 80,00 8,2% 5,3%1916 8.144,4 5.208,8 1.009,5 123,95 7,2% 4,7%1917 7.714,2 6.967,3 1.358,2 176,06 8,4% 5,9%1918 2.440,9 3.225,0 684,0 280,21 5,4% 4,0%1919 7.768,0 6.959,8 1.479,2 190,43 10,7% 3,7%1920 12.578,0 17.861,0 3.289,3 261,51 10,1% 5,7%1921 11.859,9 12.980,0 2.257,4 190,34 16,5% 13,6%1922 13.061,3 8.605,3 1.587,7 121,56 13,9% 8,5%1923 27.191,1 19.259,0 3.661,4 134,65 20,4% 12,6%1924 42.649,4 28.107,9 5.389,8 126,38 21,7% 13,0%1925 80.641,0 49.649,7 9.594,1 118,97 28,6% 16,3%1926 133.801,1 84.696,4 16.117,3 120,46 27,1% 20,5%1927 106.644,9 75.228,2 14.329,2 134,36 24,3% 20,7%1928 152.328,0 85.254,9 16.379,4 107,53 27,4% 20,5%1929 165.163,7 98.432,1 18.856,7 114,17 28,8% 21,7%1930 99.058,6 61.803,8 11.309,0 114,16 20,9% 17,0%1931 31.487,3 22.333,1 3.619,6 114,96 11,4% 10,6%1932 33.439,7 17.089,5 2.513,2 75,16 14,9% 11,1%1933 50.729,8 20.686,4 3.929,0 77,45 22,8% 14,4%1934 39.965,4 12.782,1 3.302,9 82,64 15,9% 8,0%1935 10.698,8 3.907,8 996,9 93,18 4,0% 1,7%1936 14.621,8 5.952,4 1.532,2 104,79 4,0% 2,8%1946 196.052,1 130.055,0 38.822,4 198,02 17,6% 13,2%1947 290.094,4 232.210,7 69.316,6 238,95 16,3% 12,4%1948 351.860,6 387.333,2 115.621,8 328,60 16,6% 13,8%1949 350.410,2 308.695,6 92.147,9 262,97 15,5% 12,9%1950 231.386,6 214.254,2 63.956,5 276,41 13,5% 10,7%1951 402.734,3 312.307,8 93.226,2 231,48 20,6% 13,7%1952 431.669,2 401.615,8 119.885,3 277,72 24,3% 15,8%1953 416.423,8 371.420,4 110.871,8 266,25 22,5% 13,5%1954 481.440,9 382.632,4 114.218,6 237,24 23,2% 12,5%1955 536.767,8 24,4%1956 765.500,6 28,8%1957 1.569.262,6 41,9%1958 937.341,3 31,3%1960 424.933,0 313.617,0 93.617,0 220,31 18,7% 8,8%1961 356.706,0 270.112,0 80.630,4 226,04 16,5% 7,5%1962 432.587,0 324.533,0 96.875,5 223,94 19,1% 8,3%1963 418.775,0 302.288,0 90.235,2 215,47 19,3% 8,2%1964 512.787,0 375.676,0 87.366,5 170,38 17,5% 7,6%1965 537.138,0 464.056,0 107.920,0 200,92 18,2% 8,1%1966 407.626,9 298.813,3 69.491,5 170,48 15,7% 5,7%1967 466.144,8 333.526,5 77.564,3 166,40 15,0% 5,8%1968 515.470,8 353.471,4 82.202,7 159,47 13,7% 5,3%1969 551.153,0 461.859,0 107.409,1 194,881970 580.853,0 545.842,0 126.940,0 218,54 7,3%1974 1.026.590,01975 981.880,01976 835.164,01977 1.636.477,01978 1.541.401,01979 1.069.997,01980 917.766,01981 1.021.116,0 3.602.296,0 837.743,3 820,421982 1.977.474,0 5.638.895,0 1.311.370,9 663,151983 302.849,0 1.653.879,0 198.069,3 654,021984 613.212,0 1.449.040,0 110.529,4 180,25 3,1%1985 700.354,0 1.592.861,0 111.976,2 159,89 2,9%1986 845.217,0 2.035.806,0 105.976,4 125,38 7,2% 3,0%1987 827.641,0 <strong>4.4</strong>14.332,0 164.560,4 198,83 6,2% 3,8%1988 910.919,0 6.885.066,0 198.559,9 217,98 6,0% 3,2%1989 764.272,0 11.373.328,0 282.567,2 369,72 6,4% 4,8%1990 780.660,0 19.505.597,0 413.911,9 530,21 6,6% 6,2%1991 1.091.929,0 46.151.292,0 802.282,3 734,74 7,9%1992 1.206.662,0 91.531.087,0 1.291.443,9 1.070,26 11,2%1993 453.548,0 39.194.838,0 417.855,4 921,30 4,0%1994 588.270,0 61.299.770,0 396.762,3 674,46 5,4%1995 870.461,0 12.276.451,0 44.641,6 51,29 0,7%1996 527.518,0 640.752,0 1.214,65 5,9% 7,2%1997 717.779,0 857.036,0 1.194,01 5,7% 6,5%1998 341.083,0 899.176,1 2.636,24 2,6% 6,3%1999 419.996,0 637.550,5 1.517,99 3,5% 5,0%2000 605.457,0 798.645,6 1.319,08 4,2% 5,5%2001 812.144,0 843.663,4 1.038,81 5,4% 5,1%2002 445.000,0 495.145,7 1.112,69 1,1% 7,1%2003 153.268,0 308.908,4 2.015,48 0,6% 5,8%2004 293.000,0 677.935,0 2.313,77 4,4%2005 218.000,0 1.084.744,3 4.975,89 5,0%2006 530.000,0 1.197.842,8 2.260,08 4,1%2007 668.000,0 1.686.743,1 2.525,06 4,1%2008 596.000,0 2.002.401,0 3.359,73 4,4%2009 417.000,0 1.512.686,0 3.627,54 4,4%2010 471.000,0 1.259.226,0 2.673,52 3,8%Fte: Anuario Estadístico <strong>de</strong> Venezue<strong>la</strong>, 1938, Ministerio <strong>de</strong> Fomento. Cálculos propios.Fte: Anuario Estadístico <strong>de</strong> Venezue<strong>la</strong>, 1954. Anuario Estadístico <strong>de</strong> 1955-1956. Ministerio <strong>de</strong> Fomento.Fte: Anuarios Estadísticos, 1966, 1967,1968. Ministerio <strong>de</strong> Fomento. Cálculos PropiosFte: Anuarios Estadísticos, 1987,1990. OCEI. Cálculos PropiosFte: Anuario Estadistico Minero 2000 y 2003 Ministerio <strong>de</strong> Energía y Minas. No especifica valor <strong>de</strong> <strong>la</strong>s importacionesValor en miles <strong>de</strong> Bs. 1995-96, base BCV, III.5:Valor en $ convertidos a Bs. Sección Metales comunes y manufacturas <strong>de</strong> estos metales.Fte:A<strong>la</strong>di. Valor Importaciones en $, Capítulos 72,73, 1996-2010.Fte: IVES 2005, Volumen <strong>de</strong> importaciones si<strong>de</strong>rúrgicas 2004-2005.Fte:SSY 2011, Volúmen <strong>de</strong> importaciones si<strong>de</strong>rúrgicas 2006-2010.119
- Page 1 and 2:
BOLETÍN 24
- Page 3 and 4:
LA PORTADAEl interés principal de
- Page 5 and 6:
LA ACADEMIA NACIONAL DE LA INGENIER
- Page 7 and 8:
Sesión Solemne de incorporación a
- Page 9 and 10:
MIEMBROS HONORARIOS
- Page 11 and 12:
Discurso de Presentación del Acad.
- Page 13 and 14:
Discurso de Presentación del Acad.
- Page 15 and 16:
Discurso de Presentación del Acad.
- Page 17 and 18:
Discurso de incorporación del Ing.
- Page 19 and 20:
Discurso de incorporación del Ing.
- Page 21 and 22:
Sesión Solemne de incorporación a
- Page 23 and 24:
Discurso de Presentación del Acad.
- Page 25 and 26:
Discurso de incorporación del Ing.
- Page 27 and 28:
Discurso de incorporación del Ing.
- Page 29 and 30:
Discurso de incorporación del Ing.
- Page 31 and 32:
Discurso de incorporación del Ing.
- Page 33 and 34:
Sesión Solemne de incorporación a
- Page 35 and 36:
Discurso de incorporación del Ing.
- Page 37 and 38:
Discurso de incorporación del Ing.
- Page 39 and 40:
Palabras de clausura por el Preside
- Page 41 and 42:
Sesión Solemne de incorporación a
- Page 43 and 44:
Discurso de Presentación del Acad.
- Page 45 and 46:
Discurso de Presentación del Acad.
- Page 47 and 48:
Discurso de Presentación del Acad.
- Page 49 and 50:
Discurso de incorporación del Ing.
- Page 51 and 52:
Discurso de incorporación del Ing.
- Page 53 and 54:
Discurso de incorporación del Ing.
- Page 55 and 56:
Discurso de incorporación del Ing.
- Page 57 and 58:
Palabras de clausura por el Preside
- Page 59 and 60:
Indicadores de Hierro y Acero, Acad
- Page 61 and 62:
M illon e s d e TMIndicadores de Hi
- Page 63 and 64:
Indicadores de Hierro y Acero, Acad
- Page 65 and 66:
Indicadores de Hierro y Acero, Acad
- Page 67 and 68: 19731974197519761977197819811982198
- Page 69 and 70: Indicadores de Hierro y Acero, Acad
- Page 71 and 72: Indicadores de Hierro y Acero, Acad
- Page 73 and 74: Indicadores de Hierro y Acero, Acad
- Page 75 and 76: Indicadores de Hierro y Acero, Acad
- Page 77 and 78: M i le s d e T M AIndicadores de Hi
- Page 79 and 80: $ / TMIndicadores de Hierro y Acero
- Page 81 and 82: TMIndicadores de Hierro y Acero, Ac
- Page 83 and 84: T.M.$/Ton. importación siderúrgic
- Page 85 and 86: Indicadores de Hierro y Acero, Acad
- Page 87 and 88: K g s/Ha bita nteIndicadores de Hie
- Page 89 and 90: Indicadores de Hierro y Acero, Acad
- Page 91 and 92: Indicadores de Hierro y Acero, Acad
- Page 93 and 94: Indicadores de Hierro y Acero, Acad
- Page 95 and 96: Indicadores de Hierro y Acero, Acad
- Page 97 and 98: Indicadores de Hierro y Acero, Acad
- Page 99 and 100: Indicadores de Hierro y Acero, Acad
- Page 101 and 102: Indicadores de Hierro y Acero, Acad
- Page 103 and 104: Indicadores de Hierro y Acero, Acad
- Page 105 and 106: Indicadores de Hierro y Acero, Acad
- Page 107 and 108: Indicadores de Hierro y Acero, Acad
- Page 109 and 110: Indicadores de Hierro y Acero, Acad
- Page 111 and 112: Indicadores de Hierro y Acero, Acad
- Page 113 and 114: Indicadores de Hierro y Acero, Acad
- Page 115 and 116: Indicadores de Hierro y Acero, Acad
- Page 117: Indicadores de Hierro y Acero, Acad
- Page 121 and 122: Indicadores de Hierro y Acero, Acad
- Page 123 and 124: Indicadores de Hierro y Acero, Acad
- Page 125 and 126: Indicadores de Hierro y Acero, Acad
- Page 127 and 128: Indicadores de Hierro y Acero, Acad
- Page 129 and 130: Indicadores Relacionados con la Ing
- Page 131 and 132: Indicadores Relacionados con la Ing
- Page 133 and 134: Indicadores Relacionados con la Ing
- Page 135 and 136: Indicadores Relacionados con la Ing
- Page 137 and 138: Indicadores Relacionados con la Ing
- Page 139 and 140: Indicadores Relacionados con la Ing
- Page 141 and 142: 0,2510,7548,6975,46232,39247,10227,
- Page 143 and 144: Indicadores Relacionados con la Ing
- Page 145 and 146: 0,070,090,110,150,190,280,30,410,56
- Page 147 and 148: Indicadores Relacionados con la Ing
- Page 149 and 150: 0,370,390,490,470,580,610,440,430,3
- Page 151 and 152: Indicadores Relacionados con la Ing
- Page 153 and 154: Indicadores Relacionados con la Ing
- Page 155 and 156: Indicadores Relacionados con la Ing
- Page 157 and 158: Indicadores Relacionados con la Ing
- Page 159 and 160: Indicadores Relacionados con la Ing
- Page 161 and 162: Indicadores Relacionados con la Ing
- Page 163 and 164: Indicadores Relacionados con la Ing
- Page 165 and 166: Indicadores Relacionados con la Ing
- Page 167 and 168: Indicadores Relacionados con la Ing
- Page 169 and 170:
Indicadores Relacionados con la Ing
- Page 171 and 172:
Indicadores Relacionados con la Ing
- Page 173 and 174:
Este año se cumple en Venezuela el
- Page 175 and 176:
Primer Centenario de la Prospecció
- Page 177 and 178:
Primer Centenario de la Prospecció
- Page 179 and 180:
Primer Centenario de la Prospecció
- Page 181 and 182:
Primer Centenario de la Prospecció
- Page 183 and 184:
Primer Centenario de la Prospecció
- Page 185 and 186:
Primer Centenario de la Prospecció
- Page 187 and 188:
Primer Centenario de la Prospecció
- Page 189 and 190:
Primer Centenario de la Prospecció
- Page 191 and 192:
Primer Centenario de la Prospecció
- Page 193 and 194:
Primer Centenario de la Prospecció
- Page 195:
Normas para la aceptación de artí