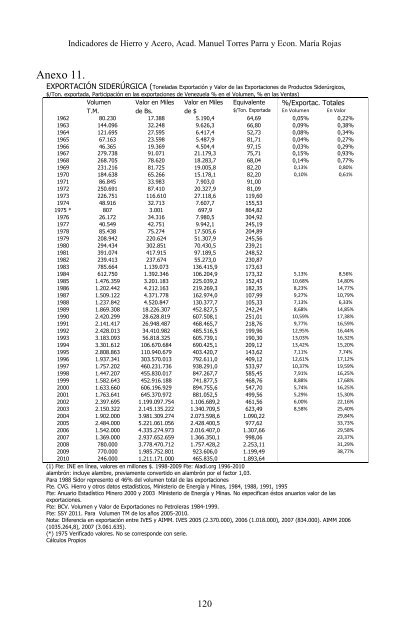
Indicadores <strong>de</strong> Hierro y Acero, Acad. Manu<strong>el</strong> Torres Parra y Econ. María RojasAnexo 11.EXPORTACIÓN SIDERÚRGICA (Tone<strong>la</strong>das Exportación y Valor <strong>de</strong> <strong>la</strong>s Exportaciones <strong>de</strong> Productos Si<strong>de</strong>rúrgicos,$/Ton. exportada, Participación en <strong>la</strong>s exportaciones <strong>de</strong> Venezue<strong>la</strong> % en <strong>el</strong> Volumen, % en <strong>la</strong>s Ventas)Volumen Valor en Miles Valor en Miles Equivalente %/Exportac. TotalesT.M. <strong>de</strong> Bs. <strong>de</strong> $ $/Ton. Exportada En Volumen En Valor1962 80.230 17.388 5.190,4 64,69 0,05% 0,22%1963 144.096 32.248 9.626,3 66,80 0,09% 0,38%1964 121.695 27.595 6.417,4 52,73 0,08% 0,34%1965 67.163 23.598 5.487,9 81,71 0,04% 0,27%1966 46.365 19.369 4.504,4 97,15 0,03% 0,29%1967 279.738 91.071 21.179,3 75,71 0,15% 0,93%1968 268.705 78.620 18.283,7 68,04 0,14% 0,77%1969 231.216 81.725 19.005,8 82,20 0,13% 0,80%1970 184.638 65.266 15.178,1 82,20 0,10% 0,61%1971 86.845 33.983 7.903,0 91,001972 250.691 87.410 20.327,9 81,091973 226.751 116.610 27.118,6 119,601974 48.916 32.713 7.607,7 155,531975 * 807 3.001 697,9 864,821976 26.172 34.316 7.980,5 304,921977 40.549 42.751 9.942,1 245,191978 85.438 75.274 17.505,6 204,891979 208.942 220.624 51.307,9 245,561980 29<strong>4.4</strong>34 302.851 70.430,5 239,211981 391.074 417.915 97.189,5 248,521982 239.413 237.674 55.273,0 230,871983 785.664 1.139.073 136.415,9 173,631984 612.750 1.392.346 106.204,9 173,32 5,13% 8,56%1985 1.476.359 3.201.183 225.039,2 152,43 10,68% 14,80%1986 1.202.442 4.212.163 219.269,3 182,35 8,23% 14,77%1987 1.509.122 4.371.778 162.974,0 107,99 9,27% 10,79%1988 1.237.842 4.520.847 130.377,7 105,33 7,13% 6,33%1989 1.869.308 18.226.307 452.827,5 242,24 8,68% 14,85%1990 2.420.299 28.628.819 607.508,1 251,01 10,59% 17,38%1991 2.141.417 26.948.487 468.465,7 218,76 9,77% 16,59%1992 2.428.013 3<strong>4.4</strong>10.982 485.516,5 199,96 12,95% 16,44%1993 3.183.093 56.818.325 605.739,1 190,30 13,03% 16,32%1994 3.301.612 106.670.684 690.425,1 209,12 13,42% 15,20%1995 2.808.863 110.940.679 403.420,7 143,62 7,11% 7,74%1996 1.937.341 303.570.013 792.611,0 409,12 12,61% 17,12%1997 1.757.202 460.231.736 938.291,0 533,97 10,37% 19,59%1998 1.447.207 455.830.017 847.267,7 585,45 7,91% 16,25%1999 1.582.643 452.916.188 741.877,5 468,76 8,88% 17,68%2000 1.633.660 606.196.929 894.755,6 547,70 5,74% 16,25%2001 1.763.641 645.370.972 881.052,5 499,56 5,29% 15,30%2002 2.397.695 1.199.097.754 1.106.689,2 461,56 6,00% 22,16%2003 2.150.322 2.145.135.222 1.340.709,5 623,49 8,58% 25,40%2004 1.902.000 3.981.309.274 2.073.598,6 1.090,22 29,84%2005 2.484.000 5.221.061.056 2.428.400,5 977,62 33,73%2006 1.542.000 4.335.274.973 2.016.407,0 1.307,66 29,58%2007 1.369.000 2.937.652.659 1.366.350,1 998,06 23,37%2008 780.000 3.778.470.712 1.757.428,2 2.253,11 31,29%2009 770.000 1.985.752.801 923.606,0 1.199,49 38,77%2010 246.000 1.211.171.000 465.835,0 1.893,64(1) Fte: INE en línea, valores en millones $. 1998-2009 Fte: A<strong>la</strong>di.org 1996-2010a<strong>la</strong>mbrón: incluye a<strong>la</strong>mbre, previamente convertido en a<strong>la</strong>mbrón por <strong>el</strong> factor 1,03.Para 1988 Sidor represento <strong>el</strong> 46% <strong>de</strong>l volumen total <strong>de</strong> <strong>la</strong>s exportacionesFte. CVG. Hierro y otros datos estadísticos, Ministerio <strong>de</strong> Energía y Minas, 1984, 1988, 1991, 1995Fte: Anuario Estadístico Minero 2000 y 2003 Ministerio <strong>de</strong> Energía y Minas. No especifican éstos anuarios valor <strong>de</strong> <strong>la</strong>sexportaciones.Fte: BCV. Volumen y Valor <strong>de</strong> Exportaciones no Petroleras 1984-1999.Fte: SSY 2011. Para Volumen TM <strong>de</strong> los años 2005-2010.Nota: Diferencia en exportación entre IVES y AIMM. IVES 2005 (2.370.000), 2006 (1.018.000), 2007 (834.000). AIMM 2006(1035.264,8), 2007 (3.061.635).(*) 1975 Verificado valores. No se correspon<strong>de</strong> con serie.Cálculos Propios120
Indicadores <strong>de</strong> Hierro y Acero, Acad. Manu<strong>el</strong> Torres Parra y Econ. María RojasAnexo 12.REFERENCIALES DE COTIZACIÓN DE ACERO $USA/TON. 1981-2011en Pto. Laminado Laminado A<strong>la</strong>mbrón BarrasJapón enenAceroAño Caliente Frío <strong>de</strong> Acero Corrugado1981 324 386 376 3041982 282 368 353 2431983 270 360 313 2231984 284 377 309 2331985 246 318 273 2251986 270 325 240 2201987 323 385 246 2031988 395,8 501,3 313,8 262,51989 441,9 550,4 350,8 341,71990 411,3 511,3 362,9 364,21991 408,3 504,2 383,3 367,11992 369,2 469,2 372,5 306,71993 375,8 470,0 395,8 348,81994 402,9 511,7 371,7 322,51995 440,8 554,2 420,8 381,71996 365,6 483,9 438,5 360,21997 337,3 448,2 382,7 325,21998 279,2 370,8 332,1 257,51999 243,3 340,4 290,0 234,22000 295,8 385,8 291,7 244,22001 216,5 299,1 302,3 221,52002 246,7 328,3 300,0 204,22003 320,2 444,6 300,0 265,82004 502,5 607,1 487,5 428,82005 633,3 733,3 579,2 423,12006 600,0 693,8 581,3 443,82007 550,0 650,0 533,3 521,52008 883,3 965,6 1.009,8 760,22009 683,3 783,3 969,4 486,02010 715,6 815,6 712,2 562,5ag.2011 787,5 887,5 747,3 625,0Fte: World Bank. Cálculos Propioswww.in<strong>de</strong>xmundi.com121
- Page 1 and 2:
BOLETÍN 24
- Page 3 and 4:
LA PORTADAEl interés principal de
- Page 5 and 6:
LA ACADEMIA NACIONAL DE LA INGENIER
- Page 7 and 8:
Sesión Solemne de incorporación a
- Page 9 and 10:
MIEMBROS HONORARIOS
- Page 11 and 12:
Discurso de Presentación del Acad.
- Page 13 and 14:
Discurso de Presentación del Acad.
- Page 15 and 16:
Discurso de Presentación del Acad.
- Page 17 and 18:
Discurso de incorporación del Ing.
- Page 19 and 20:
Discurso de incorporación del Ing.
- Page 21 and 22:
Sesión Solemne de incorporación a
- Page 23 and 24:
Discurso de Presentación del Acad.
- Page 25 and 26:
Discurso de incorporación del Ing.
- Page 27 and 28:
Discurso de incorporación del Ing.
- Page 29 and 30:
Discurso de incorporación del Ing.
- Page 31 and 32:
Discurso de incorporación del Ing.
- Page 33 and 34:
Sesión Solemne de incorporación a
- Page 35 and 36:
Discurso de incorporación del Ing.
- Page 37 and 38:
Discurso de incorporación del Ing.
- Page 39 and 40:
Palabras de clausura por el Preside
- Page 41 and 42:
Sesión Solemne de incorporación a
- Page 43 and 44:
Discurso de Presentación del Acad.
- Page 45 and 46:
Discurso de Presentación del Acad.
- Page 47 and 48:
Discurso de Presentación del Acad.
- Page 49 and 50:
Discurso de incorporación del Ing.
- Page 51 and 52:
Discurso de incorporación del Ing.
- Page 53 and 54:
Discurso de incorporación del Ing.
- Page 55 and 56:
Discurso de incorporación del Ing.
- Page 57 and 58:
Palabras de clausura por el Preside
- Page 59 and 60:
Indicadores de Hierro y Acero, Acad
- Page 61 and 62:
M illon e s d e TMIndicadores de Hi
- Page 63 and 64:
Indicadores de Hierro y Acero, Acad
- Page 65 and 66:
Indicadores de Hierro y Acero, Acad
- Page 67 and 68:
19731974197519761977197819811982198
- Page 69 and 70: Indicadores de Hierro y Acero, Acad
- Page 71 and 72: Indicadores de Hierro y Acero, Acad
- Page 73 and 74: Indicadores de Hierro y Acero, Acad
- Page 75 and 76: Indicadores de Hierro y Acero, Acad
- Page 77 and 78: M i le s d e T M AIndicadores de Hi
- Page 79 and 80: $ / TMIndicadores de Hierro y Acero
- Page 81 and 82: TMIndicadores de Hierro y Acero, Ac
- Page 83 and 84: T.M.$/Ton. importación siderúrgic
- Page 85 and 86: Indicadores de Hierro y Acero, Acad
- Page 87 and 88: K g s/Ha bita nteIndicadores de Hie
- Page 89 and 90: Indicadores de Hierro y Acero, Acad
- Page 91 and 92: Indicadores de Hierro y Acero, Acad
- Page 93 and 94: Indicadores de Hierro y Acero, Acad
- Page 95 and 96: Indicadores de Hierro y Acero, Acad
- Page 97 and 98: Indicadores de Hierro y Acero, Acad
- Page 99 and 100: Indicadores de Hierro y Acero, Acad
- Page 101 and 102: Indicadores de Hierro y Acero, Acad
- Page 103 and 104: Indicadores de Hierro y Acero, Acad
- Page 105 and 106: Indicadores de Hierro y Acero, Acad
- Page 107 and 108: Indicadores de Hierro y Acero, Acad
- Page 109 and 110: Indicadores de Hierro y Acero, Acad
- Page 111 and 112: Indicadores de Hierro y Acero, Acad
- Page 113 and 114: Indicadores de Hierro y Acero, Acad
- Page 115 and 116: Indicadores de Hierro y Acero, Acad
- Page 117 and 118: Indicadores de Hierro y Acero, Acad
- Page 119: Indicadores de Hierro y Acero, Acad
- Page 123 and 124: Indicadores de Hierro y Acero, Acad
- Page 125 and 126: Indicadores de Hierro y Acero, Acad
- Page 127 and 128: Indicadores de Hierro y Acero, Acad
- Page 129 and 130: Indicadores Relacionados con la Ing
- Page 131 and 132: Indicadores Relacionados con la Ing
- Page 133 and 134: Indicadores Relacionados con la Ing
- Page 135 and 136: Indicadores Relacionados con la Ing
- Page 137 and 138: Indicadores Relacionados con la Ing
- Page 139 and 140: Indicadores Relacionados con la Ing
- Page 141 and 142: 0,2510,7548,6975,46232,39247,10227,
- Page 143 and 144: Indicadores Relacionados con la Ing
- Page 145 and 146: 0,070,090,110,150,190,280,30,410,56
- Page 147 and 148: Indicadores Relacionados con la Ing
- Page 149 and 150: 0,370,390,490,470,580,610,440,430,3
- Page 151 and 152: Indicadores Relacionados con la Ing
- Page 153 and 154: Indicadores Relacionados con la Ing
- Page 155 and 156: Indicadores Relacionados con la Ing
- Page 157 and 158: Indicadores Relacionados con la Ing
- Page 159 and 160: Indicadores Relacionados con la Ing
- Page 161 and 162: Indicadores Relacionados con la Ing
- Page 163 and 164: Indicadores Relacionados con la Ing
- Page 165 and 166: Indicadores Relacionados con la Ing
- Page 167 and 168: Indicadores Relacionados con la Ing
- Page 169 and 170: Indicadores Relacionados con la Ing
- Page 171 and 172:
Indicadores Relacionados con la Ing
- Page 173 and 174:
Este año se cumple en Venezuela el
- Page 175 and 176:
Primer Centenario de la Prospecció
- Page 177 and 178:
Primer Centenario de la Prospecció
- Page 179 and 180:
Primer Centenario de la Prospecció
- Page 181 and 182:
Primer Centenario de la Prospecció
- Page 183 and 184:
Primer Centenario de la Prospecció
- Page 185 and 186:
Primer Centenario de la Prospecció
- Page 187 and 188:
Primer Centenario de la Prospecció
- Page 189 and 190:
Primer Centenario de la Prospecció
- Page 191 and 192:
Primer Centenario de la Prospecció
- Page 193 and 194:
Primer Centenario de la Prospecció
- Page 195:
Normas para la aceptación de artí