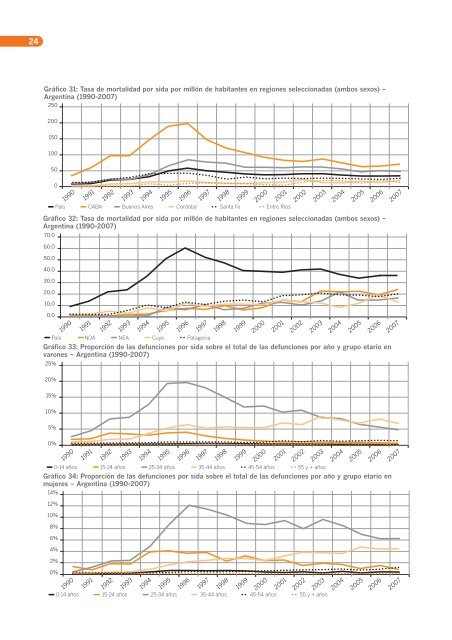
24Gráfico 31: Tasa <strong>de</strong> mortalidad por sida por millón <strong>de</strong> habitantes en regiones seleccionadas (ambos sexos) –Argentina (1990-2007)250200150100500199019911992199319941995País CABA Buenos Aires Córdoba Santa Fe Entre Ríos19961997Gráfico 32: Tasa <strong>de</strong> mortalidad por sida por millón <strong>de</strong> habitantes en regiones seleccionadas (ambos sexos) –Argentina (1990-2007)70.0199819992000200120022003200420052006200760.050.040.030.020.010.00.019901991199219931994199519961997País NOA NEA Cuyo PatagoniaGráfico 33: Proporción <strong>de</strong> las <strong>de</strong>funciones por sida sobre el total <strong>de</strong> las <strong>de</strong>funciones por año y grupo etario envarones – Argentina (1990-2007)25%199819992000200120022003200420052006200720%15%10%5%0%19901991199219931994199519960-14 años 15-24 años 25-34 años 35-44 años 45-54 años 55 y + años199719981999200020012002200320042005Gráfico 34: Proporción <strong>de</strong> las <strong>de</strong>funciones por sida sobre el total <strong>de</strong> las <strong>de</strong>funciones por año y grupo etario enmujeres – Argentina (1990-2007)14%2006200712%10%8%6%4%2%0%19901991199219931994199519960-14 años 15-24 años 25-34 años 35-44 años 45-54 años 55 y + años19971998199920002001200220032004200520062007
25VIGILANCIA EPIDEMIOLÓGICA DE SEGUNDA GENERACIÓNLos cambios ocurridos en losúltimos quince años en los procesosdiagnósticos y terapéuticos<strong>de</strong>l VIH-sida impactarontanto en el período <strong>de</strong> incubación<strong>de</strong> la infección como en lamorbi-mortalidad asociada aella. Estos cambios crearon lanecesidad <strong>de</strong> implementar nuevasestrategias <strong>de</strong> vigilancia epi<strong>de</strong>miológica,ya que los datosaportados por los servicios <strong>de</strong>salud sobre casos <strong>de</strong> sida, infeccioneso <strong>de</strong>funciones (vigilanciaepi<strong>de</strong>miológica <strong>de</strong> primera generación)se tornaron insuficientespara monitorear la evolución <strong>de</strong>la epi<strong>de</strong>mia y guiar el diseño <strong>de</strong>estrategias preventivo-asistencialeseficaces.Con el objeto <strong>de</strong> conocer mejorla epi<strong>de</strong>mia en nuestro país, laDSyETS, con la colaboración <strong>de</strong>OPS y ONUSIDA, <strong>de</strong>sarrolló duranteel último año un trabajo <strong>de</strong>sistematización y análisis <strong>de</strong> losestudios disponibles, que pue<strong>de</strong>nencuadrarse bajo el rótulo <strong>de</strong>“vigilancia epi<strong>de</strong>miológica <strong>de</strong>segunda generación”. Se consi<strong>de</strong>racomo tales a los estudios quepermiten conocer mejor la distribución<strong>de</strong>l VIH en diversas subpoblacionesvulnerables, caracterizara las personas recientementeinfectadas, <strong>de</strong>scribir las prácticasprevalentes en los distintos colectivos,y los factores sociales y biológicosasociados con la transmisión<strong>de</strong>l VIH.Para la sistematización, serecopilaron estudios comportamentales,con o sin datos <strong>de</strong> prevalencia,producidos en nuestropaís en los últimos diez años. Acontinuación, se presenta unresumen <strong>de</strong> los estudios queaportaron datos <strong>de</strong> seroprevalenciaen las distintas poblacionesconsi<strong>de</strong>radas.Varones homosexuales yotros hombres que tienensexo con hombresSe analizó un total <strong>de</strong> seis estudios(Tabla 20), cinco <strong>de</strong> loscuales contaban con datos <strong>de</strong>prevalencia. Cabe aclarar queen dos <strong>de</strong> ellos no se incluyerona las personas que ya conocíansu diagnóstico y, por lo tanto, laprevalencia está subestimada.Sólo hubo un estudio con undiseño prospectivo, que permitióestimar la inci<strong>de</strong>ncia <strong>de</strong>infección en 3,9/100 personasaño (Segura, 2003). Los estudiosanalizados correspon<strong>de</strong>n auna población heterogénea,<strong>de</strong>bido a que en algunos se incluyea las personas transexuales,travestis y transgéneros<strong>de</strong>ntro <strong>de</strong> esta categoría, y enotros no.Tabla 20: Resumen <strong>de</strong> los estudios analizados <strong>de</strong> población <strong>de</strong> varoneshomosexuales y otros hombres que tienen sexo con hombres que contabancon datos <strong>de</strong> prevalenciaAño <strong>de</strong> Región Muestra Prevalencia Referenciasrealización <strong>de</strong> VIH bibliográficas<strong>de</strong>l estudio2000-2001 CABA 694 13,8% (IC 95% 11,4-16,7) 1, 22003 CABA 7,5% 32006 CABA 1.034 10,4% (IC 95% 8-12,7) 42007 AMBA 307 15% 5Mar <strong>de</strong>l PlataRosarioCórdobaBariloche2006-2008 Total 1.590 11,8% (IC 95% 10,2-13,4) 6Buenos Aires 1.560 11,6%S. <strong>de</strong>l Estero 22 22,7%Salta 6 6%Paraná 2 0%