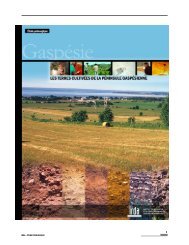
PQRDA1 Les terres cultivées de la MRC de la Côte-de-Beaupré
PQRDA1 Les terres cultivées de la MRC de la Côte-de-Beaupré
PQRDA1 Les terres cultivées de la MRC de la Côte-de-Beaupré

Create successful ePaper yourself
Turn your PDF publications into a flip-book with our unique Google optimized e-Paper software.
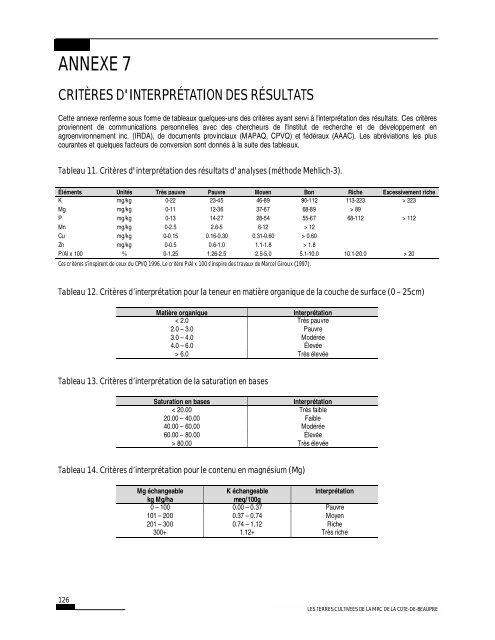
ANNEXE 7<br />
CRITÈRES D'INTERPRÉTATION DES RÉSULTATS<br />
Cette annexe renferme sous forme <strong>de</strong> tableaux quelques-uns <strong>de</strong>s critères ayant servi à l'interprétation <strong>de</strong>s résultats. Ces critères<br />
proviennent <strong>de</strong> communications personnelles avec <strong>de</strong>s chercheurs <strong>de</strong> l'Institut <strong>de</strong> recherche et <strong>de</strong> développement en<br />
agroenvironnement inc. (IRDA), <strong>de</strong> documents provinciaux (MAPAQ, CPVQ) et fédéraux (AAAC). <strong>Les</strong> abréviations les plus<br />
courantes et quelques facteurs <strong>de</strong> conversion sont donnés à <strong>la</strong> suite <strong>de</strong>s tableaux.<br />
Tableau 11. Critères d'interprétation <strong>de</strong>s résultats d'analyses (métho<strong>de</strong> Mehlich-3).<br />
Éléments Unités Très pauvre Pauvre Moyen Bon Riche Excessivement riche<br />
K mg/kg 0-22 23-45 46-89 90-112 113-223 > 223<br />
Mg mg/kg 0-11 12-36 37-67 68-89 > 89<br />
P mg/kg 0-13 14-27 28-54 55-67 68-112 > 112<br />
Mn mg/kg 0-2.5 2.6-5 6-12 > 12<br />
Cu mg/kg 0-0.15 0.16-0.30 0.31-0.60 > 0.60<br />
Zn mg/kg 0-0.5 0.6-1.0 1.1-1.8 > 1.8<br />
P/Al x 100 % 0-1.25 1.26-2.5 2.5-5.0 5.1-10.0 10.1-20.0 > 20<br />
Ces critères s'inspirent <strong>de</strong> ceux du CPVQ 1996. Le critère P/Al x 100 s'inspire <strong>de</strong>s travaux <strong>de</strong> Marcel Giroux (1997).<br />
Tableau 12. Critères d’interprétation pour <strong>la</strong> teneur en matière organique <strong>de</strong> <strong>la</strong> couche <strong>de</strong> surface (0 – 25cm)<br />
126<br />
Matière organique Interprétation<br />
< 2.0 Très pauvre<br />
2.0 – 3.0 Pauvre<br />
3.0 – 4.0 Modérée<br />
4.0 – 6.0 Élevée<br />
> 6.0 Très élevée<br />
Tableau 13. Critères d’interprétation <strong>de</strong> <strong>la</strong> saturation en bases<br />
Saturation en bases Interprétation<br />
< 20.00 Très faible<br />
20.00 – 40.00 Faible<br />
40.00 – 60.00 Modérée<br />
60.00 – 80.00 Élevée<br />
> 80.00 Très élevée<br />
Tableau 14. Critères d’interprétation pour le contenu en magnésium (Mg)<br />
Mg échangeable K échangeable Interprétation<br />
kg Mg/ha meq/100g<br />
0 – 100 0.00 – 0.37 Pauvre<br />
101 – 200 0.37 – 0.74 Moyen<br />
201 – 300 0.74 – 1.12 Riche<br />
300+ 1.12+ Très riche<br />
LES TERRES CULTIVÉES DE LA <strong>MRC</strong> DE LA CÔTE-DE-BEAUPRÉ