Rapport final - Office International de l'Eau
Rapport final - Office International de l'Eau
Rapport final - Office International de l'Eau

You also want an ePaper? Increase the reach of your titles
YUMPU automatically turns print PDFs into web optimized ePapers that Google loves.
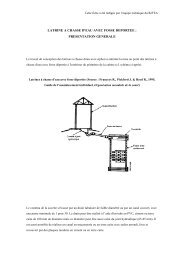
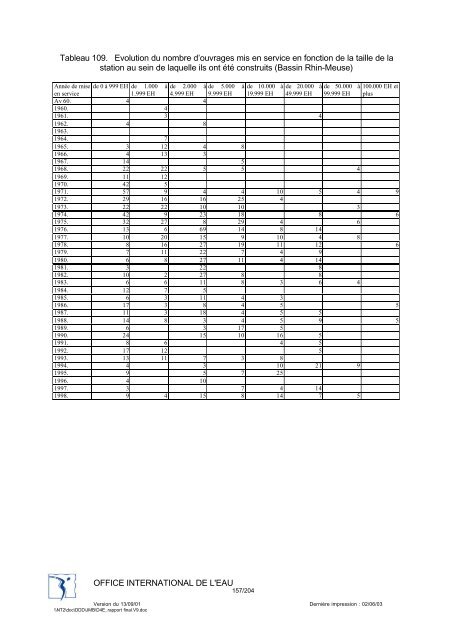
Tableau 109. Evolution du nombre d’ouvrages mis en service en fonction <strong>de</strong> la taille <strong>de</strong> la<br />
station au sein <strong>de</strong> laquelle ils ont été construits (Bassin Rhin-Meuse)<br />
Année <strong>de</strong> mise <strong>de</strong> 0 à 999 EH <strong>de</strong> 1.000 à <strong>de</strong> 2.000 à <strong>de</strong> 5.000 à <strong>de</strong> 10.000 à <strong>de</strong> 20.000 à <strong>de</strong> 50.000 à 100.000 EH et<br />
en service<br />
1.999 EH 4.999 EH 9.999 EH 19.999 EH 49.999 EH 99.999 EH plus<br />
Av 60. 4 4<br />
1960. 4<br />
1961. 3 4<br />
1962. 4 8<br />
1963.<br />
1964. 7<br />
1965. 3 12 4 8<br />
1966. 4 13 3<br />
1967. 14 5<br />
1968. 22 22 5 5 4<br />
1969. 11 12<br />
1970. 42 5<br />
1971. 57 9 4 4 10 5 4 9<br />
1972. 29 16 16 25 4<br />
1973. 22 22 10 10 3<br />
1974. 42 9 23 18 8 6<br />
1975. 32 27 8 29 4 6<br />
1976. 13 6 69 14 8 14<br />
1977. 10 20 15 9 10 4 8<br />
1978. 8 16 27 19 11 12 6<br />
1979. 7 11 22 7 4 9<br />
1980. 6 8 27 11 4 14<br />
1981. 3 22 8<br />
1982. 10 2 27 8 8<br />
1983. 6 6 11 8 3 6 4<br />
1984. 12 7 5<br />
1985. 6 3 11 4 3<br />
1986. 17 3 8 4 5 5<br />
1987. 11 3 18 4 5 5<br />
1988. 14 8 3 4 5 9 5<br />
1989. 6 3 17 5<br />
1990. 24 15 10 16 5<br />
1991. 8 6 4 5<br />
1992. 17 12 5<br />
1993. 13 11 7 3 8<br />
1994. 4 3 10 21 9<br />
1995. 9 5 7 25<br />
1996. 4 10<br />
1997. 3 7 4 14<br />
1998. 9 4 15 8 14 7 5<br />
OFFICE INTERNATIONAL DE L'EAU<br />
157/204<br />
Version du 13/09/01 Dernière impression : 02/06/03<br />
\\NT2\doc\DDD\JMB\D4E_rapport <strong>final</strong>.V9.doc