Rapport final - Office International de l'Eau
Rapport final - Office International de l'Eau
Rapport final - Office International de l'Eau

Create successful ePaper yourself
Turn your PDF publications into a flip-book with our unique Google optimized e-Paper software.
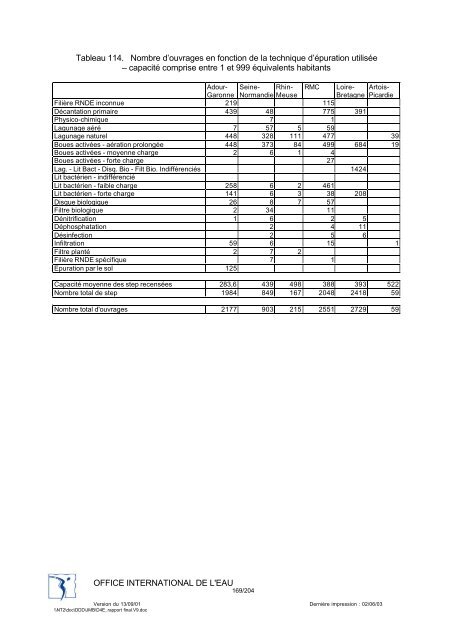
Tableau 114. Nombre d’ouvrages en fonction <strong>de</strong> la technique d’épuration utilisée<br />
– capacité comprise entre 1 et 999 équivalents habitants<br />
Adour- Seine- Rhin- RMC Loire- Artois-<br />
Garonne Normandie Meuse<br />
Bretagne Picardie<br />
Filière RNDE inconnue 219 115<br />
Décantation primaire 439 48 775 391<br />
Physico-chimique 7 1<br />
Lagunage aéré 7 57 5 59<br />
Lagunage naturel 448 328 111 477 39<br />
Boues activées - aération prolongée 448 373 84 499 684 19<br />
Boues activées - moyenne charge 2 6 1 4<br />
Boues activées - forte charge 27<br />
Lag. - Lit Bact - Disq. Bio - Filt Bio. Indifférenciés 1424<br />
Lit bactérien - indifférencié<br />
Lit bactérien - faible charge 258 6 2 461<br />
Lit bactérien - forte charge 141 6 3 38 208<br />
Disque biologique 26 8 7 57<br />
Filtre biologique 2 34 11<br />
Dénitrification 1 6 2 5<br />
Déphosphatation 2 4 11<br />
Désinfection 2 5 6<br />
Infiltration 59 6 15 1<br />
Filtre planté 2 7 2<br />
Filière RNDE spécifique 7 1<br />
Epuration par le sol 125<br />
Capacité moyenne <strong>de</strong>s step recensées 283,6 439 498 388 393 522<br />
Nombre total <strong>de</strong> step 1984 849 167 2048 2418 59<br />
Nombre total d'ouvrages 2177 903 215 2551 2729 59<br />
OFFICE INTERNATIONAL DE L'EAU<br />
169/204<br />
Version du 13/09/01 Dernière impression : 02/06/03<br />
\\NT2\doc\DDD\JMB\D4E_rapport <strong>final</strong>.V9.doc