Rapport final - Office International de l'Eau
Rapport final - Office International de l'Eau
Rapport final - Office International de l'Eau

You also want an ePaper? Increase the reach of your titles
YUMPU automatically turns print PDFs into web optimized ePapers that Google loves.
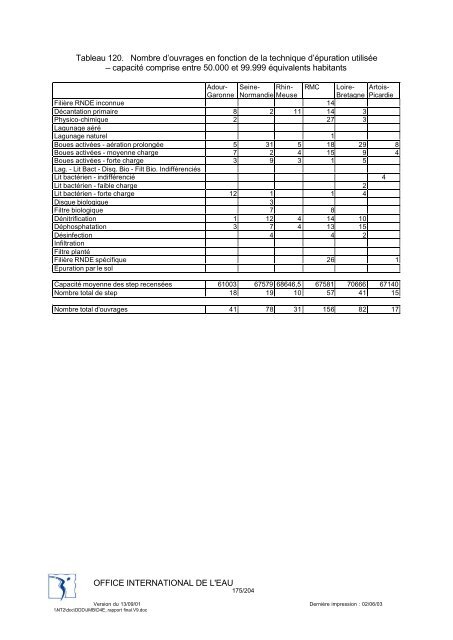
Tableau 120. Nombre d’ouvrages en fonction <strong>de</strong> la technique d’épuration utilisée<br />
– capacité comprise entre 50.000 et 99.999 équivalents habitants<br />
Adour- Seine- Rhin- RMC Loire- Artois-<br />
Garonne Normandie Meuse<br />
Bretagne Picardie<br />
Filière RNDE inconnue 14<br />
Décantation primaire 8 2 11 14 3<br />
Physico-chimique 2 27 3<br />
Lagunage aéré<br />
Lagunage naturel 1<br />
Boues activées - aération prolongée 5 31 5 18 29 8<br />
Boues activées - moyenne charge 7 2 4 15 9 4<br />
Boues activées - forte charge 3 9 3 1 5<br />
Lag. - Lit Bact - Disq. Bio - Filt Bio. Indifférenciés<br />
Lit bactérien - indifférencié 4<br />
Lit bactérien - faible charge 2<br />
Lit bactérien - forte charge 12 1 1 4<br />
Disque biologique 3<br />
Filtre biologique 7 8<br />
Dénitrification 1 12 4 14 10<br />
Déphosphatation 3 7 4 13 15<br />
Désinfection 4 4 2<br />
Infiltration<br />
Filtre planté<br />
Filière RNDE spécifique 26 1<br />
Epuration par le sol<br />
Capacité moyenne <strong>de</strong>s step recensées 61003 67579 68646,5 67581 70666 67140<br />
Nombre total <strong>de</strong> step 18 19 10 57 41 15<br />
Nombre total d'ouvrages 41 78 31 156 82 17<br />
OFFICE INTERNATIONAL DE L'EAU<br />
175/204<br />
Version du 13/09/01 Dernière impression : 02/06/03<br />
\\NT2\doc\DDD\JMB\D4E_rapport <strong>final</strong>.V9.doc