Rapport final - Office International de l'Eau
Rapport final - Office International de l'Eau
Rapport final - Office International de l'Eau

You also want an ePaper? Increase the reach of your titles
YUMPU automatically turns print PDFs into web optimized ePapers that Google loves.
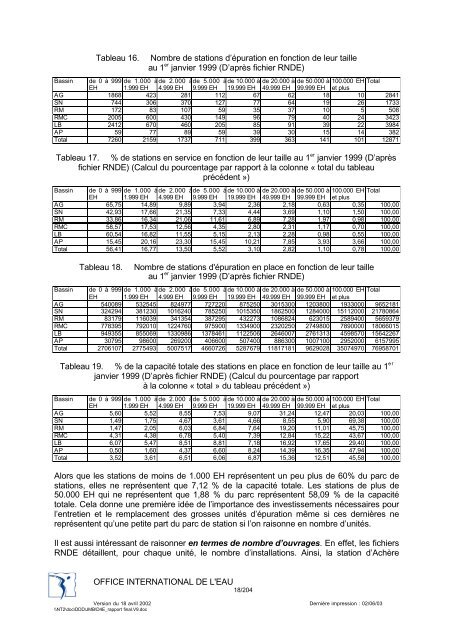
Tableau 16.<br />
Nombre <strong>de</strong> stations d’épuration en fonction <strong>de</strong> leur taille<br />
au 1 er janvier 1999 (D’après fichier RNDE)<br />
Bassin <strong>de</strong> 0 à 999 <strong>de</strong> 1.000 à<strong>de</strong> 2.000 à<strong>de</strong> 5.000 à<strong>de</strong> 10.000 à <strong>de</strong> 20.000 à <strong>de</strong> 50.000 à 100.000 EH Total<br />
EH 1.999 EH 4.999 EH 9.999 EH 19.999 EH 49.999 EH 99.999 EH et plus<br />
AG 1868 423 281 112 67 62 18 10 2841<br />
SN 744 306 370 127 77 64 19 26 1733<br />
RM 172 83 107 59 35 37 10 5 508<br />
RMC 2005 600 430 149 96 79 40 24 3423<br />
LB 2412 670 460 205 85 91 39 22 3984<br />
AP 59 77 89 59 39 30 15 14 382<br />
Total 7260 2159 1737 711 399 363 141 101 12871<br />
Tableau 17. % <strong>de</strong> stations en service en fonction <strong>de</strong> leur taille au 1 er janvier 1999 (D’après<br />
fichier RNDE) (Calcul du pourcentage par rapport à la colonne « total du tableau<br />
précé<strong>de</strong>nt »)<br />
Bassin <strong>de</strong> 0 à 999 <strong>de</strong> 1.000 à<strong>de</strong> 2.000 à<strong>de</strong> 5.000 à<strong>de</strong> 10.000 à <strong>de</strong> 20.000 à <strong>de</strong> 50.000 à 100.000 EH Total<br />
EH 1.999 EH 4.999 EH 9.999 EH 19.999 EH 49.999 EH 99.999 EH et plus<br />
AG 65,75 14,89 9,89 3,94 2,36 2,18 0,63 0,35 100,00<br />
SN 42,93 17,66 21,35 7,33 4,44 3,69 1,10 1,50 100,00<br />
RM 33,86 16,34 21,06 11,61 6,89 7,28 1,97 0,98 100,00<br />
RMC 58,57 17,53 12,56 4,35 2,80 2,31 1,17 0,70 100,00<br />
LB 60,54 16,82 11,55 5,15 2,13 2,28 0,98 0,55 100,00<br />
AP 15,45 20,16 23,30 15,45 10,21 7,85 3,93 3,66 100,00<br />
Total 56,41 16,77 13,50 5,52 3,10 2,82 1,10 0,78 100,00<br />
Tableau 18.<br />
Nombre <strong>de</strong> stations d'épuration en place en fonction <strong>de</strong> leur taille<br />
au 1 er janvier 1999 (D’après fichier RNDE)<br />
Bassin <strong>de</strong> 0 à 999 <strong>de</strong> 1.000 à<strong>de</strong> 2.000 à<strong>de</strong> 5.000 à<strong>de</strong> 10.000 à <strong>de</strong> 20.000 à <strong>de</strong> 50.000 à 100.000 EH Total<br />
EH 1.999 EH 4.999 EH 9.999 EH 19.999 EH 49.999 EH 99.999 EH et plus<br />
AG 540089 532545 824977 727220 875250 3015300 1203800 1933000 9652181<br />
SN 324294 381230 1016240 785250 1015350 1862500 1284000 15112000 21780864<br />
RM 83179 116039 341354 387295 432273 1086824 623015 2589400 5659379<br />
RMC 778395 792010 1224760 975900 1334900 2320250 2749800 7890000 18066015<br />
LB 949355 855069 1330986 1378461 1122506 2646007 2761313 4598570 15642267<br />
AP 30795 98600 269200 406600 507400 886300 1007100 2952000 6157995<br />
Total 2706107 2775493 5007517 4660726 5287679 11817181 9629028 35074970 76958701<br />
Tableau 19. % <strong>de</strong> la capacité totale <strong>de</strong>s stations en place en fonction <strong>de</strong> leur taille au 1 er<br />
janvier 1999 (D’après fichier RNDE) (Calcul du pourcentage par rapport<br />
à la colonne « total » du tableau précé<strong>de</strong>nt »)<br />
Bassin <strong>de</strong> 0 à 999 <strong>de</strong> 1.000 à<strong>de</strong> 2.000 à<strong>de</strong> 5.000 à<strong>de</strong> 10.000 à <strong>de</strong> 20.000 à <strong>de</strong> 50.000 à 100.000 EH Total<br />
EH 1.999 EH 4.999 EH 9.999 EH 19.999 EH 49.999 EH 99.999 EH et plus<br />
AG 5,60 5,52 8,55 7,53 9,07 31,24 12,47 20,03 100,00<br />
SN 1,49 1,75 4,67 3,61 4,66 8,55 5,90 69,38 100,00<br />
RM 1,47 2,05 6,03 6,84 7,64 19,20 11,01 45,75 100,00<br />
RMC 4,31 4,38 6,78 5,40 7,39 12,84 15,22 43,67 100,00<br />
LB 6,07 5,47 8,51 8,81 7,18 16,92 17,65 29,40 100,00<br />
AP 0,50 1,60 4,37 6,60 8,24 14,39 16,35 47,94 100,00<br />
Total 3,52 3,61 6,51 6,06 6,87 15,36 12,51 45,58 100,00<br />
Alors que les stations <strong>de</strong> moins <strong>de</strong> 1.000 EH représentent un peu plus <strong>de</strong> 60% du parc <strong>de</strong><br />
stations, elles ne représentent que 7,12 % <strong>de</strong> la capacité totale. Les stations <strong>de</strong> plus <strong>de</strong><br />
50.000 EH qui ne représentent que 1,88 % du parc représentent 58,09 % <strong>de</strong> la capacité<br />
totale. Cela donne une première idée <strong>de</strong> l’importance <strong>de</strong>s investissements nécessaires pour<br />
l’entretien et le remplacement <strong>de</strong>s grosses unités d’épuration même si ces <strong>de</strong>rnières ne<br />
représentent qu’une petite part du parc <strong>de</strong> station si l’on raisonne en nombre d’unités.<br />
Il est aussi intéressant <strong>de</strong> raisonner en termes <strong>de</strong> nombre d’ouvrages. En effet, les fichiers<br />
RNDE détaillent, pour chaque unité, le nombre d’installations. Ainsi, la station d’Achère<br />
OFFICE INTERNATIONAL DE L'EAU<br />
18/204<br />
Version du 18 avril 2002 Dernière impression : 02/06/03<br />
\\NT2\doc\DDD\JMB\D4E_rapport <strong>final</strong>.V9.doc