Rapport final - Office International de l'Eau
Rapport final - Office International de l'Eau
Rapport final - Office International de l'Eau

Create successful ePaper yourself
Turn your PDF publications into a flip-book with our unique Google optimized e-Paper software.
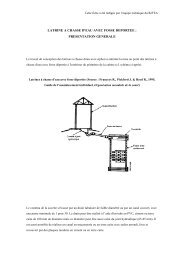
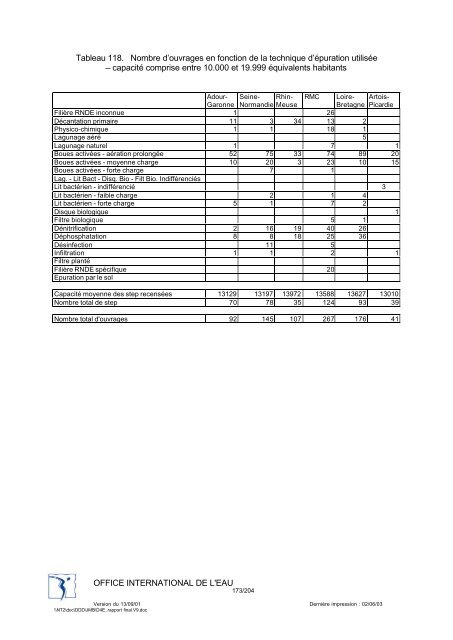
Tableau 118. Nombre d’ouvrages en fonction <strong>de</strong> la technique d’épuration utilisée<br />
– capacité comprise entre 10.000 et 19.999 équivalents habitants<br />
Adour- Seine- Rhin- RMC Loire- Artois-<br />
Garonne Normandie Meuse<br />
Bretagne Picardie<br />
Filière RNDE inconnue 1 26<br />
Décantation primaire 11 3 34 13 2<br />
Physico-chimique 1 1 18 1<br />
Lagunage aéré 5<br />
Lagunage naturel 1 7 1<br />
Boues activées - aération prolongée 52 75 33 74 89 20<br />
Boues activées - moyenne charge 10 20 3 23 10 15<br />
Boues activées - forte charge 7 1<br />
Lag. - Lit Bact - Disq. Bio - Filt Bio. Indifférenciés<br />
Lit bactérien - indifférencié 3<br />
Lit bactérien - faible charge 2 1 4<br />
Lit bactérien - forte charge 5 1 7 2<br />
Disque biologique 1<br />
Filtre biologique 5 1<br />
Dénitrification 2 16 19 40 26<br />
Déphosphatation 8 8 18 25 36<br />
Désinfection 11 5<br />
Infiltration 1 1 2 1<br />
Filtre planté<br />
Filière RNDE spécifique 20<br />
Epuration par le sol<br />
Capacité moyenne <strong>de</strong>s step recensées 13129 13197 13972 13588 13627 13010<br />
Nombre total <strong>de</strong> step 70 78 35 124 93 39<br />
Nombre total d'ouvrages 92 145 107 267 176 41<br />
OFFICE INTERNATIONAL DE L'EAU<br />
173/204<br />
Version du 13/09/01 Dernière impression : 02/06/03<br />
\\NT2\doc\DDD\JMB\D4E_rapport <strong>final</strong>.V9.doc