- Page 1 and 2:
Inventaire et scénario de renouvel
- Page 3 and 4:
2.3.2.1 Valeur à neuf du parc de s
- Page 5 and 6:
1 Introduction Les objectifs de cet
- Page 7 and 8:
Nous nous attacherons donc, dans ce
- Page 9 and 10:
La source ainsi que la méthodologi
- Page 11 and 12:
2.2.2.2 L’âge des réseaux Certa
- Page 13 and 14:
Graphique 1. La desserte par les r
- Page 15 and 16:
Tableau 11. Taux de desserte par un
- Page 17 and 18:
2.2.3 Les stations d’épuration L
- Page 19 and 20:
contient plus de 119 ouvrages dont
- Page 21 and 22:
Tableau 25. Date de mise en service
- Page 23 and 24:
capacités des stations d'épuratio
- Page 25 and 26:
Graphique 7. Evolution du nombre d
- Page 27 and 28:
Ces différentes courbes détaillé
- Page 29 and 30:
Ces trois dernières courbes permet
- Page 31 and 32:
Au 1 er janvier 1999, beaucoup de g
- Page 33 and 34:
Graphique 16. Nombre d’ouvrages e
- Page 35 and 36:
Graphique 20. Nombre d’ouvrages e
- Page 37 and 38:
Graphique 23. Nombre d’ouvrages d
- Page 39 and 40:
Graphique 27. Nombre d’ouvrages d
- Page 41 and 42:
Graphique 31. Nombre d’ouvrages d
- Page 43 and 44:
2.2.5.2 Les diagnostics prévus au
- Page 45 and 46:
Les rares phrases qui évoquent l
- Page 47 and 48:
2.2.5.3 Des outils qui permettront
- Page 49 and 50:
2.2.6.1 Méthodologie de programmat
- Page 51 and 52:
Les paramètres pris en compte pour
- Page 53 and 54:
2.3 Evaluation monétaire des besoi
- Page 55 and 56:
Investissements nécessaires (en mi
- Page 57 and 58:
Tableau 37. Dépenses en réseaux s
- Page 59 and 60:
Graphique 37. Investissements moyen
- Page 61 and 62:
2.3.2 Les stations d’épurations
- Page 63 and 64:
Graphique 42. Echéances optimales
- Page 65 and 66:
Ces chiffres ne laissent pas transp
- Page 67 and 68:
3.2.1.2 Evolution du taux de desser
- Page 69 and 70:
Graphique 45. Taux de desserte en E
- Page 71 and 72:
Graphique 47. Taux de desserte par
- Page 73 and 74:
Graphique 48. Le réseau d’eau po
- Page 75 and 76:
Graphique 50. 40,00% Répartition d
- Page 77 and 78:
Graphique 51. Répartition du liné
- Page 79 and 80:
La base de données SISE-eaux fourn
- Page 81 and 82:
Sur un échantillon de 353 usines,
- Page 83 and 84:
L’enquête sur les 8 département
- Page 85 and 86:
Graphique 57. Année de mise en ser
- Page 87 and 88:
Tableau 66. Communes avec remplacem
- Page 89 and 90:
3.5 L’amélioration des connaissa
- Page 91 and 92:
Par régression linéaire multiple,
- Page 93 and 94:
Ces différentes valeurs démontren
- Page 95 and 96:
D’après ces estimations, les éc
- Page 97 and 98:
3.9 Modèles de renouvellement en e
- Page 99 and 100:
La fonte grise, l’amiante ciment
- Page 101 and 102:
3.9.3 Les paramètres influençant
- Page 103 and 104:
L’unité de recherche en génie c
- Page 105 and 106:
- à l’absence de protection ince
- Page 107 and 108:
4 Etudes de cas 4.1 La Communauté
- Page 109 and 110: La longueur du réseau d’assainis
- Page 111 and 112: 4.1.2.2 Le parc technique de produc
- Page 113 and 114: 4.1.2.2.2 Les pratiques de renouvel
- Page 115 and 116: 4.2 La Communauté Urbaine de Lyon
- Page 117 and 118: 4.2.2.1.2 Pratiques de renouvelleme
- Page 119 and 120: les objectifs de qualité fixés su
- Page 121 and 122: 4.3.3 Pratique de renouvellement Le
- Page 123 and 124: 5 Conclusion La description des par
- Page 125 and 126: conduites d’inventaires, qui pour
- Page 127 and 128: Tableau 93. Evolution du nombre de
- Page 129 and 130: Tableau 95. Evolution du nombre de
- Page 131 and 132: Tableau 97. Evolution du nombre de
- Page 133 and 134: Tableau 99. Evolution de la capacit
- Page 135 and 136: Tableau 101. Evolution de la capaci
- Page 137 and 138: Tableau 103. Evolution de la capaci
- Page 139 and 140: Tableau 105. Evolution de la capaci
- Page 141 and 142: Graphique 67. Evolution du nombre d
- Page 143 and 144: Graphique 71. Evolution du nombre d
- Page 145 and 146: Graphique 75. Evolution du nombre d
- Page 147 and 148: Graphique 79. Evolution de la capac
- Page 149 and 150: Graphique 83. Evolution de la capac
- Page 151 and 152: Graphique 87. Evolution de la capac
- Page 153 and 154: Graphique 91. Evolution de la capac
- Page 155 and 156: Tableau 107. Evolution du nombre d
- Page 157 and 158: Tableau 109. Evolution du nombre d
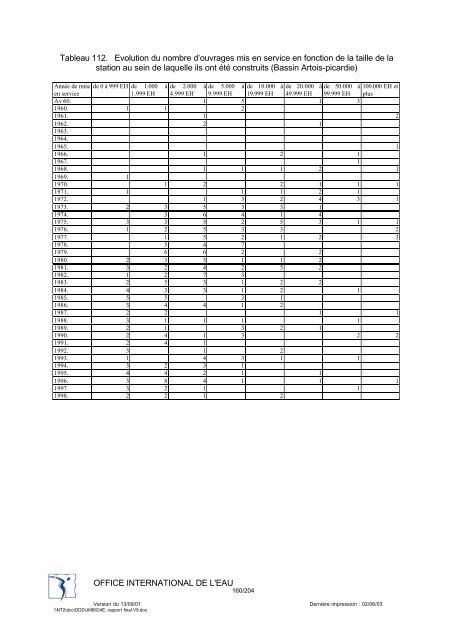
- Page 159: Tableau 111. Evolution du nombre d
- Page 163 and 164: Graphique 97. Evolution du nombre d
- Page 165 and 166: Graphique 101. Evolution du nombre
- Page 167 and 168: Graphique 105. Evolution du nombre
- Page 169 and 170: Tableau 114. Nombre d’ouvrages en
- Page 171 and 172: Tableau 116. Nombre d’ouvrages en
- Page 173 and 174: Tableau 118. Nombre d’ouvrages en
- Page 175 and 176: Tableau 120. Nombre d’ouvrages en
- Page 177 and 178: Tableau 122. Nombre d’ouvrages en
- Page 179 and 180: Tableau 127. Nombre d’ouvrages de
- Page 181 and 182: Tableau 133. Echéances optimales d
- Page 183 and 184: 6.8 Annexe VII : Population desserv
- Page 185 and 186: 6.10 Annexe IX : Capacité de produ
- Page 187 and 188: Pour le département de l’Allier,
- Page 189 and 190: 6.14 Annexe XIII : Caractéristique
- Page 191 and 192: 6.17 Annexe XVI : Montants des inve
- Page 193 and 194: DEUTSCH J.C., 1987, Les problèmes
- Page 195 and 196: 9 Liste des tableaux Tableau 1. Ouv
- Page 197 and 198: Tableau 57. Usines de production d
- Page 199 and 200: Tableau 119. Nombre d’ouvrages en
- Page 201 and 202: Graphique 25. Nombre d’ouvrages d
- Page 203 and 204: Graphique 80. Evolution de la capac