Rapport final - Office International de l'Eau
Rapport final - Office International de l'Eau
Rapport final - Office International de l'Eau

You also want an ePaper? Increase the reach of your titles
YUMPU automatically turns print PDFs into web optimized ePapers that Google loves.
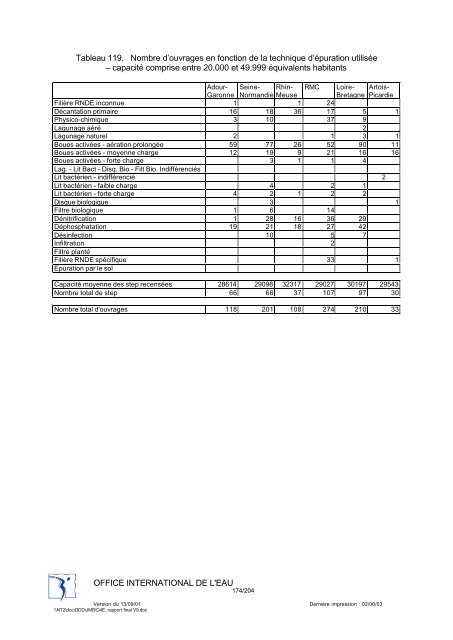
Tableau 119. Nombre d’ouvrages en fonction <strong>de</strong> la technique d’épuration utilisée<br />
– capacité comprise entre 20.000 et 49.999 équivalents habitants<br />
Adour- Seine- Rhin- RMC Loire- Artois-<br />
Garonne Normandie Meuse<br />
Bretagne Picardie<br />
Filière RNDE inconnue 1 1 24<br />
Décantation primaire 16 18 36 17 5 1<br />
Physico-chimique 3 10 37 9<br />
Lagunage aéré 2<br />
Lagunage naturel 2 1 3 1<br />
Boues activées - aération prolongée 59 77 26 52 90 11<br />
Boues activées - moyenne charge 12 19 9 21 16 16<br />
Boues activées - forte charge 3 1 1 4<br />
Lag. - Lit Bact - Disq. Bio - Filt Bio. Indifférenciés<br />
Lit bactérien - indifférencié 2<br />
Lit bactérien - faible charge 4 2 1<br />
Lit bactérien - forte charge 4 2 1 2 2<br />
Disque biologique 3 1<br />
Filtre biologique 1 6 14<br />
Dénitrification 1 28 16 36 29<br />
Déphosphatation 19 21 18 27 42<br />
Désinfection 10 5 7<br />
Infiltration 2<br />
Filtre planté<br />
Filière RNDE spécifique 33 1<br />
Epuration par le sol<br />
Capacité moyenne <strong>de</strong>s step recensées 28614 29098 32317 29027 30197 29543<br />
Nombre total <strong>de</strong> step 66 66 37 107 97 30<br />
Nombre total d'ouvrages 118 201 108 274 210 33<br />
OFFICE INTERNATIONAL DE L'EAU<br />
174/204<br />
Version du 13/09/01 Dernière impression : 02/06/03<br />
\\NT2\doc\DDD\JMB\D4E_rapport <strong>final</strong>.V9.doc