COME CAMBIA IL LIVELLO 2 DI MICROZONAZIONE SISMICA ...
COME CAMBIA IL LIVELLO 2 DI MICROZONAZIONE SISMICA ...
COME CAMBIA IL LIVELLO 2 DI MICROZONAZIONE SISMICA ...

Create successful ePaper yourself
Turn your PDF publications into a flip-book with our unique Google optimized e-Paper software.
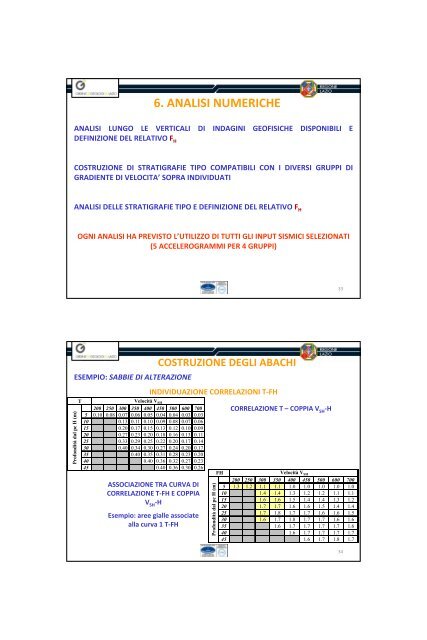
6. ANALISI NUMERICHEANALISI LUNGO LE VERTICALI <strong>DI</strong> INDAGINI GEOFISICHE <strong>DI</strong>SPONIB<strong>IL</strong>I EDEFINIZIONE DEL RELATIVO F HCOSTRUZIONE <strong>DI</strong> STRATIGRAFIE TIPO COMPATIB<strong>IL</strong>I CON I <strong>DI</strong>VERSI GRUPPI <strong>DI</strong>GRA<strong>DI</strong>ENTE <strong>DI</strong> VELOCITA’ SOPRA IN<strong>DI</strong>VIDUATIANALISI DELLE STRATIGRAFIE TIPO E DEFINIZIONE DEL RELATIVO F HOGNI ANALISI HA PREVISTO L’UT<strong>IL</strong>IZZO <strong>DI</strong> TUTTI GLI INPUT SISMICI SELEZIONATI(5 ACCELEROGRAMMI PER 4 GRUPPI)33COSTRUZIONE DEGLI ABACHIESEMPIO: SABBIE <strong>DI</strong> ALTERAZIONEIN<strong>DI</strong>VIDUAZIONE CORRELAZIONI T-FHProfondità dal pc H (m)TVelocità V SH200 250 300 350 400 450 500 600 7005 0.10 0.08 0.07 0.06 0.05 0.04 0.04 0.03 0.0310 0.13 0.11 0.10 0.09 0.08 0.07 0.0615 0.20 0.17 0.15 0.13 0.12 0.10 0.0920 0.27 0.23 0.20 0.18 0.16 0.13 0.1125 0.33 0.29 0.25 0.22 0.20 0.17 0.1430 0.40 0.34 0.30 0.27 0.24 0.20 0.1735 0.40 0.35 0.31 0.28 0.23 0.2040 0.40 0.36 0.32 0.27 0.2345 0.40 0.36 0.30 0.26ASSOCIAZIONE TRA CURVA <strong>DI</strong>CORRELAZIONE T-FH E COPPIAV SH-HEsempio: aree gialle associatealla curva 1 T-FHProfondità dal pc H (m)CORRELAZIONE T – COPPIA V SH-HFHVelocità V SH200 250 300 350 400 450 500 600 7005 1.3 1.2 1.1 1.1 1.0 1.0 1.0 1.0 1.010 1.4 1.4 1.3 1.2 1.2 1.1 1.115 1.6 1.6 1.5 1.4 1.4 1.3 1.220 1.7 1.7 1.6 1.6 1.5 1.4 1.425 1.7 1.8 1.7 1.7 1.6 1.6 1.530 1.6 1.7 1.8 1.7 1.7 1.6 1.635 1.6 1.7 1.7 1.7 1.7 1.640 1.6 1.7 1.7 1.7 1.745 1.6 1.7 1.8 1.734