Appendice 2 – andamento plurienn<strong>al</strong>edei princip<strong>al</strong>i dati del settore forest<strong>al</strong>e2007 2008 2009 2010 <strong>2011</strong>SUPERFICIE BOSCO 617.121 618.545 619.043 620.122 620.719N° RESIDENTI 9.642.406 9.742.676 9.826.841 9.917.714 9.992.548BOSCO/RESIDENTI 640 635 630 625 621Superficie forest<strong>al</strong>e region<strong>al</strong>e (in ettari), numero residenti in Lombardia ISTAT e relativo rapporto (mq/n° residenti)2007 2008 2009 2010 <strong>2011</strong>BG 113.989 114.120 114.226 114.368 114.451BS 168.613 168.937 169.226 169.514 169.642CO 63.392 63.414 63.447 63.459 63.379CR 3.060 3.279 3.344 3.412 3.503LC 42.326 42.454 42.579 42.704 42.786LO 2.583 2.628 2.657 2.662 2.675MN 2.663 2.779 2.888 2.973 3.033MI 10.449 10.547 10.668 10.722 10.761MB 3.<strong>31</strong>6 3.336 3.351 3.372 3.382PV 37.112 37.250 37.325 37.475 37.665SO 114.396 114.558 114.662 114.779 114.822VA 54.645 54.667 54.669 54.681 54.618tot<strong>al</strong>e region<strong>al</strong>e 616.547 617.968 619.043 620.122 620.719Superficie forest<strong>al</strong>e per province (in ettari)2007 2008 2009 2010 <strong>2011</strong>tot<strong>al</strong>eprovinci<strong>al</strong>eBG 25,74 0,00 34,10 40,95 7,35 108,14BS 60,19 12,11 29,98 3,79 19,88 125,95CO 2,41 0,65 2,41 5,47CR 190,55 37,48 39,17 75,72 32,93 375,85LC 20,00 20,00LO 40,10 24,00 11,00 75,10MN 81,23 75,50 49,84 43,77 68,67 <strong>31</strong>9,01MI 66,12 87,47 24,00 35,24 92,50 305,33MB 2,00 2,00PV 60,23 0,88 76,99 152,11 41,05 3<strong>31</strong>,26SO 60,88 10,29 71,17VA 2,88 2,88tot<strong>al</strong>e region<strong>al</strong>e 590,<strong>31</strong> 238,09 266,37 382,58 264,79 1742,14Nuovi boschi re<strong>al</strong>izzati d<strong>al</strong>l’uomo (in ettari) con le princip<strong>al</strong>i iniziative dedicate,:PSR, Sistemi Verdi, Compensazioni94
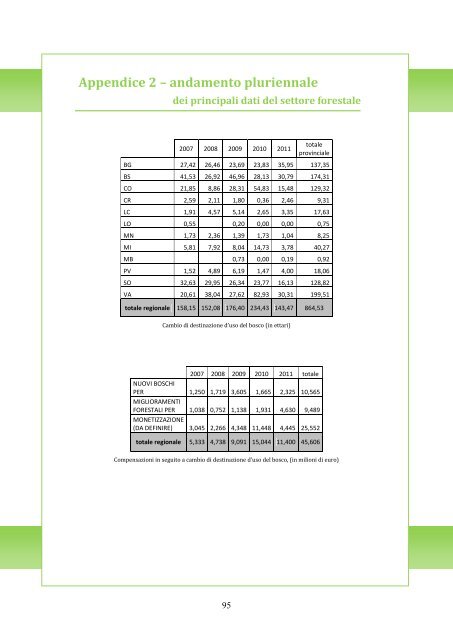
Appendice 2 – andamento plurienn<strong>al</strong>edei princip<strong>al</strong>i dati del settore forest<strong>al</strong>e2007 2008 2009 2010 <strong>2011</strong>tot<strong>al</strong>eprovinci<strong>al</strong>eBG 27,42 26,46 23,69 23,83 35,95 137,35BS 41,53 26,92 46,96 28,13 30,79 174,<strong>31</strong>CO 21,85 8,86 28,<strong>31</strong> 54,83 15,48 129,32CR 2,59 2,11 1,80 0,36 2,46 9,<strong>31</strong>LC 1,91 4,57 5,14 2,65 3,35 17,63LO 0,55 0,20 0,00 0,00 0,75MN 1,73 2,36 1,39 1,73 1,04 8,25MI 5,81 7,92 8,04 14,73 3,78 40,27MB 0,73 0,00 0,19 0,92PV 1,52 4,89 6,19 1,47 4,00 18,06SO 32,63 29,95 26,34 23,77 16,13 128,82VA 20,61 38,04 27,62 82,93 30,<strong>31</strong> 199,51tot<strong>al</strong>e region<strong>al</strong>e 158,15 152,08 176,40 234,43 143,47 864,53Cambio di destinazione d’uso del bosco (in ettari)2007 2008 2009 2010 <strong>2011</strong> tot<strong>al</strong>eNUOVI BOSCHIPER 1,250 1,719 3,605 1,665 2,325 10,565MIGLIORAMENTIFORESTALI PER 1,038 0,752 1,138 1,9<strong>31</strong> 4,630 9,489MONETIZZAZIONE(DA DEFINIRE) 3,045 2,266 4,348 11,448 4,445 25,552tot<strong>al</strong>e region<strong>al</strong>e 5,333 4,738 9,091 15,044 11,400 45,606Compensazioni in seguito a cambio di destinazione d’uso del bosco, (in milioni di euro)95