SodininkyStÄ ir darŽininkyStÄ 28(4)
SodininkyStÄ ir darŽininkyStÄ 28(4)
SodininkyStÄ ir darŽininkyStÄ 28(4)

You also want an ePaper? Increase the reach of your titles
YUMPU automatically turns print PDFs into web optimized ePapers that Google loves.
4. Ferticare 14-11-25, three times before flowering, 5 l ha -1 with 500 l ha -1 of water;<br />
5. Kem<strong>ir</strong>a strawberry foliar fertilizer, three times during flowering. 5 l ha -1 with<br />
500 l ha -1 of water;<br />
6. Aton AZ, once during flowering 4 l ha -1 with 400 l ha -1 of water;<br />
7. Boramin Ca, three times during the development of berries. 2.5 l ha -1 with<br />
500 l ha -1 of water;<br />
8. Maxflow Mg, once during the development of fruit 4 l ha -1 with 400 l ha -1 of<br />
water.<br />
The interval between sprayings was one week. Runners were removed by hand<br />
alongside with picking of the berries in control variant and in all the variants where<br />
foliar fertilization was applied. Berries were harvested every other day. During harvest<br />
the yield was graded into three groups: grade I (diameter ≥ 2.0 cm), grade II (diameter<br />
< 2.0 cm) and cull berries. Every day during harvesting the mass of 100 berries<br />
was weighed and average berry weight was calculated. After the harvesting period,<br />
old leaves were removed by cutting and they were burned. 7 g of fertilizer (Cropcare<br />
3-11-20 in 2004 and Cropcare 0-12-24 in 2005) was given to each plant through<br />
planting holes. The data were analysed by ‘ANOVA’, the A-factor being the year and<br />
B-factor being the effect of the fertilizer. Mean values to be compared are followed<br />
by the same letter if they are not significantly different at P ≤ 0.05.<br />
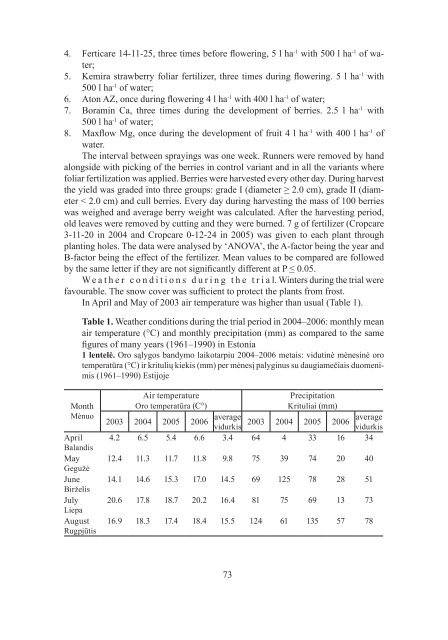
We a t h e r c o n d i t i o n s d u r i n g t h e t r i a l. Winters during the trial were<br />
favourable. The snow cover was sufficient to protect the plants from frost.<br />
In April and May of 2003 a<strong>ir</strong> temperature was higher than usual (Table 1).<br />
Table 1. Weather conditions during the trial period in 2004–2006: monthly mean<br />
a<strong>ir</strong> temperature (°C) and monthly precipitation (mm) as compared to the same<br />
figures of many years (1961–1990) in Estonia<br />
1 lentelė. Oro sąlygos bandymo laikotarpiu 2004–2006 metais: vidutinė mėnesinė oro<br />
temperatūra (°C) <strong>ir</strong> kritulių kiekis (mm) per mėnesį palyginus su daugiamečiais duomenimis<br />
(1961–1990) Estijoje<br />
Month<br />
Mėnuo<br />
April<br />
Balandis<br />
May<br />
Gegužė<br />
June<br />
B<strong>ir</strong>želis<br />
July<br />
Liepa<br />
August<br />
Rugpjūtis<br />
A<strong>ir</strong> temperature<br />
Oro temperatūra (C°)<br />
2003 2004 2005 2006 average<br />
vidurkis<br />
Precipitation<br />
Krituliai (mm)<br />
average<br />
2003 2004 2005 2006<br />
vidurkis<br />
4.2 6.5 5.4 6.6 3.4 64 4 33 16 34<br />
12.4 11.3 11.7 11.8 9.8 75 39 74 20 40<br />
14.1 14.6 15.3 17.0 14.5 69 125 78 <strong>28</strong> 51<br />
20.6 17.8 18.7 20.2 16.4 81 75 69 13 73<br />
16.9 18.3 17.4 18.4 15.5 124 61 135 57 78<br />
73