

Elektrisistetsstatistikk 1958 - Statistisk sentralbyrå
Elektrisistetsstatistikk 1958 - Statistisk sentralbyrå
Elektrisistetsstatistikk 1958 - Statistisk sentralbyrå

You also want an ePaper? Increase the reach of your titles
YUMPU automatically turns print PDFs into web optimized ePapers that Google loves.
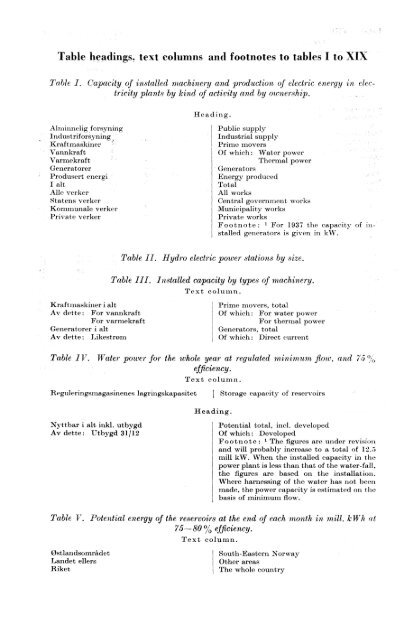
Table headings, text columns and footnotes to tables I to XIX<br />
Table I. capacity of installed machinery and production of electric energy in electricity<br />
plants by kind of activity and by ownership.<br />
Alminnelig forsyning<br />
Industriforsyning<br />
Kraftmaskiner<br />
Vannkraft<br />
Varmekraft<br />
Generatorer<br />
Produsert energi<br />
I alt<br />
Alle verker<br />
Statens verker<br />
Kommunale verker<br />
Private verker<br />
Heading.<br />
Public supply<br />
Industrial supply<br />
Prime movers<br />
Of which: Water power<br />
Thermal power<br />
Generators<br />
Energy produced<br />
Total<br />
All works<br />
Central government works<br />
Municipality works<br />
Private works<br />
Footnote : i For 1937 the capacity of installed<br />
generators is given in kW.<br />
Table II. Hydro electric power stations by size.<br />
Table III.<br />
Kraftmaskiner i alt<br />
Av dette: For vannkraft<br />
For varmekraft<br />
Generatorer i alt<br />
Av dette: Likestrøm<br />
Installed capacity by types of machinery.<br />
Text column.<br />
I Prime movers, total<br />
Of which: For water power<br />
For thermal power<br />
Generators, total<br />
Of which: Direct current<br />
Table IV. Water power for the whole year at regulated minimum flow, and 75<br />
efficiency.<br />
Text column.<br />
Reguleringsmagasinenes lagringskapasitet I Storage capacity of reservoirs<br />
.Nyttbar i alt inkl. utbygd<br />
Av dette: Utbygd 31/12<br />
Heading.<br />
Potential total, incl. developed<br />
Of which: Developed<br />
Footnote : i The figures are under revision<br />
and will probably increase to a total of 12.5<br />
mill kW. When the installed capacity in the<br />
power plant is less than that of the water-fall,<br />
the figures are based on the installation.<br />
Where harnessing of the water has not been<br />
made, the power capacity is estimated on the<br />
basis of minimum flow.<br />
Table V. Potential energy of the reservoirs at the end of each month in mill. kWh at<br />
75-80% efficiency.<br />
Text column.<br />
Ostlandsomradet South-Eastern Norway<br />
Landet ellers Other areas<br />
Riket The whole country


