Janeiro de 2004
Janeiro de 2004
Janeiro de 2004

Create successful ePaper yourself
Turn your PDF publications into a flip-book with our unique Google optimized e-Paper software.
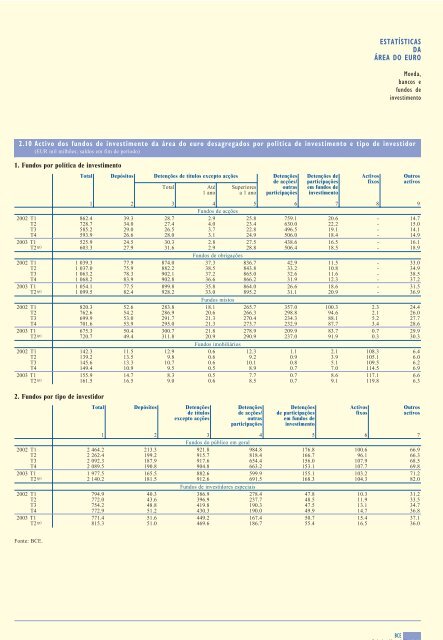
ESTATÍSTICASDAÁREA DO EUROMoeda,bancos efundos <strong>de</strong>investimento2.10 Activo dos fundos <strong>de</strong> investimento da área do euro <strong>de</strong>sagregados por política <strong>de</strong> investimento e tipo <strong>de</strong> investidor(EUR mil milhões; saldos em fim <strong>de</strong> período)1. Fundos por política <strong>de</strong> investimentoTotalDepósitosDetenções <strong>de</strong> títulos excepto acçõesTotalAté1 anoSuperioresa 1 anoDetenções<strong>de</strong> acções/outrasparticipaçõesDetenções <strong>de</strong>participaçõesem fundos <strong>de</strong>investimento1 2 3 4 5 6 7 8 9Fundos <strong>de</strong> acções2002 T1862.4 39.3 28.7 2.9 25.8 759.1 20.6 - 14.7T2728.7 34.0 27.4 4.0 23.4 630.0 22.2 - 15.0T3585.2 29.0 26.5 3.7 22.8 496.5 19.1 - 14.1T4593.9 26.6 28.0 3.1 24.9 506.0 18.4 - 14.92003 T1525.9 24.5 30.3 2.8 27.5 438.6 16.5 - 16.1T2 (p)603.3 27.9 31.6 2.9 28.8 506.4 18.5 - 18.9Fundos <strong>de</strong> obrigações2002 T11 039.3 77.9 874.0 37.3 836.7 42.9 11.5 - 33.0T21 037.0 75.9 882.2 38.5 843.8 33.2 10.8 - 34.9T31 063.2 78.3 902.1 37.2 865.0 32.6 11.6 - 38.5T41 068.2 83.9 902.8 36.6 866.2 31.9 12.3 - 37.22003 T11 054.1 77.5 899.8 35.8 864.0 26.6 18.6 - 31.5T2 (p)1 099.5 82.4 928.2 33.0 895.2 31.1 20.9 - 36.9Fundos mistos2002 T1820.3 52.6 283.8 18.1 265.7 357.0 100.3 2.3 24.4T2 (p) 815.3 51.0 469.6 186.7 55.4 16.5 36.0T2762.6 54.2 286.9 20.6 266.3 298.8 94.6 2.1 26.0T3699.9 53.0 291.7 21.3 270.4 234.3 88.1 5.2 27.7T4701.6 53.9 295.0 21.3 273.7 232.9 87.7 3.4 28.62003 T1675.3 50.4 300.7 21.8 278.9 209.9 83.7 0.7 29.9T2 (p)720.7 49.4 311.8 20.9 290.9 237.0 91.9 0.3 30.3Fundos imobiliários2002 T1142.3 11.5 12.9 0.6 12.3 1.1 2.1 108.3 6.4T2139.2 13.5 9.8 0.6 9.2 0.9 3.9 105.1 6.0T3145.6 13.3 10.7 0.6 10.1 0.8 5.1 109.5 6.2T4149.4 10.9 9.5 0.5 8.9 0.7 7.0 114.5 6.92003 T1155.9 14.7 8.3 0.5 7.7 0.7 8.6 117.1 6.6T2 (p)161.5 16.5 9.0 0.6 8.5 0.7 9.1 119.8 6.32. Fundos por tipo <strong>de</strong> investidorTotal Depósitos Detenções<strong>de</strong> títulosDetenções<strong>de</strong> acções/Detenções<strong>de</strong> participaçõesActivosfixosOutrosactivosexcepto acçõesoutrasparticipaçõesem fundos <strong>de</strong>investimento1 2 3 4 5 6 7Fundos do público em geral2002 T12 464.2 213.3 921.8 984.8 176.8 100.6 66.9T22 262.4 199.2 915.7 818.4 166.7 96.1 66.3T32 092.3 187.9 917.6 654.4 156.0 107.9 68.5T42 089.5 190.8 904.8 663.2 153.1 107.7 69.82003 T11 977.5 165.5 882.6 599.9 155.1 103.2 71.2T2 (p)2 140.2 181.5 912.6 691.5 168.3 104.3 82.0Fundos <strong>de</strong> investidores especiais2002 T1794.9 40.3 386.9 278.4 47.8 10.3 31.2T2772.0 43.6 396.9 237.7 48.5 11.9 33.5T3754.2 48.8 419.8 190.3 47.5 13.1 34.7T4772.9 51.2 430.3 190.0 49.9 14.7 36.82003 T1771.4 51.6 449.2 167.4 50.7 15.4 37.1ActivosfixosOutrosactivosFonte: BCE.BCEBoletim Mensal<strong>Janeiro</strong> <strong>2004</strong>E25