- Page 1 and 2:
Volume 60 Anuário Estatístico do
- Page 3 and 4:
Presidente da República Fernando H
- Page 5 and 6:
INSTITUTO BRASILEIRO DE GEOGRAFIA E
- Page 8:
Sumário Geral Guia de Leitura Seç
- Page 11 and 12:
GUIA DE LEITURA ANUÁRIO ESTATÍSTI
- Page 13 and 14:
SUMÁRIO DAS SEÇÕES ANUÁRIO ESTA
- Page 15 and 16:
SUMÁRIO DAS SEÇÕES ANUÁRIO ESTA
- Page 17 and 18:
Seção Caracterização do Territ
- Page 19 and 20:
ANUÁRIO ESTATÍSTICO DO BRASIL - 2
- Page 21 and 22:
Posição e Extensão Odesdobrament
- Page 23 and 24:
Localização Geográfica O Brasil
- Page 25 and 26:
ANUÁRIO ESTATÍSTICO DO BRASIL - 2
- Page 27 and 28:
ANUÁRIO ESTATÍSTICO DO BRASIL - 2
- Page 29 and 30:
ANUÁRIO ESTATÍSTICO DO BRASIL - 2
- Page 31 and 32:
ÁREAS TERRITÓRIAIS ANUÁRIO ESTAT
- Page 33 and 34:
ÁREAS TERRITÓRIAIS ANUÁRIO ESTAT
- Page 35 and 36:
SISTEMA GEODÉSICO BRASILEIRO ANUÁ
- Page 37 and 38:
SISTEMA GEODÉSICO BRASILEIRO ANUÁ
- Page 39 and 40:
SISTEMA GEODÉSICO BRASILEIRO ANUÁ
- Page 41 and 42:
SISTEMA GEODÉSICO BRASILEIRO ANUÁ
- Page 43 and 44:
MAPEAMENTO SISTEMÁTICO DO BRASIL A
- Page 45 and 46:
Divisão Territorial
- Page 47 and 48:
DIVISÃO TERRITORIAL ANUÁRIO ESTAT
- Page 49 and 50:
DIVISÃO POLÍTICO-ADMINISTRATIVA E
- Page 51 and 52:
DIVISÃO POLÍTICO-ADMINISTRATIVA E
- Page 53 and 54:
DIVISÃO POLÍTICO-ADMINISTRATIVA E
- Page 55 and 56:
DIVISÃO POLÍTICO-ADMINISTRATIVA E
- Page 57 and 58:
CARACTERÍSTICAS DOS MUNICÍPIOS AN
- Page 59 and 60:
CARACTERÍSTICAS DOS MUNICÍPIOS AN
- Page 61 and 62:
CARACTERÍSTICAS DOS MUNICÍPIOS AN
- Page 63 and 64:
Recursos Naturais e Meio Ambiente
- Page 65 and 66:
RECURSOS NATURAIS E MEIO AMBIENTE A
- Page 67 and 68:
Geologia e Recursos Minerais Comple
- Page 69 and 70:
ANUÁRIO ESTATÍSTICO DO BRASIL - 2
- Page 71 and 72:
ANUÁRIO ESTATÍSTICO DO BRASIL - 2
- Page 73 and 74:
ANUÁRIO ESTATÍSTICO DO BRASIL - 2
- Page 75 and 76:
ANUÁRIO ESTATÍSTICO DO BRASIL - 2
- Page 77 and 78:
CLIMA ANUÁRIO ESTATÍSTICO DO BRAS
- Page 79 and 80:
CLIMA ANUÁRIO ESTATÍSTICO DO BRAS
- Page 81 and 82:
Compartimentos de Relevo Opresente
- Page 83 and 84:
ANUÁRIO ESTATÍSTICO DO BRASIL - 2
- Page 85 and 86:
ANUÁRIO ESTATÍSTICO DO BRASIL - 2
- Page 87 and 88:
ANUÁRIO ESTATÍSTICO DO BRASIL - 2
- Page 89 and 90:
ANUÁRIO ESTATÍSTICO DO BRASIL - 2
- Page 91 and 92:
ANUÁRIO ESTATÍSTICO DO BRASIL - 2
- Page 93 and 94:
ANUÁRIO ESTATÍSTICO DO BRASIL - 2
- Page 95 and 96:
ANUÁRIO ESTATÍSTICO DO BRASIL - 2
- Page 97 and 98:
ANUÁRIO ESTATÍSTICO DO BRASIL - 2
- Page 99 and 100:
ANUÁRIO ESTATÍSTICO DO BRASIL - 2
- Page 101 and 102:
ANUÁRIO ESTATÍSTICO DO BRASIL - 2
- Page 103 and 104:
ANUÁRIO ESTATÍSTICO DO BRASIL - 2
- Page 105 and 106:
ANUÁRIO ESTATÍSTICO DO BRASIL - 2
- Page 107 and 108:
ANUÁRIO ESTATÍSTICO DO BRASIL - 2
- Page 109 and 110:
Solos e sua Potencialidade Agrícol
- Page 111 and 112:
ANUÁRIO ESTATÍSTICO DO BRASIL - 2
- Page 113 and 114:
ANUÁRIO ESTATÍSTICO DO BRASIL - 2
- Page 115 and 116:
ANUÁRIO ESTATÍSTICO DO BRASIL - 2
- Page 117 and 118:
ANUÁRIO ESTATÍSTICO DO BRASIL - 2
- Page 119 and 120:
ANUÁRIO ESTATÍSTICO DO BRASIL - 2
- Page 121 and 122:
Recursos Hídricos A água é um re
- Page 123 and 124:
ANUÁRIO ESTATÍSTICO DO BRASIL - 2
- Page 125 and 126:
ANUÁRIO ESTATÍSTICO DO BRASIL - 2
- Page 127 and 128:
ANUÁRIO ESTATÍSTICO DO BRASIL - 2
- Page 129 and 130:
ANUÁRIO ESTATÍSTICO DO BRASIL - 2
- Page 131 and 132:
ANUÁRIO ESTATÍSTICO DO BRASIL - 2
- Page 133 and 134:
ANUÁRIO ESTATÍSTICO DO BRASIL - 2
- Page 135 and 136:
VEGETAÇÃO E RECURSOS FLORÍSTICOS
- Page 137 and 138:
VEGETAÇÃO E RECURSOS FLORÍSTICOS
- Page 139 and 140:
VEGETAÇÃO E RECURSOS FLORÍSTICOS
- Page 141 and 142:
VEGETAÇÃO E RECURSOS FLORÍSTICOS
- Page 143 and 144:
VEGETAÇÃO E RECURSOS FLORÍSTICOS
- Page 145 and 146:
Fauna Fauna Silvestre Ameaçada de
- Page 147 and 148:
ANUÁRIO ESTATÍSTICO DO BRASIL - 2
- Page 149 and 150:
ANUÁRIO ESTATÍSTICO DO BRASIL - 2
- Page 151 and 152:
ANUÁRIO ESTATÍSTICO DO BRASIL - 2
- Page 153 and 154:
UNIDADES DE CONSERVAÇÃO E TERRAS
- Page 155 and 156:
UNIDADES DE CONSERVAÇÃO E TERRAS
- Page 157 and 158:
UNIDADES DE CONSERVAÇÃO E TERRAS
- Page 159 and 160:
UNIDADES DE CONSERVAÇÃO E TERRAS
- Page 161 and 162:
UNIDADES DE CONSERVAÇÃO E TERRAS
- Page 163 and 164:
UNIDADES DE CONSERVAÇÃO E TERRAS
- Page 165 and 166:
UNIDADES DE CONSERVAÇÃO E TERRAS
- Page 167 and 168:
UNIDADES DE CONSERVAÇÃO E TERRAS
- Page 169 and 170:
UNIDADES DE CONSERVAÇÃO E TERRAS
- Page 171 and 172:
UNIDADES DE CONSERVAÇÃO E TERRAS
- Page 173 and 174:
Dinâmica Espacial A dinâmica do t
- Page 175 and 176:
ANUÁRIO ESTATÍSTICO DO BRASIL - 2
- Page 177 and 178:
ANUÁRIO ESTATÍSTICO DO BRASIL - 2
- Page 179 and 180:
ANUÁRIO ESTATÍSTICO DO BRASIL - 2
- Page 181 and 182:
ANUÁRIO ESTATÍSTICO DO BRASIL - 2
- Page 183 and 184:
ANUÁRIO ESTATÍSTICO DO BRASIL - 2
- Page 185 and 186:
ANUÁRIO ESTATÍSTICO DO BRASIL - 2
- Page 187 and 188:
ANUÁRIO ESTATÍSTICO DO BRASIL - 2
- Page 189 and 190:
Glossário ação antrópica Ativid
- Page 191 and 192:
ANUÁRIO ESTATÍSTICO DO BRASIL - 2
- Page 193 and 194:
ANUÁRIO ESTATÍSTICO DO BRASIL - 2
- Page 195 and 196:
Bibliografia ABELHA: boletim inform
- Page 197 and 198:
ANUÁRIO ESTATÍSTICO DO BRASIL - 2
- Page 199 and 200:
ANUÁRIO ESTATÍSTICO DO BRASIL - 2
- Page 201 and 202:
SUMÁRIO DAS SEÇÕES ANUÁRIO ESTA
- Page 203 and 204:
SUMÁRIO DAS SEÇÕES ANUÁRIO ESTA
- Page 205 and 206:
SUMÁRIO DAS SEÇÕES ANUÁRIO ESTA
- Page 207 and 208:
SUMÁRIO DAS SEÇÕES ANUÁRIO ESTA
- Page 209 and 210:
Seção Características Demográfi
- Page 211 and 212:
Demografia
- Page 213 and 214:
ESTATÍSTICAS POPULACIONAIS ANUÁRI
- Page 215 and 216:
ESTATÍSTICAS POPULACIONAIS ANUÁRI
- Page 217 and 218:
ESTATÍSTICAS POPULACIONAIS ANUÁRI
- Page 219 and 220:
ESTATÍSTICAS POPULACIONAIS ANUÁRI
- Page 221 and 222:
ESTATÍSTICAS POPULACIONAIS ANUÁRI
- Page 223 and 224:
ESTATÍSTICAS POPULACIONAIS ANUÁRI
- Page 225 and 226:
ESTATÍSTICAS POPULACIONAIS ANUÁRI
- Page 227 and 228:
ESTATÍSTICAS POPULACIONAIS ANUÁRI
- Page 229 and 230:
ESTATÍSTICAS POPULACIONAIS ANUÁRI
- Page 231 and 232:
ESTATÍSTICAS POPULACIONAIS ANUÁRI
- Page 233 and 234:
ESTATÍSTICAS POPULACIONAIS ANUÁRI
- Page 235 and 236:
ESTATÍSTICAS POPULACIONAIS ANUÁRI
- Page 237 and 238:
ESTATÍSTICAS POPULACIONAIS ANUÁRI
- Page 239 and 240:
ESTATÍSTICAS POPULACIONAIS ANUÁRI
- Page 241 and 242:
ESTATÍSTICAS POPULACIONAIS ANUÁRI
- Page 243 and 244:
ESTATÍSTICAS POPULACIONAIS ANUÁRI
- Page 245 and 246:
ESTATÍSTICAS POPULACIONAIS ANUÁRI
- Page 247 and 248:
ESTATÍSTICAS POPULACIONAIS ANUÁRI
- Page 249 and 250:
ESTATÍSTICAS POPULACIONAIS ANUÁRI
- Page 251 and 252:
ESTATÍSTICAS POPULACIONAIS ANUÁRI
- Page 253 and 254:
ESTATÍSTICAS POPULACIONAIS ANUÁRI
- Page 255 and 256:
ESTATÍSTICAS POPULACIONAIS ANUÁRI
- Page 257 and 258:
ESTATÍSTICAS POPULACIONAIS ANUÁRI
- Page 259 and 260:
INDICADORES DEMOGRÁFICOS ANUÁRIO
- Page 261 and 262:
INDICADORES DEMOGRÁFICOS ANUÁRIO
- Page 263 and 264:
INDICADORES DEMOGRÁFICOS ANUÁRIO
- Page 265 and 266:
INDICADORES DEMOGRÁFICOS ANUÁRIO
- Page 267 and 268:
FAMÍLIA ANUÁRIO ESTATÍSTICO DO B
- Page 269 and 270:
FAMÍLIA ANUÁRIO ESTATÍSTICO DO B
- Page 271 and 272:
MIGRAÇÃO ANUÁRIO ESTATÍSTICO DO
- Page 273 and 274:
MIGRAÇÃO ANUÁRIO ESTATÍSTICO DO
- Page 275 and 276:
MIGRAÇÃO ANUÁRIO ESTATÍSTICO DO
- Page 277 and 278:
CRIANÇAS E ADOLECENTES ANUÁRIO ES
- Page 279 and 280:
Trabalho e Rendimento Com o objetiv
- Page 281 and 282:
ANUÁRIO ESTATÍSTICO DO BRASIL - 2
- Page 283 and 284:
ANUÁRIO ESTATÍSTICO DO BRASIL - 2
- Page 285 and 286:
ANUÁRIO ESTATÍSTICO DO BRASIL - 2
- Page 287 and 288:
ANUÁRIO ESTATÍSTICO DO BRASIL - 2
- Page 289 and 290:
ANUÁRIO ESTATÍSTICO DO BRASIL - 2
- Page 291 and 292:
ANUÁRIO ESTATÍSTICO DO BRASIL - 2
- Page 293 and 294:
ANUÁRIO ESTATÍSTICO DO BRASIL - 2
- Page 295 and 296:
ANUÁRIO ESTATÍSTICO DO BRASIL - 2
- Page 297 and 298:
ANUÁRIO ESTATÍSTICO DO BRASIL - 2
- Page 299 and 300:
ANUÁRIO ESTATÍSTICO DO BRASIL - 2
- Page 301 and 302:
ANUÁRIO ESTATÍSTICO DO BRASIL - 2
- Page 303 and 304:
ANUÁRIO ESTATÍSTICO DO BRASIL - 2
- Page 305 and 306:
ANUÁRIO ESTATÍSTICO DO BRASIL - 2
- Page 307 and 308:
ANUÁRIO ESTATÍSTICO DO BRASIL - 2
- Page 309 and 310:
ANUÁRIO ESTATÍSTICO DO BRASIL - 2
- Page 311 and 312:
ANUÁRIO ESTATÍSTICO DO BRASIL - 2
- Page 313 and 314:
Saúde e Previdência Social OSiste
- Page 315 and 316:
ANUÁRIO ESTATÍSTICO DO BRASIL - 2
- Page 317 and 318:
ANUÁRIO ESTATÍSTICO DO BRASIL - 2
- Page 319 and 320:
ANUÁRIO ESTATÍSTICO DO BRASIL - 2
- Page 321 and 322:
ANUÁRIO ESTATÍSTICO DO BRASIL - 2
- Page 323 and 324:
ANUÁRIO ESTATÍSTICO DO BRASIL - 2
- Page 325 and 326:
ANUÁRIO ESTATÍSTICO DO BRASIL - 2
- Page 327 and 328:
ANUÁRIO ESTATÍSTICO DO BRASIL - 2
- Page 329 and 330:
ANUÁRIO ESTATÍSTICO DO BRASIL - 2
- Page 331 and 332:
ANUÁRIO ESTATÍSTICO DO BRASIL - 2
- Page 333 and 334:
ANUÁRIO ESTATÍSTICO DO BRASIL - 2
- Page 335 and 336:
ANUÁRIO ESTATÍSTICO DO BRASIL - 2
- Page 337 and 338:
ANUÁRIO ESTATÍSTICO DO BRASIL - 2
- Page 339 and 340:
ANUÁRIO ESTATÍSTICO DO BRASIL - 2
- Page 341 and 342:
ANUÁRIO ESTATÍSTICO DO BRASIL - 2
- Page 343 and 344:
ANUÁRIO ESTATÍSTICO DO BRASIL - 2
- Page 345 and 346:
ANUÁRIO ESTATÍSTICO DO BRASIL - 2
- Page 347 and 348:
ANUÁRIO ESTATÍSTICO DO BRASIL - 2
- Page 349 and 350:
ANUÁRIO ESTATÍSTICO DO BRASIL - 2
- Page 351 and 352:
ANUÁRIO ESTATÍSTICO DO BRASIL - 2
- Page 353 and 354:
ANUÁRIO ESTATÍSTICO DO BRASIL - 2
- Page 355 and 356:
ANUÁRIO ESTATÍSTICO DO BRASIL - 2
- Page 357 and 358:
ANUÁRIO ESTATÍSTICO DO BRASIL - 2
- Page 359 and 360:
Educação
- Page 361 and 362:
EDUCAÇÃO ANUÁRIO ESTATÍSTICO DO
- Page 363 and 364:
CARACTERÍSTICAS DE INSTRUÇÃO DA
- Page 365 and 366:
CARACTERÍSTICAS DE INSTRUÇÃO DA
- Page 367 and 368:
CARACTERÍSTICAS DE INSTRUÇÃO DA
- Page 369 and 370:
CARACTERÍSTICAS DE INSTRUÇÃO DA
- Page 371 and 372:
CARACTERÍSTICAS DE INSTRUÇÃO DA
- Page 373 and 374:
CARACTERÍSTICAS DE INSTRUÇÃO DA
- Page 375 and 376:
CARACTERÍSTICAS DE INSTRUÇÃO DA
- Page 377 and 378:
CARACTERÍSTICAS DE INSTRUÇÃO DA
- Page 379 and 380:
ENSINO ANUÁRIO ESTATÍSTICO DO BRA
- Page 381 and 382:
ENSINO ANUÁRIO ESTATÍSTICO DO BRA
- Page 383 and 384:
ENSINO ANUÁRIO ESTATÍSTICO DO BRA
- Page 385 and 386:
ENSINO ANUÁRIO ESTATÍSTICO DO BRA
- Page 387 and 388:
ENSINO ANUÁRIO ESTATÍSTICO DO BRA
- Page 389 and 390:
ENSINO ANUÁRIO ESTATÍSTICO DO BRA
- Page 391 and 392:
ENSINO ANUÁRIO ESTATÍSTICO DO BRA
- Page 393 and 394:
ENSINO ANUÁRIO ESTATÍSTICO DO BRA
- Page 395 and 396:
ENSINO ANUÁRIO ESTATÍSTICO DO BRA
- Page 397 and 398:
ENSINO ANUÁRIO ESTATÍSTICO DO BRA
- Page 399 and 400:
ENSINO ANUÁRIO ESTATÍSTICO DO BRA
- Page 401 and 402:
ENSINO ANUÁRIO ESTATÍSTICO DO BRA
- Page 403 and 404:
ENSINO ANUÁRIO ESTATÍSTICO DO BRA
- Page 405 and 406:
ENSINO ANUÁRIO ESTATÍSTICO DO BRA
- Page 407 and 408:
Habitação
- Page 409 and 410:
CARACTERÍSTICAS DO DOMICÍLIO ANU
- Page 411 and 412:
CARACTERÍSTICAS DO DOMICÍLIO ANU
- Page 413 and 414:
CARACTERÍSTICAS DO DOMICÍLIO ANU
- Page 415 and 416:
Justiça e Segurança Pública Este
- Page 417 and 418:
ANUÁRIO ESTATÍSTICO DO BRASIL - 2
- Page 419 and 420:
ANUÁRIO ESTATÍSTICO DO BRASIL - 2
- Page 421 and 422:
ANUÁRIO ESTATÍSTICO DO BRASIL - 2
- Page 423 and 424:
Movimento Eleitoral
- Page 425 and 426:
MOVIMENTO ELEITORAL ANUÁRIO ESTAT
- Page 427 and 428:
MOVIMENTO ELEITORAL ANUÁRIO ESTAT
- Page 429 and 430:
MOVIMENTO ELEITORAL ANUÁRIO ESTAT
- Page 431 and 432:
GLOSSÁRIO ANUÁRIO ESTATÍSTICO DO
- Page 433 and 434:
GLOSSÁRIO ANUÁRIO ESTATÍSTICO DO
- Page 435 and 436:
GLOSSÁRIO ANUÁRIO ESTATÍSTICO DO
- Page 437 and 438:
GLOSSÁRIO ANUÁRIO ESTATÍSTICO DO
- Page 439 and 440:
GLOSSÁRIO ANUÁRIO ESTATÍSTICO DO
- Page 441 and 442:
Bibliografia ACESSO e utilização
- Page 443 and 444:
Sumário da Seção 3 Aspectos das
- Page 445 and 446:
ANUÁRIO ESTATÍSTICO DO BRASIL - 2
- Page 447 and 448:
Seção Aspectos das Atividades Agr
- Page 449 and 450:
Armazenagem e Estocagem
- Page 451 and 452:
ARMAZENAGEM E ESTOCAGEM ANUÁRIO ES
- Page 453 and 454:
ARMAZENAGEM E ESTOCAGEM ANUÁRIO ES
- Page 455 and 456:
ARMAZENAGEM E ESTOCAGEM ANUÁRIO ES
- Page 457 and 458:
Crédito e Assistência Rural Em Cr
- Page 459 and 460:
ANUÁRIO ESTATÍSTICO DO BRASIL - 2
- Page 461 and 462:
ANUÁRIO ESTATÍSTICO DO BRASIL - 2
- Page 463 and 464:
Produção Vegetal
- Page 465 and 466:
AGRICULTURA ANUÁRIO ESTATÍSTICO D
- Page 467 and 468:
AGRICULTURA ANUÁRIO ESTATÍSTICO D
- Page 469 and 470:
AGRICULTURA ANUÁRIO ESTATÍSTICO D
- Page 471 and 472:
AGRICULTURA ANUÁRIO ESTATÍSTICO D
- Page 473 and 474:
AGRICULTURA ANUÁRIO ESTATÍSTICO D
- Page 475 and 476:
AGRICULTURA ANUÁRIO ESTATÍSTICO D
- Page 477 and 478:
AGRICULTURA ANUÁRIO ESTATÍSTICO D
- Page 479 and 480:
AGRICULTURA ANUÁRIO ESTATÍSTICO D
- Page 481 and 482:
AGRICULTURA ANUÁRIO ESTATÍSTICO D
- Page 483 and 484:
AGRICULTURA ANUÁRIO ESTATÍSTICO D
- Page 485 and 486:
AGRICULTURA ANUÁRIO ESTATÍSTICO D
- Page 487 and 488:
AGRICULTURA ANUÁRIO ESTATÍSTICO D
- Page 489 and 490:
AGRICULTURA ANUÁRIO ESTATÍSTICO D
- Page 491 and 492:
AGRICULTURA ANUÁRIO ESTATÍSTICO D
- Page 493 and 494:
EXTRAÇÃO VEGETAL E SILVICULTURA A
- Page 495 and 496:
EXTRAÇÃO VEGETAL E SILVICULTURA A
- Page 497 and 498:
EXTRAÇÃO VEGETAL E SILVICULTURA A
- Page 499 and 500:
EXTRAÇÃO VEGETAL E SILVICULTURA A
- Page 501 and 502:
EXTRAÇÃO VEGETAL E SILVICULTURA A
- Page 503 and 504:
Produção Animal
- Page 505 and 506:
ABATE DE ANIMAIS ANUÁRIO ESTATÍST
- Page 507 and 508:
PRODUTOS DE ORIGEM ANIMAL ANUÁRIO
- Page 509 and 510:
PRODUTOS DE ORIGEM ANIMAL ANUÁRIO
- Page 511 and 512:
PRODUTOS DE ORIGEM ANIMAL ANUÁRIO
- Page 513 and 514:
Efetivos
- Page 515 and 516:
EFETIVO PECUÁRIO ANUÁRIO ESTATÍS
- Page 517 and 518:
EFETIVO PECUÁRIO ANUÁRIO ESTATÍS
- Page 519 and 520:
Glossário animais abatidos (Pesqui
- Page 521 and 522:
ANUÁRIO ESTATÍSTICO DO BRASIL - 2
- Page 523 and 524:
Bibliografia ANUÁRIO ESTATÍSTICO
- Page 525 and 526:
SUMÁRIO DAS SEÇÕES ANUÁRIO ESTA
- Page 527 and 528:
SUMÁRIO DAS SEÇÕES ANUÁRIO ESTA
- Page 529 and 530:
Aspectos da Atividade Indústria Se
- Page 531 and 532:
ASPECTOS DA ATIVIDADE INDÚSTRIA AN
- Page 533 and 534:
Indústrias Extrativa Mineral e de
- Page 535 and 536:
ANUÁRIO ESTATÍSTICO DO BRASIL - 2
- Page 537 and 538:
ANUÁRIO ESTATÍSTICO DO BRASIL - 2
- Page 539 and 540:
ANUÁRIO ESTATÍSTICO DO BRASIL - 2
- Page 541 and 542:
ANUÁRIO ESTATÍSTICO DO BRASIL - 2
- Page 543 and 544:
ANUÁRIO ESTATÍSTICO DO BRASIL - 2
- Page 545 and 546:
ANUÁRIO ESTATÍSTICO DO BRASIL - 2
- Page 547 and 548:
ANUÁRIO ESTATÍSTICO DO BRASIL - 2
- Page 549 and 550:
ANUÁRIO ESTATÍSTICO DO BRASIL - 2
- Page 551 and 552:
ANUÁRIO ESTATÍSTICO DO BRASIL - 2
- Page 553 and 554:
ANUÁRIO ESTATÍSTICO DO BRASIL - 2
- Page 555 and 556:
ANUÁRIO ESTATÍSTICO DO BRASIL - 2
- Page 557 and 558:
ANUÁRIO ESTATÍSTICO DO BRASIL - 2
- Page 559 and 560:
ANUÁRIO ESTATÍSTICO DO BRASIL - 2
- Page 561 and 562:
ANUÁRIO ESTATÍSTICO DO BRASIL - 2
- Page 563 and 564:
ANUÁRIO ESTATÍSTICO DO BRASIL - 2
- Page 565 and 566:
ANUÁRIO ESTATÍSTICO DO BRASIL - 2
- Page 567 and 568:
ANUÁRIO ESTATÍSTICO DO BRASIL - 2
- Page 569 and 570:
ANUÁRIO ESTATÍSTICO DO BRASIL - 2
- Page 571 and 572:
ANUÁRIO ESTATÍSTICO DO BRASIL - 2
- Page 573 and 574:
ANUÁRIO ESTATÍSTICO DO BRASIL - 2
- Page 575 and 576:
ANUÁRIO ESTATÍSTICO DO BRASIL - 2
- Page 577 and 578:
ANUÁRIO ESTATÍSTICO DO BRASIL - 2
- Page 579 and 580:
ANUÁRIO ESTATÍSTICO DO BRASIL - 2
- Page 581 and 582:
Indústria da Construção
- Page 583 and 584:
DADOS GERAIS ANUÁRIO ESTATÍSTICO
- Page 585 and 586:
DADOS GERAIS ANUÁRIO ESTATÍSTICO
- Page 587 and 588:
Energia As informações divulgadas
- Page 589 and 590:
ANUÁRIO ESTATÍSTICO DO BRASIL - 2
- Page 591 and 592:
ANUÁRIO ESTATÍSTICO DO BRASIL - 2
- Page 593 and 594:
ANUÁRIO ESTATÍSTICO DO BRASIL - 2
- Page 595 and 596:
ANUÁRIO ESTATÍSTICO DO BRASIL - 2
- Page 597 and 598:
ANUÁRIO ESTATÍSTICO DO BRASIL - 2
- Page 599 and 600:
Indicadores Conjunturais da Indúst
- Page 601 and 602: INDICADORES CONJUNTURAIS DA INDÚST
- Page 603 and 604: PRODUÇÃO FÍSICA ANUÁRIO ESTATÍ
- Page 605 and 606: PRODUÇÃO FÍSICA ANUÁRIO ESTATÍ
- Page 607 and 608: PRODUÇÃO FÍSICA ANUÁRIO ESTATÍ
- Page 609 and 610: EMPREGO, SALÁRIO E VALOR DA PRODU
- Page 611 and 612: EMPREGO, SALÁRIO E VALOR DA PRODU
- Page 613 and 614: EMPREGO, SALÁRIO E VALOR DA PRODU
- Page 615 and 616: Propriedade Industrial A Propriedad
- Page 617 and 618: Glossário centros de transformaç
- Page 619 and 620: ANUÁRIO ESTATÍSTICO DO BRASIL - 2
- Page 621 and 622: Bibliografia ANUÁRIO DA INDÚSTRIA
- Page 623 and 624: SUMÁRIO DAS SEÇÕES ANUÁRIO ESTA
- Page 625 and 626: SUMÁRIO DAS SEÇÕES ANUÁRIO ESTA
- Page 627 and 628: Seção Aspectos da Atividade Servi
- Page 629 and 630: Comércio
- Page 631 and 632: COMÉRCIO ANUÁRIO ESTATÍSTICO DO
- Page 633 and 634: ASPECTOS ESTRUTURAIS DO COMÉRCIO A
- Page 635 and 636: ASPECTOS ESTRUTURAIS DO COMÉRCIO A
- Page 637 and 638: INDICADORES CONJUNTURAIS DO COMÉRC
- Page 639 and 640: INDICADORES CONJUNTURAIS DO COMÉRC
- Page 641 and 642: INDICADORES CONJUNTURAIS DO COMÉRC
- Page 643 and 644: INDICADORES CONJUNTURAIS DO COMÉRC
- Page 645 and 646: INDICADORES CONJUNTURAIS DO COMÉRC
- Page 647 and 648: INDICADORES CONJUNTURAIS DO COMÉRC
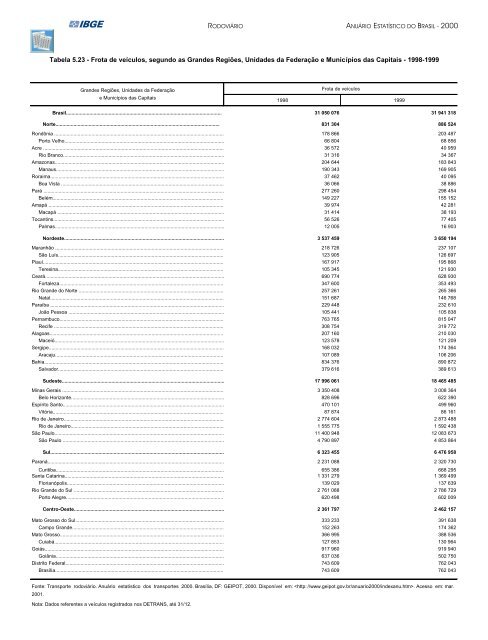
- Page 649 and 650: Transportes As estatísticas relati
- Page 651: ANUÁRIO ESTATÍSTICO DO BRASIL - 2
- Page 655 and 656: ANUÁRIO ESTATÍSTICO DO BRASIL - 2
- Page 657 and 658: ANUÁRIO ESTATÍSTICO DO BRASIL - 2
- Page 659 and 660: ANUÁRIO ESTATÍSTICO DO BRASIL - 2
- Page 661 and 662: ANUÁRIO ESTATÍSTICO DO BRASIL - 2
- Page 663 and 664: ANUÁRIO ESTATÍSTICO DO BRASIL - 2
- Page 665 and 666: ANUÁRIO ESTATÍSTICO DO BRASIL - 2
- Page 667 and 668: ANUÁRIO ESTATÍSTICO DO BRASIL - 2
- Page 669 and 670: ANUÁRIO ESTATÍSTICO DO BRASIL - 2
- Page 671 and 672: ANUÁRIO ESTATÍSTICO DO BRASIL - 2
- Page 673 and 674: ANUÁRIO ESTATÍSTICO DO BRASIL - 2
- Page 675 and 676: ANUÁRIO ESTATÍSTICO DO BRASIL - 2
- Page 677 and 678: Comunicações O tema está estrutu
- Page 679 and 680: ANUÁRIO ESTATÍSTICO DO BRASIL - 2
- Page 681 and 682: ANUÁRIO ESTATÍSTICO DO BRASIL - 2
- Page 683 and 684: ANUÁRIO ESTATÍSTICO DO BRASIL - 2
- Page 685 and 686: Outros Serviços
- Page 687 and 688: DADOS GERAIS ANUÁRIO ESTATÍSTICO
- Page 689 and 690: DADOS GERAIS ANUÁRIO ESTATÍSTICO
- Page 691 and 692: DADOS GERAIS ANUÁRIO ESTATÍSTICO
- Page 693 and 694: TURISMO ANUÁRIO ESTATÍSTICO DO BR
- Page 695 and 696: SEGUROS ANUÁRIO ESTATÍSTICO DO BR
- Page 697 and 698: Bibliografia ANUÁRIO DO TRANSPORTE
- Page 699 and 700: SUMÁRIO DAS SEÇÕES ANUÁRIO ESTA
- Page 701 and 702: Índices, Preços, Custos e Salári
- Page 703 and 704:
ÍNDICES, PREÇOS, CUSTOS E SALÁRI
- Page 705 and 706:
Índices O tema Índices está divi
- Page 707 and 708:
ANUÁRIO ESTATÍSTICO DO BRASIL - 2
- Page 709 and 710:
ANUÁRIO ESTATÍSTICO DO BRASIL - 2
- Page 711 and 712:
ANUÁRIO ESTATÍSTICO DO BRASIL - 2
- Page 713 and 714:
ANUÁRIO ESTATÍSTICO DO BRASIL - 2
- Page 715 and 716:
ANUÁRIO ESTATÍSTICO DO BRASIL - 2
- Page 717 and 718:
ANUÁRIO ESTATÍSTICO DO BRASIL - 2
- Page 719 and 720:
ANUÁRIO ESTATÍSTICO DO BRASIL - 2
- Page 721 and 722:
ANUÁRIO ESTATÍSTICO DO BRASIL - 2
- Page 723 and 724:
ANUÁRIO ESTATÍSTICO DO BRASIL - 2
- Page 725 and 726:
ANUÁRIO ESTATÍSTICO DO BRASIL - 2
- Page 727 and 728:
ANUÁRIO ESTATÍSTICO DO BRASIL - 2
- Page 729 and 730:
ANUÁRIO ESTATÍSTICO DO BRASIL - 2
- Page 731 and 732:
ANUÁRIO ESTATÍSTICO DO BRASIL - 2
- Page 733 and 734:
ANUÁRIO ESTATÍSTICO DO BRASIL - 2
- Page 735 and 736:
ANUÁRIO ESTATÍSTICO DO BRASIL - 2
- Page 737 and 738:
ANUÁRIO ESTATÍSTICO DO BRASIL - 2
- Page 739 and 740:
ANUÁRIO ESTATÍSTICO DO BRASIL - 2
- Page 741 and 742:
ANUÁRIO ESTATÍSTICO DO BRASIL - 2
- Page 743 and 744:
Preços, Custos e Salários Sob est
- Page 745 and 746:
ANUÁRIO ESTATÍSTICO DO BRASIL - 2
- Page 747 and 748:
ANUÁRIO ESTATÍSTICO DO BRASIL - 2
- Page 749 and 750:
ANUÁRIO ESTATÍSTICO DO BRASIL - 2
- Page 751 and 752:
ANUÁRIO ESTATÍSTICO DO BRASIL - 2
- Page 753 and 754:
Glossário custo médio (Sistema Na
- Page 755 and 756:
Bibliografia DOCUMENTO metodológic
- Page 757 and 758:
SUMÁRIO DAS SEÇÕES ANUÁRIO ESTA
- Page 759 and 760:
SUMÁRIO DAS SEÇÕES ANUÁRIO ESTA
- Page 761 and 762:
Seção Agregados Macroeconômicos
- Page 763 and 764:
Finanças Públicas
- Page 765 and 766:
RECEITA E DESPESA DA UNIÃO ANUÁRI
- Page 767 and 768:
RECEITA E DESPESA DA UNIÃO ANUÁRI
- Page 769 and 770:
RECEITA E DESPESA DA UNIÃO ANUÁRI
- Page 771 and 772:
RECEITA E DESPESA DA UNIÃO ANUÁRI
- Page 773 and 774:
RECEITA E DESPESA DA UNIÃO ANUÁRI
- Page 775 and 776:
Administração Federal Neste tema
- Page 777 and 778:
ANUÁRIO ESTATÍSTICO DO BRASIL - 2
- Page 779 and 780:
ANUÁRIO ESTATÍSTICO DO BRASIL - 2
- Page 781 and 782:
Sistema Monetário e Financeiro Nes
- Page 783 and 784:
ANUÁRIO ESTATÍSTICO DO BRASIL - 2
- Page 785 and 786:
ANUÁRIO ESTATÍSTICO DO BRASIL - 2
- Page 787 and 788:
ANUÁRIO ESTATÍSTICO DO BRASIL - 2
- Page 789 and 790:
ANUÁRIO ESTATÍSTICO DO BRASIL - 2
- Page 791 and 792:
ANUÁRIO ESTATÍSTICO DO BRASIL - 2
- Page 793 and 794:
ANUÁRIO ESTATÍSTICO DO BRASIL - 2
- Page 795 and 796:
ANUÁRIO ESTATÍSTICO DO BRASIL - 2
- Page 797 and 798:
ANUÁRIO ESTATÍSTICO DO BRASIL - 2
- Page 799 and 800:
ANUÁRIO ESTATÍSTICO DO BRASIL - 2
- Page 801 and 802:
ANUÁRIO ESTATÍSTICO DO BRASIL - 2
- Page 803 and 804:
ANUÁRIO ESTATÍSTICO DO BRASIL - 2
- Page 805 and 806:
ANUÁRIO ESTATÍSTICO DO BRASIL - 2
- Page 807 and 808:
Setor Externo
- Page 809 and 810:
COMÉRCIO DE MERCADORIAS ANUÁRIO E
- Page 811 and 812:
COMÉRCIO DE MERCADORIAS ANUÁRIO E
- Page 813 and 814:
COMÉRCIO DE MERCADORIAS ANUÁRIO E
- Page 815 and 816:
COMÉRCIO DE MERCADORIAS ANUÁRIO E
- Page 817 and 818:
COMÉRCIO DE MERCADORIAS ANUÁRIO E
- Page 819 and 820:
COMÉRCIO DE MERCADORIAS ANUÁRIO E
- Page 821 and 822:
COMÉRCIO DE MERCADORIAS ANUÁRIO E
- Page 823 and 824:
COMÉRCIO DE MERCADORIAS ANUÁRIO E
- Page 825 and 826:
COMÉRCIO DE MERCADORIAS ANUÁRIO E
- Page 827 and 828:
COMÉRCIO DE MERCADORIAS ANUÁRIO E
- Page 829 and 830:
COMÉRCIO DE MERCADORIAS ANUÁRIO E
- Page 831 and 832:
BALANÇO DE PAGAMENTOS ANUÁRIO EST
- Page 833 and 834:
BALANÇO DE PAGAMENTOS ANUÁRIO EST
- Page 835 and 836:
Contas Nacionais
- Page 837 and 838:
CONTAS NACIONAIS ANUÁRIO ESTATÍST
- Page 839 and 840:
SISTEMA DE CONTAS NACIONAIS ANUÁRI
- Page 841 and 842:
SISTEMA DE CONTAS NACIONAIS ANUÁRI
- Page 843 and 844:
SISTEMA DE CONTAS NACIONAIS ANUÁRI
- Page 845 and 846:
SISTEMA DE CONTAS NACIONAIS ANUÁRI
- Page 847 and 848:
GLOSSÁRIO ANUÁRIO ESTATÍSTICO DO
- Page 849 and 850:
Relação das Fontes Na elaboraçã
- Page 851 and 852:
ANUÁRIO ESTATÍSTICO DO BRASIL - 2