studia universitatis babeÅ-bolyai biologia 2
studia universitatis babeÅ-bolyai biologia 2
studia universitatis babeÅ-bolyai biologia 2

You also want an ePaper? Increase the reach of your titles
YUMPU automatically turns print PDFs into web optimized ePapers that Google loves.
A. SAMUEL, S. KISS, M. ŞANDOR<br />
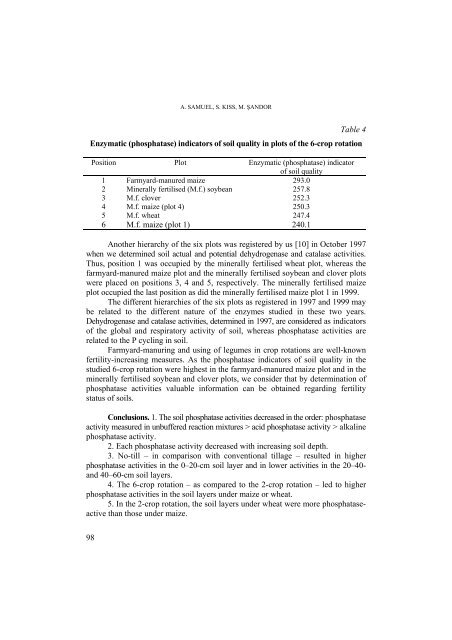
Table 4<br />
Enzymatic (phosphatase) indicators of soil quality in plots of the 6-crop rotation<br />
Position Plot Enzymatic (phosphatase) indicator<br />
of soil quality<br />
1 Farmyard-manured maize 293.0<br />
2 Minerally fertilised (M.f.) soybean 257.8<br />
3 M.f. clover 252.3<br />
4 M.f. maize (plot 4) 250.3<br />
5 M.f. wheat 247.4<br />
6 M.f. maize (plot 1) 240.1<br />
Another hierarchy of the six plots was registered by us [10] in October 1997<br />
when we determined soil actual and potential dehydrogenase and catalase activities.<br />
Thus, position 1 was occupied by the minerally fertilised wheat plot, whereas the<br />
farmyard-manured maize plot and the minerally fertilised soybean and clover plots<br />
were placed on positions 3, 4 and 5, respectively. The minerally fertilised maize<br />
plot occupied the last position as did the minerally fertilised maize plot 1 in 1999.<br />
The different hierarchies of the six plots as registered in 1997 and 1999 may<br />
be related to the different nature of the enzymes studied in these two years.<br />
Dehydrogenase and catalase activities, determined in 1997, are considered as indicators<br />
of the global and respiratory activity of soil, whereas phosphatase activities are<br />
related to the P cycling in soil.<br />
Farmyard-manuring and using of legumes in crop rotations are well-known<br />
fertility-increasing measures. As the phosphatase indicators of soil quality in the<br />
studied 6-crop rotation were highest in the farmyard-manured maize plot and in the<br />
minerally fertilised soybean and clover plots, we consider that by determination of<br />
phosphatase activities valuable information can be obtained regarding fertility<br />
status of soils.<br />
Conclusions. 1. The soil phosphatase activities decreased in the order: phosphatase<br />
activity measured in unbuffered reaction mixtures > acid phosphatase activity > alkaline<br />
phosphatase activity.<br />
2. Each phosphatase activity decreased with increasing soil depth.<br />
3. No-till – in comparison with conventional tillage – resulted in higher<br />
phosphatase activities in the 0–20-cm soil layer and in lower activities in the 20–40-<br />
and 40–60-cm soil layers.<br />
4. The 6-crop rotation – as compared to the 2-crop rotation – led to higher<br />
phosphatase activities in the soil layers under maize or wheat.<br />
5. In the 2-crop rotation, the soil layers under wheat were more phosphataseactive<br />
than those under maize.<br />
98