BULETIN STATISTIC LUNAR MONTHLY STATISTICAL BULLETIN
BULETIN STATISTIC LUNAR MONTHLY STATISTICAL BULLETIN
BULETIN STATISTIC LUNAR MONTHLY STATISTICAL BULLETIN

Create successful ePaper yourself
Turn your PDF publications into a flip-book with our unique Google optimized e-Paper software.
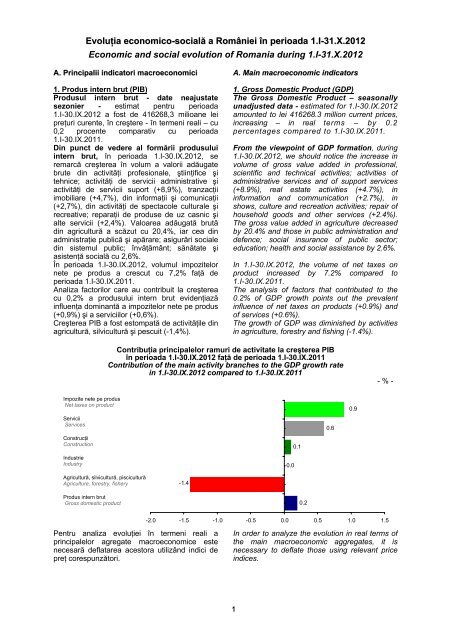
Evoluţia economico-socială a României în perioada 1.I-31.X.2012Economic and social evolution of Romania during 1.I-31.X.2012A. Principalii indicatori macroeconomici1. Produs intern brut (PIB)Produsul intern brut - date neajustatesezonier - estimat pentru perioada1.I-30.IX.2012 a fost de 416268,3 milioane leipreţuri curente, în creştere - în termeni reali – cu0,2 procente comparativ cu perioada1.I-30.IX.2011.Din punct de vedere al formării produsuluiintern brut, în perioada 1.I-30.IX.2012, seremarcă creşterea în volum a valorii adăugatebrute din activităţi profesionale, ştiinţifice şitehnice; activităţi de servicii administrative şiactivităţi de servicii suport (+8,9%), tranzacţiiimobiliare (+4,7%), din informaţii şi comunicaţii(+2,7%), din activităţi de spectacole culturale şirecreative; reparaţii de produse de uz casnic şialte servicii (+2,4%). Valoarea adăugată brutădin agricultură a scăzut cu 20,4%, iar cea dinadministraţie publică şi apărare; asigurări socialedin sistemul public; învăţământ; sănătate şiasistenţă socială cu 2,6%.În perioada 1.I-30.IX.2012, volumul impozitelornete pe produs a crescut cu 7,2% faţă deperioada 1.I-30.IX.2011.Analiza factorilor care au contribuit la creştereacu 0,2% a produsului intern brut evidenţiazăinfluenţa dominantă a impozitelor nete pe produs(+0,9%) şi a serviciilor (+0,6%).Creşterea PIB a fost estompată de activităţile dinagricultură, silvicultură şi pescuit (-1,4%).A. Main macroeconomic indicators1. Gross Domestic Product (GDP)The Gross Domestic Product – seasonallyunadjusted data - estimated for 1.I-30.IX.2012amounted to lei 416268.3 million current prices,increasing – in real terms – by 0.2percentages compared to 1.I-30.IX.2011.From the viewpoint of GDP formation, during1.I-30.IX.2012, we should notice the increase involume of gross value added in professional,scientific and technical activities; activities ofadministrative services and of support services(+8.9%), real estate activities (+4.7%), ininformation and communication (+2.7%), inshows, culture and recreation activities; repair ofhousehold goods and other services (+2.4%).The gross value added in agriculture decreasedby 20.4% and those in public administration anddefence; social insurance of public sector;education; health and social assistance by 2.6%.In 1.I-30.IX.2012, the volume of net taxes onproduct increased by 7.2% compared to1.I-30.IX.2011.The analysis of factors that contributed to the0.2% of GDP growth points out the prevalentinfluence of net taxes on products (+0.9%) andof services (+0.6%).The growth of GDP was diminished by activitiesin agriculture, forestry and fishing (-1.4%).Contribuţia principalelor ramuri de activitate la creşterea PIBîn perioada 1.I-30.IX.2012 faţă de perioada 1.I-30.IX.2011Contribution of the main activity branches to the GDP growth ratein 1.I-30.IX.2012 compared to 1.I-30.IX.2011- % -Impozite nete pe produsNet taxes on productServiciiServicesConstrucţiiConstructionIndustrieIndustry0.00.10.60.9Agricultură, silvicultură, pisciculturăAgriculture, forestry, fishery-1.4Produs intern brutGross domestic product0.2-2.0 -1.5 -1.0 -0.5 0.0 0.5 1.0 1.5Pentru analiza evoluţiei în termeni reali aprincipalelor agregate macroeconomice estenecesară deflatarea acestora utilizând indici depreţ corespunzători.In order to analyze the evolution in real terms ofthe main macroeconomic aggregates, it isnecessary to deflate those using relevant priceindices.1