

Sveriges framtida befolkning 2012–2060
Sveriges framtida befolkning 2012–2060
Sveriges framtida befolkning 2012–2060

Create successful ePaper yourself
Turn your PDF publications into a flip-book with our unique Google optimized e-Paper software.
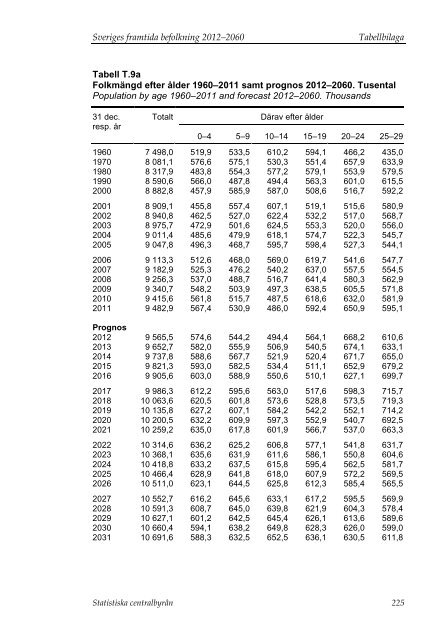
<strong>Sveriges</strong> <strong>framtida</strong> <strong>befolkning</strong> <strong>2012–2060</strong> Tabellbilaga<br />
Tabell T.9a<br />
Folkmängd efter ålder 1960–2011 samt prognos <strong>2012–2060</strong>. Tusental<br />
Population by age 1960–2011 and forecast <strong>2012–2060</strong>. Thousands<br />
31 dec.<br />
resp. år<br />
Totalt Därav efter ålder<br />
0–4 5–9 10–14 15–19 20–24 25–29<br />
1960 7 498,0 519,9 533,5 610,2 594,1 466,2 435,0<br />
1970 8 081,1 576,6 575,1 530,3 551,4 657,9 633,9<br />
1980 8 317,9 483,8 554,3 577,2 579,1 553,9 579,5<br />
1990 8 590,6 566,0 487,8 494,4 563,3 601,0 615,5<br />
2000 8 882,8 457,9 585,9 587,0 508,6 516,7 592,2<br />
2001 8 909,1 455,8 557,4 607,1 519,1 515,6 580,9<br />
2002 8 940,8 462,5 527,0 622,4 532,2 517,0 568,7<br />
2003 8 975,7 472,9 501,6 624,5 553,3 520,0 556,0<br />
2004 9 011,4 485,6 479,9 618,1 574,7 522,3 545,7<br />
2005 9 047,8 496,3 468,7 595,7 598,4 527,3 544,1<br />
2006 9 113,3 512,6 468,0 569,0 619,7 541,6 547,7<br />
2007 9 182,9 525,3 476,2 540,2 637,0 557,5 554,5<br />
2008 9 256,3 537,0 488,7 516,7 641,4 580,3 562,9<br />
2009 9 340,7 548,2 503,9 497,3 638,5 605,5 571,8<br />
2010 9 415,6 561,8 515,7 487,5 618,6 632,0 581,9<br />
2011 9 482,9 567,4 530,9 486,0 592,4 650,9 595,1<br />
Prognos<br />
2012 9 565,5 574,6 544,2 494,4 564,1 668,2 610,6<br />
2013 9 652,7 582,0 555,9 506,9 540,5 674,1 633,1<br />
2014 9 737,8 588,6 567,7 521,9 520,4 671,7 655,0<br />
2015 9 821,3 593,0 582,5 534,4 511,1 652,9 679,2<br />
2016 9 905,6 603,0 588,9 550,6 510,1 627,1 699,7<br />
2017 9 986,3 612,2 595,6 563,0 517,6 598,3 715,7<br />
2018 10 063,6 620,5 601,8 573,6 528,8 573,5 719,3<br />
2019 10 135,8 627,2 607,1 584,2 542,2 552,1 714,2<br />
2020 10 200,5 632,2 609,9 597,3 552,9 540,7 692,5<br />
2021 10 259,2 635,0 617,8 601,9 566,7 537,0 663,3<br />
2022 10 314,6 636,2 625,2 606,8 577,1 541,8 631,7<br />
2023 10 368,1 635,6 631,9 611,6 586,1 550,8 604,6<br />
2024 10 418,8 633,2 637,5 615,8 595,4 562,5 581,7<br />
2025 10 466,4 628,9 641,8 618,0 607,9 572,2 569,5<br />
2026 10 511,0 623,1 644,5 625,8 612,3 585,4 565,5<br />
2027 10 552,7 616,2 645,6 633,1 617,2 595,5 569,9<br />
2028 10 591,3 608,7 645,0 639,8 621,9 604,3 578,4<br />
2029 10 627,1 601,2 642,5 645,4 626,1 613,6 589,6<br />
2030 10 660,4 594,1 638,2 649,8 628,3 626,0 599,0<br />
2031 10 691,6 588,3 632,5 652,5 636,1 630,5 611,8<br />
Statistiska centralbyrån 225