Tabellbilaga <strong>Sveriges</strong> <strong>framtida</strong> <strong>befolkning</strong> <strong>2012–2060</strong> Tabell T.9b (forts.) 31 dec. resp. år Därav efter ålder 65–69 70–74 75–79 80–84 85–89 90–94 95–99 100+ Kvinnor 2030 300,0 262,3 239,5 225,3 154,0 62,4 16,5 2,6 2031 308,9 262,5 240,7 220,1 163,2 64,8 17,0 2,6 2032 315,5 264,2 241,9 215,9 169,1 69,0 17,7 2,7 2033 317,3 268,9 242,1 212,3 172,2 74,6 18,6 2,7 2034 312,0 278,1 243,4 209,3 172,3 80,8 19,5 2,7 2035 307,9 287,2 243,6 209,0 170,3 86,8 20,2 2,7 2036 305,4 295,8 244,0 210,5 166,8 92,0 21,1 2,9 2037 303,3 302,2 245,8 211,9 164,2 95,4 22,7 3,0 2038 302,8 304,0 250,4 212,4 162,1 97,3 24,9 3,1 2039 305,4 299,0 259,3 213,9 160,4 97,6 27,1 3,3 2040 304,5 295,2 268,1 214,4 160,8 96,7 29,2 3,4 2041 300,1 292,9 276,3 215,2 162,5 95,0 30,8 3,6 2042 294,9 291,0 282,5 217,1 164,1 94,0 31,9 3,9 2043 290,0 290,6 284,2 221,6 165,0 93,4 32,6 4,2 2044 286,1 293,2 279,7 230,0 166,5 93,0 32,8 4,6 2045 285,6 292,4 276,3 238,2 167,4 93,8 32,5 5,0 2046 286,0 288,2 274,3 245,8 168,5 95,1 32,0 5,2 2047 287,0 283,3 272,8 251,5 170,6 96,6 31,8 5,4 2048 288,5 278,7 272,6 253,2 174,8 97,5 31,9 5,6 2049 289,3 275,0 275,2 249,4 182,1 98,7 32,0 5,6 2050 291,1 274,6 274,6 246,7 189,2 99,6 32,5 5,6 2051 295,2 275,0 270,7 245,3 195,6 100,7 33,1 5,5 2052 300,4 276,1 266,3 244,3 200,4 102,6 33,8 5,5 2053 308,4 277,6 262,0 244,5 202,0 105,7 34,3 5,6 2054 316,8 278,5 258,7 247,1 199,2 111,0 34,8 5,6 2055 326,2 280,3 258,5 246,8 197,5 115,7 35,2 5,7 2056 333,6 284,4 259,1 243,6 197,0 119,9 35,8 5,8 2057 339,0 289,5 260,3 239,8 196,9 123,1 36,8 5,9 2058 339,9 297,4 261,7 236,2 197,6 124,0 38,2 6,0 2059 337,1 305,6 262,7 233,6 200,1 122,5 40,5 6,1 2060 327,4 314,9 264,7 233,7 200,1 121,9 42,4 6,2 236 Statistiska centralbyrån
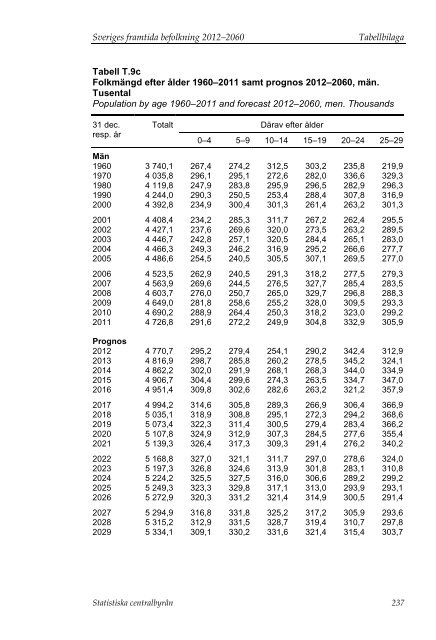
<strong>Sveriges</strong> <strong>framtida</strong> <strong>befolkning</strong> <strong>2012–2060</strong> Tabellbilaga Tabell T.9c Folkmängd efter ålder 1960–2011 samt prognos <strong>2012–2060</strong>, män. Tusental Population by age 1960–2011 and forecast <strong>2012–2060</strong>, men. Thousands 31 dec. resp. år Totalt Därav efter ålder 0–4 5–9 10–14 15–19 20–24 25–29 Män 1960 3 740,1 267,4 274,2 312,5 303,2 235,8 219,9 1970 4 035,8 296,1 295,1 272,6 282,0 336,6 329,3 1980 4 119,8 247,9 283,8 295,9 296,5 282,9 296,3 1990 4 244,0 290,3 250,5 253,4 288,4 307,8 316,9 2000 4 392,8 234,9 300,4 301,3 261,4 263,2 301,3 2001 4 408,4 234,2 285,3 311,7 267,2 262,4 295,5 2002 4 427,1 237,6 269,6 320,0 273,5 263,2 289,5 2003 4 446,7 242,8 257,1 320,5 284,4 265,1 283,0 2004 4 466,3 249,3 246,2 316,9 295,2 266,6 277,7 2005 4 486,6 254,5 240,5 305,5 307,1 269,5 277,0 2006 4 523,5 262,9 240,5 291,3 318,2 277,5 279,3 2007 4 563,9 269,6 244,5 276,5 327,7 285,4 283,5 2008 4 603,7 276,0 250,7 265,0 329,7 296,8 288,3 2009 4 649,0 281,8 258,6 255,2 328,0 309,5 293,3 2010 4 690,2 288,9 264,4 250,3 318,2 323,0 299,2 2011 4 726,8 291,6 272,2 249,9 304,8 332,9 305,9 Prognos 2012 4 770,7 295,2 279,4 254,1 290,2 342,4 312,9 2013 4 816,9 298,7 285,8 260,2 278,5 345,2 324,1 2014 4 862,2 302,0 291,9 268,1 268,3 344,0 334,9 2015 4 906,7 304,4 299,6 274,3 263,5 334,7 347,0 2016 4 951,4 309,8 302,6 282,6 263,2 321,2 357,9 2017 4 994,2 314,6 305,8 289,3 266,9 306,4 366,9 2018 5 035,1 318,9 308,8 295,1 272,3 294,2 368,6 2019 5 073,4 322,3 311,4 300,5 279,4 283,4 366,2 2020 5 107,8 324,9 312,9 307,3 284,5 277,6 355,4 2021 5 139,3 326,4 317,3 309,3 291,4 276,2 340,2 2022 5 168,8 327,0 321,1 311,7 297,0 278,6 324,0 2023 5 197,3 326,8 324,6 313,9 301,8 283,1 310,8 2024 5 224,2 325,5 327,5 316,0 306,6 289,2 299,2 2025 5 249,3 323,3 329,8 317,1 313,0 293,9 293,1 2026 5 272,9 320,3 331,2 321,4 314,9 300,5 291,4 2027 5 294,9 316,8 331,8 325,2 317,2 305,9 293,6 2028 5 315,2 312,9 331,5 328,7 319,4 310,7 297,8 2029 5 334,1 309,1 330,2 331,6 321,4 315,4 303,7 Statistiska centralbyrån 237
- Page 1 and 2:
Statistiska centralbyrån Statistic
- Page 3 and 4:
DEMOGRAFISKA RAPPORTER 2012:2 Sveri
- Page 5:
Sveriges framtida befolkning 2012-2
- Page 8 and 9:
Innehåll Sveriges framtida befolkn
- Page 10 and 11:
Innehåll Sveriges framtida befolkn
- Page 12 and 13:
10 Statistiska centralbyrån
- Page 14 and 15:
Sammanfattning Sveriges framtida be
- Page 16 and 17:
14 Statistiska centralbyrån
- Page 18 and 19:
Inledning Sveriges framtida befolkn
- Page 20 and 21:
Den framtida befolkningen Sveriges
- Page 22 and 23:
Den framtida befolkningen Sveriges
- Page 24 and 25:
Den framtida befolkningen Sveriges
- Page 26 and 27:
Den framtida befolkningen Sveriges
- Page 28 and 29:
Den framtida befolkningen Sveriges
- Page 30 and 31:
Den framtida befolkningen Sveriges
- Page 32 and 33:
Den framtida befolkningen Sveriges
- Page 34 and 35:
Den framtida befolkningen Sveriges
- Page 36 and 37:
Den framtida befolkningen Sveriges
- Page 38 and 39:
Den framtida befolkningen Sveriges
- Page 40 and 41:
38 Statistiska centralbyrån
- Page 42 and 43:
Antaganden om fruktsamhet Sveriges
- Page 44 and 45:
Antaganden om fruktsamhet Sveriges
- Page 46 and 47:
Antaganden om fruktsamhet Sveriges
- Page 48 and 49:
Antaganden om fruktsamhet Sveriges
- Page 50 and 51:
Antaganden om fruktsamhet Sveriges
- Page 52 and 53:
Antaganden om fruktsamhet Sveriges
- Page 54 and 55:
Antaganden om fruktsamhet Sveriges
- Page 56 and 57:
Antaganden om fruktsamhet Sveriges
- Page 58 and 59:
Antaganden om fruktsamhet Sveriges
- Page 60 and 61:
Antaganden om fruktsamhet Sveriges
- Page 62 and 63:
Antaganden om fruktsamhet Sveriges
- Page 64 and 65:
Antaganden om fruktsamhet Sveriges
- Page 66 and 67:
Antaganden om fruktsamhet Sveriges
- Page 68 and 69:
Antaganden om fruktsamhet Sveriges
- Page 70 and 71:
Antaganden om fruktsamhet Sveriges
- Page 72 and 73:
Antaganden om fruktsamhet Sveriges
- Page 74 and 75:
Antaganden om migration Sveriges fr
- Page 76 and 77:
Antaganden om migration Sveriges fr
- Page 78 and 79:
Antaganden om migration Sveriges fr
- Page 80 and 81:
Antaganden om migration Sveriges fr
- Page 82 and 83:
Antaganden om migration Sveriges fr
- Page 84 and 85:
Antaganden om migration Sveriges fr
- Page 86 and 87:
Antaganden om migration Sveriges fr
- Page 88 and 89:
Antaganden om migration Sveriges fr
- Page 90 and 91:
Antaganden om migration Sveriges fr
- Page 92 and 93:
Antaganden om migration Sveriges fr
- Page 94 and 95:
Antaganden om migration Sveriges fr
- Page 96 and 97:
Antaganden om migration Sveriges fr
- Page 98 and 99:
Antaganden om migration Sveriges fr
- Page 100 and 101:
Antaganden om migration Sveriges fr
- Page 102 and 103:
Antaganden om migration Sveriges fr
- Page 104 and 105:
Antaganden om migration Sveriges fr
- Page 106 and 107:
Antaganden om migration Sveriges fr
- Page 108 and 109:
Antaganden om migration Sveriges fr
- Page 110 and 111:
Antaganden om migration Sveriges fr
- Page 112 and 113:
Antaganden om migration Sveriges fr
- Page 114 and 115:
Antaganden om dödlighet Sveriges f
- Page 116 and 117:
Antaganden om dödlighet Sveriges f
- Page 118 and 119:
Antaganden om dödlighet Sveriges f
- Page 120 and 121:
Antaganden om dödlighet Sveriges f
- Page 122 and 123:
Antaganden om dödlighet Sveriges f
- Page 124 and 125:
Antaganden om dödlighet Sveriges f
- Page 126 and 127:
Antaganden om dödlighet Sveriges f
- Page 128 and 129:
Antaganden om dödlighet Sveriges f
- Page 130 and 131:
Antaganden om dödlighet Sveriges f
- Page 132 and 133:
Antaganden om dödlighet Sveriges f
- Page 134 and 135:
Antaganden om dödlighet Sveriges f
- Page 136 and 137:
134 Statistiska centralbyrån
- Page 138 and 139:
Jämförelse med Eurostats prognos
- Page 140 and 141:
Jämförelse med Eurostats prognos
- Page 142 and 143:
Jämförelse med Eurostats prognos
- Page 144 and 145:
142 Statistiska centralbyrån
- Page 146 and 147:
Jämförelse med Prognos 2009 Sveri
- Page 148 and 149:
Jämförelse med Prognos 2009 Sveri
- Page 150 and 151:
148 Statistiska centralbyrån
- Page 152 and 153:
Prognoser med alternativa antagande
- Page 154 and 155:
Prognoser med alternativa antagande
- Page 156 and 157:
Prognoser med alternativa antagande
- Page 158 and 159:
Prognoser med alternativa antagande
- Page 160 and 161:
Prognoser med alternativa antagande
- Page 162 and 163:
Prognoser med alternativa antagande
- Page 164 and 165:
Prognoser med alternativa antagande
- Page 166 and 167:
Tidigare prognoser Sveriges framtid
- Page 168 and 169:
Tidigare prognoser Sveriges framtid
- Page 170 and 171:
Tidigare prognoser Sveriges framtid
- Page 172 and 173:
Tidigare prognoser Sveriges framtid
- Page 174 and 175:
Tidigare prognoser Sveriges framtid
- Page 176 and 177:
Tidigare prognoser Sveriges framtid
- Page 178 and 179:
Fakta om statistiken Sveriges framt
- Page 180 and 181:
Fakta om statistiken Sveriges framt
- Page 182 and 183:
Fakta om statistiken Sveriges framt
- Page 184 and 185:
Fakta om statistiken Sveriges framt
- Page 186 and 187:
Fakta om statistiken Sveriges framt
- Page 188 and 189: Fakta om statistiken Sveriges framt
- Page 190 and 191: Fakta om statistiken Sveriges framt
- Page 192 and 193: Fakta om statistiken Sveriges framt
- Page 194 and 195: Fakta om statistiken Sveriges framt
- Page 196 and 197: Fakta om statistiken Sveriges framt
- Page 198 and 199: Fakta om statistiken Sveriges framt
- Page 200 and 201: Referenser Sveriges framtida befolk
- Page 202 and 203: Referenser Sveriges framtida befolk
- Page 204 and 205: 202 Statistiska centralbyrån
- Page 206 and 207: Bilaga 2 Sveriges framtida befolkni
- Page 208 and 209: 206 Statistiska centralbyrån
- Page 210 and 211: Bilaga 3 Sveriges framtida befolkni
- Page 212 and 213: Bilaga 4 Sveriges framtida befolkni
- Page 214 and 215: Tabellbilaga Sveriges framtida befo
- Page 216 and 217: Tabellbilaga Sveriges framtida befo
- Page 218 and 219: Tabellbilaga Sveriges framtida befo
- Page 220 and 221: Tabellbilaga Sveriges framtida befo
- Page 222 and 223: Tabellbilaga Sveriges framtida befo
- Page 224 and 225: Tabellbilaga Sveriges framtida befo
- Page 226 and 227: Tabellbilaga Sveriges framtida befo
- Page 228 and 229: Tabellbilaga Sveriges framtida befo
- Page 230 and 231: Tabellbilaga Sveriges framtida befo
- Page 232 and 233: Tabellbilaga Sveriges framtida befo
- Page 234 and 235: Tabellbilaga Sveriges framtida befo
- Page 236 and 237: Tabellbilaga Sveriges framtida befo
- Page 240 and 241: Tabellbilaga Sveriges framtida befo
- Page 242 and 243: Tabellbilaga Sveriges framtida befo
- Page 244 and 245: Tabellbilaga Sveriges framtida befo
- Page 246 and 247: Tabellbilaga Sveriges framtida befo
- Page 248 and 249: Tabellbilaga Sveriges framtida befo
- Page 250 and 251: Tabellbilaga Sveriges framtida befo
- Page 252 and 253: Tabellbilaga Sveriges framtida befo
- Page 254 and 255: Tabellbilaga Sveriges framtida befo
- Page 256 and 257: Tabellbilaga Sveriges framtida befo
- Page 258 and 259: Tabellbilaga Sveriges framtida befo
- Page 260 and 261: 258 Statistiska centralbyrån
- Page 262 and 263: In English The future population of
- Page 264 and 265: In English The future population of
- Page 266: In English The future population of