Sammenfatning Tabel 1.4: Udvikling i danskeres forbrug af alkoholholdige drikkevarer 2001-2009 Øl Vin Spiritus I alt Dansk salg: Mio. liter ren alkohol 2001 25,0 20,4 6,1 51,4 2002 24,5 19,6 6,2 50,2 2003 25,2 19,8 6,8 51,9 2004 23,0 19,3 8,1 50,5 2005 22,4 19,9 8,1 50,4 2006 21,8 20,0 8,1 49,8 2007 21,2 20,2 8,1 49,5 2008 20,2 20,8 7,8 48,8 2009 skøn Grænsehandel: 18,4 20,4 7,1 45,9 2001 5,2 3,3 2,6 11,1 2002 5,5 3,4 3,1 12,0 2003 1) 5,9 3,6 3,1 12,6 2004 6,1 2,9 2,9 11,9 2005 5,9 2,4 2,5 10,8 2006 5,3 2,4 2,2 9,9 2007 3,9 2,4 2,0 8,3 2008 3,9 2,4 1,8 8,1 2009 skøn Salg til udlændinge: 3,9 2,4 1,8 8,1 2001 1,6 1,2 0,7 3,5 2002 1,6 1,2 0,7 3,5 2003 1,9 1,5 1,2 4,6 2004 1,9 1,5 1,6 5,0 2005 1,4 1,3 1,4 4,1 2006 1,4 1,2 1,3 3,9 2007 0,9 1,0 1,2 3,1 2008 0,9 1,0 1,2 3,1 2009 skøn Danskeres forbrug: 0,7 0,7 1,1 2,5 2001 28,5 22,5 8,0 59,0 2002 28,4 21,8 8,5 58,7 2003 29,3 21,9 8,7 59,9 2004 27,3 20,7 9,5 57,4 2005 26,9 21,0 9,2 57,1 2006 25,8 21,2 9,0 55,9 2007 24,2 21,6 8,9 54,7 2008 23,2 22,3 8,4 53,9 2009 skøn 21,6 22,1 7,8 51,5 1) Fra og med 2003 omfatter <strong>grænsehandel</strong> med øl også ulovlige indførsler. Kilde: <strong>Skatteministeriet</strong>s opgørelse <strong>over</strong> det afgiftspligtige salg samt skøn for <strong>grænsehandel</strong> mv., jf. kapitel 5, omregnet til ren alkohol. - 19 -
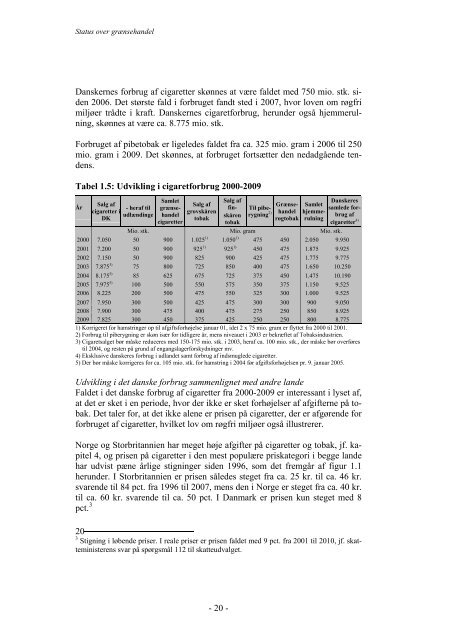
<strong>Status</strong> <strong>over</strong> <strong>grænsehandel</strong> Danskernes forbrug af cigaretter skønnes at være faldet med 750 mio. stk. siden 2006. Det største fald i forbruget fandt sted i 2007, hvor loven om røgfri miljøer trådte i kraft. Danskernes cigaretforbrug, herunder også hjemmerulning, skønnes at være ca. 8.775 mio. stk. Forbruget af pibetobak er ligeledes faldet fra ca. 325 mio. gram i 2006 til 250 mio. gram i 2009. Det skønnes, at forbruget fortsætter den nedadgående tendens. Tabel 1.5: Udvikling i cigaretforbrug 2000-2009 År Salg af cigaretter i DK - heraf til udlændinge Samlet <strong>grænsehandel</strong> cigaretter Salg af grovskåren tobak Salg af fin- skåren tobak Til piberygning 2) Grænse- handel røgtobak Samlet hjemmerulning Danskeres samlede forbrug af cigaretter 4) Mio. stk. Mio. gram Mio. stk. 2000 7.050 50 900 1.025 1) 1.050 1) 475 450 2.050 9.950 2001 7.200 50 900 925 1) 925 1) 450 475 1.875 9.925 2002 7.150 50 900 825 900 425 475 1.775 9.775 2003 7.875 3) 75 800 725 850 400 475 1.650 10.250 2004 8.175 5) 85 625 675 725 375 450 1.475 10.190 2005 7.975 5) 100 500 550 575 350 375 1.150 9.525 2006 8.225 200 500 475 550 325 300 1.000 9.525 2007 7.950 300 500 425 475 300 300 900 9.050 2008 7.900 300 475 400 475 275 250 850 8.925 2009 7.825 300 450 375 425 250 250 800 8.775 1) Korrigeret for hamstringer op til afgiftsforhøjelse januar 01, idet 2 x 75 mio. gram er flyttet fra 2000 til 2001. 2) Forbrug til piberygning er skøn især for tidligere år, mens niveauet i 2003 er bekræftet af Tobaksindustrien. 3) Cigaretsalget bør måske reduceres med 150-175 mio. stk. i 2003, heraf ca. 100 mio. stk., der måske bør <strong>over</strong>føres til 2004, og resten på grund af engangslagerforskydninger mv. 4) Eksklusive danskeres forbrug i udlandet samt forbrug af indsmuglede cigaretter. 5) Der bør måske korrigeres for ca. 105 mio. stk. for hamstring i 2004 før afgiftsforhøjelsen pr. 9. januar 2005. Udvikling i det danske forbrug sammenlignet med andre lande Faldet i det danske forbrug af cigaretter fra 2000-2009 er interessant i lyset af, at det er sket i en periode, hvor der ikke er sket forhøjelser af afgifterne på tobak. Det taler for, at det ikke alene er prisen på cigaretter, der er afgørende for forbruget af cigaretter, hvilket lov om røgfri miljøer også illustrerer. Norge og Storbritannien har meget høje afgifter på cigaretter og tobak, jf. kapitel 4, og prisen på cigaretter i den mest populære priskategori i begge lande har udvist pæne årlige stigninger siden 1996, som det fremgår af figur 1.1 herunder. I Storbritannien er prisen således steget fra ca. 25 kr. til ca. 46 kr. svarende til 84 pct. fra 1996 til 2007, mens den i Norge er steget fra ca. 40 kr. til ca. 60 kr. svarende til ca. 50 pct. I Danmark er prisen kun steget med 8 pct. 3 20 3 Stigning i løbende priser. I reale priser er prisen faldet med 9 pct. fra 2001 til 2010, jf. skatteministerens svar på spørgsmål 112 til skatteudvalget. - 20 -
- Page 1 and 2: Status over grænsehandel Maj 2010
- Page 3 and 4: Status over grænsehandel Udgiver:
- Page 5 and 6: Status over grænsehandel 2.2 Røgt
- Page 8: Indledning - 7 - Indledning Denne s
- Page 11 and 12: Status over grænsehandel 2. Elemen
- Page 13 and 14: Status over grænsehandel Vin har v
- Page 15 and 16: Status over grænsehandel Er der de
- Page 17 and 18: Status over grænsehandel Tabel 1.3
- Page 19: Status over grænsehandel 3 gange h
- Page 23 and 24: Status over grænsehandel Ser man i
- Page 25 and 26: Status over grænsehandel Som det f
- Page 28 and 29: Påvirkninger af grænsehandlen fra
- Page 30 and 31: Påvirkninger af grænsehandlen fra
- Page 32 and 33: Påvirkninger af grænsehandlen fra
- Page 34 and 35: Påvirkninger af grænsehandlen fra
- Page 36 and 37: Påvirkninger af grænsehandlen fra
- Page 38 and 39: Påvirkninger af grænsehandlen fra
- Page 40 and 41: Påvirkninger af grænsehandlen fra
- Page 42 and 43: Påvirkninger af grænsehandlen fra
- Page 44 and 45: Påvirkninger af grænsehandlen fra
- Page 46 and 47: Udvikling i det afgiftspligtige sal
- Page 48 and 49: Udvikling i det afgiftspligtige sal
- Page 50 and 51: Udvikling i det afgiftspligtige sal
- Page 52 and 53: Tabel 3.3: Udvikling i tobaksafgift
- Page 54 and 55: Udvikling i det afgiftspligtige sal
- Page 56 and 57: Tabel 3.5: Udvikling i påsatte ste
- Page 58 and 59: Tabel 3.7: Provenu fra salg af øl,
- Page 60 and 61: Udvikling i det afgiftspligtige sal
- Page 62 and 63: Udvikling i det afgiftspligtige sal
- Page 64 and 65: Tabel 3.13: Udvikling i salget af v
- Page 66 and 67: Udvikling i det afgiftspligtige sal
- Page 68 and 69: Udvikling i det afgiftspligtige sal
- Page 70 and 71:
Udvikling i det afgiftspligtige sal
- Page 72 and 73:
Udvikling i det afgiftspligtige sal
- Page 74:
- 73 - Udvikling i det afgiftspligt
- Page 77 and 78:
Status over grænsehandel Tabel 4.1
- Page 79 and 80:
Status over grænsehandel type spir
- Page 81 and 82:
Status over grænsehandel Red i 200
- Page 83 and 84:
Status over grænsehandel lemslande
- Page 85 and 86:
Status over grænsehandel Tabel 4.7
- Page 87 and 88:
Status over grænsehandel Danskerne
- Page 89 and 90:
Status over grænsehandel Tabel 4.1
- Page 91 and 92:
Status over grænsehandel 2.2 Røgt
- Page 93 and 94:
Status over grænsehandel Tabel 4.1
- Page 95 and 96:
Status over grænsehandel Den afgif
- Page 97 and 98:
Status over grænsehandel Ligeledes
- Page 99 and 100:
Status over grænsehandel Prisen p
- Page 101 and 102:
Status over grænsehandel Ud fra de
- Page 103 and 104:
Status over grænsehandel Stigninge
- Page 105 and 106:
Status over grænsehandel Cider Der
- Page 107 and 108:
Status over grænsehandel Tabel 4.2
- Page 109 and 110:
Status over grænsehandel Tabel 4.3
- Page 111 and 112:
Status over grænsehandel Der er fo
- Page 113 and 114:
Status over grænsehandel Tabel 4.3
- Page 115 and 116:
Status over grænsehandel Tabel 4.3
- Page 117 and 118:
Status over grænsehandel afgift op
- Page 119 and 120:
Status over grænsehandel zinmarked
- Page 121 and 122:
Status over grænsehandel Tabel 4.4
- Page 123 and 124:
Status over grænsehandel Tabel 4.4
- Page 125 and 126:
Status over grænsehandel Tabel 4.4
- Page 127 and 128:
Status over grænsehandel Tabel 4.4
- Page 129 and 130:
Status over grænsehandel mark mell
- Page 132 and 133:
Kapitel 5. Grænsehandel Grænsehan
- Page 134 and 135:
Grænsehandel Tabel 5.1: Danskeres
- Page 136 and 137:
Grænsehandel Tabel 5.2: Grænsehan
- Page 138 and 139:
1.3 Udlændinges grænsehandel i Da
- Page 140 and 141:
Grænsehandel før. Ved en nærmere
- Page 142 and 143:
Tabel 5.9: Grænsehandel med rullet
- Page 144 and 145:
Grænsehandel Danmark. Dels fordi n
- Page 146 and 147:
Pris for 20 stk. i DKK 70 60 50 40
- Page 148 and 149:
Grænsehandel ved et pludseligt boo
- Page 150 and 151:
Grænsehandel Undersøgelsen viser,
- Page 152 and 153:
Grænsehandel GfK’s ConsumerScan
- Page 154 and 155:
Grænsehandel Tabel 5.14: Opdeling
- Page 156 and 157:
Tabel 5.16: Ølindkøbsvaner i Danm
- Page 158 and 159:
Grænsehandel procenter ved pant-og
- Page 160 and 161:
Tabel 5.20: Sammenligning af skøn
- Page 162 and 163:
Grænsehandel Tabel 5.22: Grænseha
- Page 164 and 165:
Grænsehandel Tabel 5.24: Grænseha
- Page 166 and 167:
Tabel 5.26: Vinindkøbsvaner i Danm
- Page 168 and 169:
Grænsehandel ke for cider, der som
- Page 170 and 171:
Grænsehandel GfK og TNS Gallups in
- Page 172 and 173:
Grænsehandel Særligt i grænselan
- Page 174 and 175:
Grænsehandel Tabel 5.31: Grænseha
- Page 176 and 177:
Tabel 5.33: Sodavand købt i Tyskla
- Page 178 and 179:
Grænsehandel serne ifølge Consume
- Page 180 and 181:
5.2 Illegal handel Grænsehandel P
- Page 182 and 183:
Grænsehandel prisforskellen mellem
- Page 184 and 185:
Grænsehandel ifølge ConsumerScan
- Page 186 and 187:
Grænsehandel Ifølge tabellen oven
- Page 188 and 189:
Grænsehandel Tabel 5.43: Sammenlig
- Page 190 and 191:
Grænsehandel = Forbrug af benzin i
- Page 192 and 193:
Grænsehandel Tabel 5.45: Udvikling
- Page 194 and 195:
Grænsehandel Det beregnede forbrug
- Page 196 and 197:
Grænsehandel Tabel 5.47: Beregnet
- Page 198 and 199:
Grænsehandel Tabel 5.48: Udvikling
- Page 200 and 201:
Grænsehandel Tabel 5.49: Antal tur
- Page 202 and 203:
Grænsehandel danske og udenlandske
- Page 204 and 205:
Grænsehandel ve incitament til at
- Page 206 and 207:
Grænsehandel sel i gennemsnit pr.
- Page 208 and 209:
Grænsehandel Tabel 5.54: Beregnet
- Page 210 and 211:
Grænsehandel Tabel 5.55: Beregnet
- Page 212 and 213:
Grænsehandel Hvis trafikindekset t
- Page 214 and 215:
Grænsehandel særligt når der yde
- Page 216 and 217:
Tabel 5.58: Fordeling af dieselafgi
- Page 218 and 219:
Grænsehandel Tabel 5.59: Grænseha
- Page 220 and 221:
Kapitel 6. Virkninger af afgiftsæn
- Page 222 and 223:
Virkninger af afgiftsændringer Tab
- Page 224 and 225:
Tabel 6.4: Antagelser om priser for
- Page 226 and 227:
Virkninger af afgiftsændringer Tab
- Page 228 and 229:
Virkninger af afgiftsændringer Hvi
- Page 230 and 231:
Virkninger af afgiftsændringer st
- Page 232 and 233:
Virkninger af afgiftsændringer gen
- Page 234 and 235:
Virkninger af afgiftsændringer kom
- Page 236 and 237:
3. Øl Virkninger af afgiftsændrin
- Page 238 and 239:
Virkninger af afgiftsændringer mio
- Page 240 and 241:
5. Sodavand Virkninger af afgiftsæ
- Page 242 and 243:
6. Chokolade Virkninger af afgifts
- Page 244 and 245:
Virkninger af afgiftsændringer Den
- Page 246 and 247:
Virkninger af afgiftsændringer En
- Page 248 and 249:
Virkninger af afgiftsændringer Tab
- Page 250 and 251:
Virkninger af afgiftsændringer En
- Page 252 and 253:
Virkninger af afgiftsændringer Eft
- Page 254 and 255:
Virkninger af afgiftsændringer str
- Page 256 and 257:
Virkninger af afgiftsændringer Sky
- Page 258:
257 - - Virkninger af afgiftsændri
- Page 261 and 262:
Status over grænsehandel HM Revenu