Morgan Stanley Investment Funds* - Skandia
Morgan Stanley Investment Funds* - Skandia
Morgan Stanley Investment Funds* - Skandia

Sie wollen auch ein ePaper? Erhöhen Sie die Reichweite Ihrer Titel.
YUMPU macht aus Druck-PDFs automatisch weboptimierte ePaper, die Google liebt.
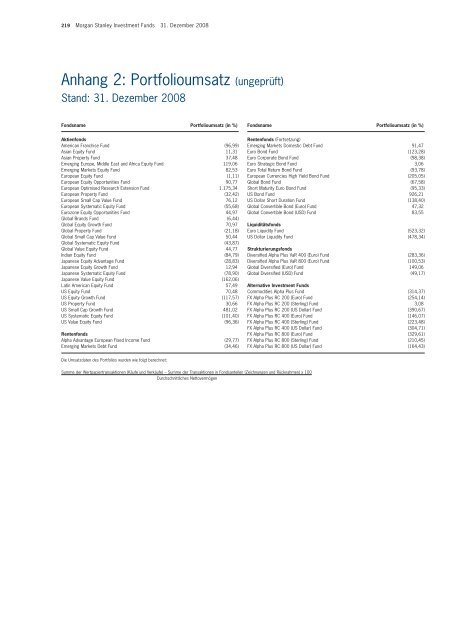
219 <strong>Morgan</strong> <strong>Stanley</strong> <strong>Investment</strong> Funds 31. Dezember 2008<br />
Anhang 2: Portfolioumsatz (ungeprüft)<br />
Stand: 31. Dezember 2008<br />
Fondsname Portfolioumsatz (in %) Fondsname Portfolioumsatz (in %)<br />
Aktienfonds<br />
American Franchise Fund (96,99)<br />
Asian Equity Fund 11,31<br />
Asian Property Fund 37,48<br />
Emerging Europe, Middle East and Africa Equity Fund 119,06<br />
Emerging Markets Equity Fund 82,53<br />
European Equity Fund (1,11)<br />
European Equity Opportunities Fund 90,77<br />
European Optimised Research Extension Fund 1.175,34<br />
European Property Fund (32,42)<br />
European Small Cap Value Fund 76,12<br />
European Systematic Equity Fund (55,68)<br />
Eurozone Equity Opportunities Fund 44,97<br />
Global Brands Fund (6,44)<br />
Global Equity Growth Fund 70,97<br />
Global Property Fund (21,18)<br />
Global Small Cap Value Fund 50,44<br />
Global Systematic Equity Fund (43,87)<br />
Global Value Equity Fund 44,77<br />
Indian Equity Fund (84,79)<br />
Japanese Equity Advantage Fund (28,83)<br />
Japanese Equity Growth Fund 12,94<br />
Japanese Systematic Equity Fund (78,90)<br />
Japanese Value Equity Fund (162,06)<br />
Latin American Equity Fund 57,49<br />
US Equity Fund 70,48<br />
US Equity Growth Fund (117,57)<br />
US Property Fund 30,66<br />
US Small Cap Growth Fund 481,02<br />
US Systematic Equity Fund (101,40)<br />
US Value Equity Fund (96,36)<br />
Rentenfonds<br />
Alpha Advantage European Fixed Income Fund (29,77)<br />
Emerging Markets Debt Fund (34,46)<br />
Die Umsatzdaten des Portfolios wurden wie folgt berechnet:<br />
Summe der Wertpapiertransaktionen (Käufe und Verkäufe) – Summe der Transaktionen in Fondsanteilen (Zeichnungen und Rücknahmen) x 100<br />
Durchschnittliches Nettovermögen<br />
Rentenfonds (Fortsetzung)<br />
Emerging Markets Domestic Debt Fund 91,47<br />
Euro Bond Fund (123,28)<br />
Euro Corporate Bond Fund (98,38)<br />
Euro Strategic Bond Fund 3,06<br />
Euro Total Return Bond Fund (93,78)<br />
European Currencies High Yield Bond Fund (205,05)<br />
Global Bond Fund (67,58)<br />
Short Maturity Euro Bond Fund (95,33)<br />
US Bond Fund 926,21<br />
US Dollar Short Duration Fund (138,40)<br />
Global Convertible Bond (Euro) Fund 47,32<br />
Global Convertible Bond (USD) Fund 83,55<br />
Liquiditätsfonds<br />
Euro Liquidity Fund (523,32)<br />
US Dollar Liquidity Fund (478,34)<br />
Strukturierungsfonds<br />
Diversified Alpha Plus VaR 400 (Euro) Fund (283,36)<br />
Diversified Alpha Plus VaR 800 (Euro) Fund (100,53)<br />
Global Diversified (Euro) Fund 149,06<br />
Global Diversified (USD) Fund (49,17)<br />
Alternative <strong>Investment</strong> Funds<br />
Commodities Alpha Plus Fund (314,37)<br />
FX Alpha Plus RC 200 (Euro) Fund (254,14)<br />
FX Alpha Plus RC 200 (Sterling) Fund 3,08<br />
FX Alpha Plus RC 200 (US Dollar) Fund (390,67)<br />
FX Alpha Plus RC 400 (Euro) Fund (146,07)<br />
FX Alpha Plus RC 400 (Sterling) Fund (223,48)<br />
FX Alpha Plus RC 400 (US Dollar) Fund (304,71)<br />
FX Alpha Plus RC 800 (Euro) Fund (329,61)<br />
FX Alpha Plus RC 800 (Sterling) Fund (210,45)<br />
FX Alpha Plus RC 800 (US Dollar) Fund (164,43)