KWK-Ausbau: Entwicklung, Prognose, Wirksamkeit der ... - BMU
KWK-Ausbau: Entwicklung, Prognose, Wirksamkeit der ... - BMU
KWK-Ausbau: Entwicklung, Prognose, Wirksamkeit der ... - BMU

Erfolgreiche ePaper selbst erstellen
Machen Sie aus Ihren PDF Publikationen ein blätterbares Flipbook mit unserer einzigartigen Google optimierten e-Paper Software.
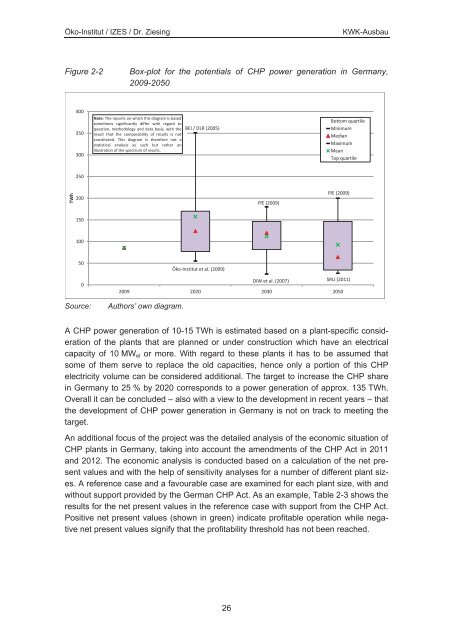
Öko-Institut / IZES / Dr. Ziesing<strong>KWK</strong>-<strong>Ausbau</strong>Figure 2-2Box-plot for the potentials of CHP power generation in Germany,2009-2050400350300Note: The reports on which this diagram is basedsometimes significantly differ with regard toquestion, methodology and data basis, with theresult that the comparability of results is notconstituted. This diagram is therefore not astatistical analysis as such but rather anillustration of the spectrum of results.BEI / DLR (2005)Bottom quartileMinimumMedianMaximumMeanTop quartile250TWh200FfE (2009)FfE (2009)15010050Öko-Institut et al. (2009)0DIW et al. (2007)2009 2020 2030SRU (2011)2050Source:Authors’ own diagram.A CHP power generation of 10-15 TWh is estimated based on a plant-specific consi<strong>der</strong>ationof the plants that are planned or un<strong>der</strong> construction which have an electricalcapacity of 10 MW el or more. With regard to these plants it has to be assumed thatsome of them serve to replace the old capacities, hence only a portion of this CHPelectricity volume can be consi<strong>der</strong>ed additional. The target to increase the CHP sharein Germany to 25 % by 2020 corresponds to a power generation of approx. 135 TWh.Overall it can be concluded – also with a view to the development in recent years – thatthe development of CHP power generation in Germany is not on track to meeting thetarget.An additional focus of the project was the detailed analysis of the economic situation ofCHP plants in Germany, taking into account the amendments of the CHP Act in 2011and 2012. The economic analysis is conducted based on a calculation of the net presentvalues and with the help of sensitivity analyses for a number of different plant sizes.A reference case and a favourable case are examined for each plant size, with andwithout support provided by the German CHP Act. As an example, Table 2-3 shows theresults for the net present values in the reference case with support from the CHP Act.Positive net present values (shown in green) indicate profitable operation while negativenet present values signify that the profitability threshold has not been reached.26