Diploma thesis in Physics submitted by Florian Freundt born in ...
Diploma thesis in Physics submitted by Florian Freundt born in ...
Diploma thesis in Physics submitted by Florian Freundt born in ...

Create successful ePaper yourself
Turn your PDF publications into a flip-book with our unique Google optimized e-Paper software.
4.2. On site measurement of O2, CO2, CH4 and Radon 4 Measur<strong>in</strong>g methods<br />
Mass Spectrometer<br />
noble gas<br />
[ peak heights ]<br />
Mass Spectrometer<br />
calibration gas<br />
[ peak heights ]<br />
Sample<br />
total gas amount<br />
[ mol ]<br />
4.1.4 Result<strong>in</strong>g data<br />
WuCEM<br />
data evaluation<br />
software<br />
Sample<br />
noble gas amount<br />
[ ccSTP ]<br />
Sample<br />
noble gas mix<strong>in</strong>g ratios<br />
[ Vol% ]<br />
Sample<br />
deviation from atm. air<br />
[ % atm. air ]<br />
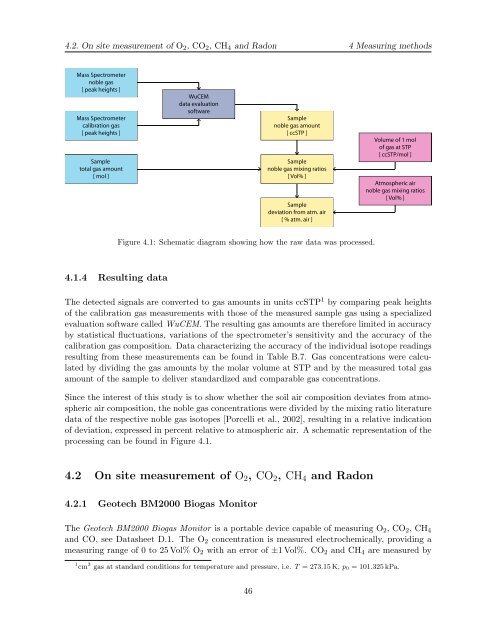
Figure 4.1: Schematic diagram show<strong>in</strong>g how the raw data was processed.<br />
Volume of 1 mol<br />
of gas at STP<br />
[ ccSTP/mol ]<br />
Atmospheric air<br />
noble gas mix<strong>in</strong>g ratios<br />
[ Vol% ]<br />
The detected signals are converted to gas amounts <strong>in</strong> units ccSTP 1 <strong>by</strong> compar<strong>in</strong>g peak heights<br />
of the calibration gas measurements with those of the measured sample gas us<strong>in</strong>g a specialized<br />
evaluation software called WuCEM. The result<strong>in</strong>g gas amounts are therefore limited <strong>in</strong> accuracy<br />
<strong>by</strong> statistical fluctuations, variations of the spectrometer’s sensitivity and the accuracy of the<br />
calibration gas composition. Data characteriz<strong>in</strong>g the accuracy of the <strong>in</strong>dividual isotope read<strong>in</strong>gs<br />
result<strong>in</strong>g from these measurements can be found <strong>in</strong> Table B.7. Gas concentrations were calculated<br />
<strong>by</strong> divid<strong>in</strong>g the gas amounts <strong>by</strong> the molar volume at STP and <strong>by</strong> the measured total gas<br />
amount of the sample to deliver standardized and comparable gas concentrations.<br />
S<strong>in</strong>ce the <strong>in</strong>terest of this study is to show whether the soil air composition deviates from atmospheric<br />
air composition, the noble gas concentrations were divided <strong>by</strong> the mix<strong>in</strong>g ratio literature<br />
data of the respective noble gas isotopes [Porcelli et al., 2002], result<strong>in</strong>g <strong>in</strong> a relative <strong>in</strong>dication<br />
of deviation, expressed <strong>in</strong> percent relative to atmospheric air. A schematic representation of the<br />
process<strong>in</strong>g can be found <strong>in</strong> Figure 4.1.<br />
4.2 On site measurement of O2, CO2, CH4 and Radon<br />
4.2.1 Geotech BM2000 Biogas Monitor<br />
The Geotech BM2000 Biogas Monitor is a portable device capable of measur<strong>in</strong>g O2, CO2, CH4<br />
and CO, see Datasheet D.1. The O2 concentration is measured electrochemically, provid<strong>in</strong>g a<br />
measur<strong>in</strong>g range of 0 to 25 Vol% O2 with an error of ±1 Vol%. CO2 and CH4 are measured <strong>by</strong><br />
1 cm 3 gas at standard conditions for temperature and pressure, i.e. T = 273.15 K, p0 = 101.325 kPa.<br />
46