download pdf - Institut für Umweltphysik - Ruprecht-Karls-Universität ...
download pdf - Institut für Umweltphysik - Ruprecht-Karls-Universität ...
download pdf - Institut für Umweltphysik - Ruprecht-Karls-Universität ...

Create successful ePaper yourself
Turn your PDF publications into a flip-book with our unique Google optimized e-Paper software.
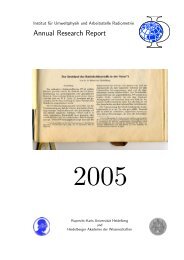
<strong>Institut</strong> <strong>für</strong> <strong>Umweltphysik</strong> und Arbeitsstelle Radiometrie<br />
Annual Research Report<br />
2006<br />
<strong>Ruprecht</strong>-<strong>Karls</strong>-<strong>Universität</strong> Heidelberg<br />
und<br />
Heidelberger Akademie der Wissenschaften
Contents<br />
1 Introduction/Overview of institute 7<br />
2 Atmosphere and Remote Sensing 9<br />
2.1 Tropospheric Research Group . . . . . . . . . . . . . . . . . . . . . . . . . . . . . . . . 13<br />
2.1.1 Long term measurements of reactive halogen species, trace gases and aerosols<br />
by Multi Axis Differential Optical Absorption Spectroscopy (MAX-DOAS) . . 18<br />
2.1.2 DOAS on board: trace gas measurements on CARIBIC flights . . . . . . . . . 19<br />
2.1.3 Airborne Imaging DOAS . . . . . . . . . . . . . . . . . . . . . . . . . . . . . . 20<br />
2.1.4 Auto-MAX DOAS measurements for Tropospheric NO2 in Europe . . . . . . . 21<br />
2.1.5 NOVAC - Network for Detection of Volcanic and Atmospheric Change . . . . . 22<br />
2.1.6 Enhancement and improvement of the DOAS software DOASIS;<br />
Development of the NOVAC database . . . . . . . . . . . . . . . . . . . . . . . 23<br />
2.1.7 Long-Path-DOAS Measurements of VOCs and HOx precursors in Mexico City<br />
during MCMA-2006 . . . . . . . . . . . . . . . . . . . . . . . . . . . . . . . . . 24<br />
2.1.8 Long-Path-DOAS Measurements with new fibre optic set-up . . . . . . . . . . 25<br />
2.1.9 Tomographic LP-DOAS measurements of 2D trace gas distributions in Heidelberg 26<br />
2.1.10 DOAS measurements of iodine oxides in the framework of the MAP project . . 27<br />
2.1.11 Applicability of light-emitting diodes as light sources for active DOAS measurements<br />
. . . . . . . . . . . . . . . . . . . . . . . . . . . . . . . . . . . . . . . . . 28<br />
2.1.12 Multi Axis Differential Optical Absorption Spectroscopy (MAX-DOAS) of Trace<br />
Gas and Aerosol Distributions . . . . . . . . . . . . . . . . . . . . . . . . . . . 29<br />
2.1.13 Third Generation DOAS Telescopes . . . . . . . . . . . . . . . . . . . . . . . . 30<br />
2.1.14 Testing a new Near-IR Sensor for Detection of Methane . . . . . . . . . . . . . 31<br />
2.2 Stratospheric Research Group . . . . . . . . . . . . . . . . . . . . . . . . . . . . . . . . 35<br />
2.2.1 Observational constraints on stratospheric ozone loss cycles . . . . . . . . . . . 39<br />
2.2.2 Is there inorganic gaseous iodine in the tropical UT/LS ? . . . . . . . . . . . . 40<br />
2.2.3 Trend of stratospheric bromine . . . . . . . . . . . . . . . . . . . . . . . . . . . 41<br />
2.2.4 High precision measurement of the UV BrO absorption cross section . . . . . . 42<br />
2.2.5 Photolytic lifetime of stratospheric N2O5 . . . . . . . . . . . . . . . . . . . . . 43<br />
2.2.6 Measurement of upper tropospheric and lower stratospheric radicals by balloonand<br />
aircraft-borne scanning limb DOAS . . . . . . . . . . . . . . . . . . . . . . 44<br />
2.3 Radiative Transfer . . . . . . . . . . . . . . . . . . . . . . . . . . . . . . . . . . . . . . 47<br />
2.3.1 2-D mapping of cloud parameters . . . . . . . . . . . . . . . . . . . . . . . . . . 50<br />
2.3.2 Field measurements of water continuum and water dimer absorption . . . . . . 51<br />
2.3.3 Oxygen A-band measurements for solar photon path length distribution studies 52<br />
2.4 Satellite Group . . . . . . . . . . . . . . . . . . . . . . . . . . . . . . . . . . . . . . . . 55<br />
2.4.1 Satellite observations of Glyoxal . . . . . . . . . . . . . . . . . . . . . . . . . . 59<br />
2.4.2 Development of a Radiative Transfer Forward Model . . . . . . . . . . . . . . . 60<br />
2.4.3 Retrieval of cloud parameters using SCIAMACHY and GOME data . . . . . . 61<br />
2.4.4 Analysis of GOME Observations for Anthropogenic SO2 Emissions over China 62<br />
2.4.5 Vertical OClO and BrO profiles from SCIAMACHY limb measurements . . . . 63<br />
2.4.6 New GOME-Retrieval for Formaldehyde (HCHO) using daily mean Earthshine<br />
Reference . . . . . . . . . . . . . . . . . . . . . . . . . . . . . . . . . . . . . . . 64<br />
2.4.7 Radiative Transfer Modeling by Monte Carlo method for SCIAMACHY limb<br />
geometry in the UV/VIS spectral range . . . . . . . . . . . . . . . . . . . . . . 65<br />
2.4.8 Satellite observations of global water vapor trends 1996 - 2003 . . . . . . . . . 66<br />
2.4.9 MAXDOAS observations on board the research vessel Polarstern . . . . . . . . 67<br />
3
4 CONTENTS<br />
2.4.10 Satellite monitoring of different vegetation types by differential optical absorption<br />
spectroscopy (DOAS) in the red spectral range . . . . . . . . . . . . . . . 68<br />
2.5 MarHal - Modeling of marine and halogen chemistry . . . . . . . . . . . . . . . . . . . 73<br />
2.5.1 Modeling iodide – iodate speciation in atmospheric aerosol . . . . . . . . . . . 76<br />
2.5.2 The Potential Importance of Frost Flowers for Ozone Depletion Events - A<br />
Model Study . . . . . . . . . . . . . . . . . . . . . . . . . . . . . . . . . . . . . 77<br />
2.5.3 Modeling organic surface films on Atmospheric Aerosol Particles and their Influence<br />
on Chemistry . . . . . . . . . . . . . . . . . . . . . . . . . . . . . . . . . 78<br />
2.5.4 Importance of the surface reaction OH + Cl − on sea salt aerosol for the chemistry<br />
of the marine boundary layer - a model study . . . . . . . . . . . . . . . . 79<br />
2.6 Carbon Cycle Group . . . . . . . . . . . . . . . . . . . . . . . . . . . . . . . . . . . . . 81<br />
2.6.1 Top-down assessments of the regional H2 soil sink strength from continuous<br />
atmospheric observations . . . . . . . . . . . . . . . . . . . . . . . . . . . . . . 84<br />
2.6.2 Inferring high-resolution fossil fuel CO2 records at continental sites from combined<br />
14 CO2 and CO observations . . . . . . . . . . . . . . . . . . . . . . . . . 85<br />
2.6.3 Carbon cycle constraints derived from the interhemispheric ∆ 14 C difference . . 86<br />
2.6.4 Investigating the soil sink of molecular Hydrogen (H2) . . . . . . . . . . . . . . 87<br />
2.6.5 Observation of δ 13 C and δD in atmospheric methane and implementation of a<br />
methane module to the GRACE model . . . . . . . . . . . . . . . . . . . . . . 88<br />
3 Terrestrial Systems 91<br />
3.1 Soil Physics . . . . . . . . . . . . . . . . . . . . . . . . . . . . . . . . . . . . . . . . . . 94<br />
3.1.1 Unstable Gravity-driven Fingering Flow in Unsaturated Porous Media . . . . . 97<br />
3.1.2 Novel Evaporation Experiment to Determine Soil Hydraulic Properties . . . . . 98<br />
3.1.3 Physical processes in the capillary fringe . . . . . . . . . . . . . . . . . . . . . . 99<br />
3.1.4 Extension of the Grenzhof test site for conducting hydrogeophysical investigations<br />
of water flow and solute transport at the field scale . . . . . . . . . . . . . 100<br />
3.1.5 Installation of three soil and weather monitoring stations in permafrost soils on<br />
the Qinghai–Tibet Plateau . . . . . . . . . . . . . . . . . . . . . . . . . . . . . 101<br />
3.1.6 Investigation on the applicability of remote sensing in surface moisture studies 102<br />
3.1.7 Simulation of Ground Penetrating Radar Measurements over Multi-Layered Materials<br />
using a Plane Wave Approach . . . . . . . . . . . . . . . . . . . . . . . . 103<br />
3.2 Ice and Climate . . . . . . . . . . . . . . . . . . . . . . . . . . . . . . . . . . . . . . . . 105<br />
3.2.1 Radiocarbon measurement in ice . . . . . . . . . . . . . . . . . . . . . . . . . . 108<br />
3.2.2 Climate significance of stable water isotope records from Alpine ice cores. . . . 109<br />
3.2.3 Dissolved organic carbon (DOC) in glaciers: recent temporal changes and natural<br />
levels . . . . . . . . . . . . . . . . . . . . . . . . . . . . . . . . . . . . . . . 110<br />
3.2.4 Progress in developing novel tools for Antarctic ice core research . . . . . . . . 111<br />
4 Aquatic Systems 115<br />
4.1 Groundwater and Paleoclimate . . . . . . . . . . . . . . . . . . . . . . . . . . . . . . . 118<br />
4.1.1 A tracer study of paleoclimate and groundwater recharge in the North China<br />
Plain . . . . . . . . . . . . . . . . . . . . . . . . . . . . . . . . . . . . . . . . . . 121<br />
4.1.2 Dating young groundwater in the North China Plain . . . . . . . . . . . . . . . 122<br />
4.1.3 A multi tracer study to investigate the groundwater in the Odenwald region . . 123<br />
4.1.4 Noble gas measurements on fluid inclusions in speleothems . . . . . . . . . . . 124<br />
4.1.5 Gas partitioning in groundwater . . . . . . . . . . . . . . . . . . . . . . . . . . 125<br />
4.1.6 Laboratory and field experiments on the formation of excess air in groundwater 126<br />
4.1.7 Excess air formation at an artificial recharge site . . . . . . . . . . . . . . . . . 127<br />
4.1.8 Collecting dissolved gases in water by diffusion samplers . . . . . . . . . . . . . 128<br />
4.2 Lake Research (Limnophysics) . . . . . . . . . . . . . . . . . . . . . . . . . . . . . . . 131<br />
4.2.1 Empirical mode decomposition: A tool to analyse time series . . . . . . . . . . 133<br />
4.2.2 Hydrology and vertical transport of meromictic mining lakes traced with SF6<br />
on the background level . . . . . . . . . . . . . . . . . . . . . . . . . . . . . . . 134<br />
5 Small-Scale Air-Sea Interaction 137<br />
5.1 Small-Scale Air-Sea Interaction . . . . . . . . . . . . . . . . . . . . . . . . . . . . . . . 139<br />
5.1.1 Gas Exchange Measurements: The Transition of the Boundary Conditions from<br />
a Flat to a Wavy Water Surface . . . . . . . . . . . . . . . . . . . . . . . . . . 144<br />
5.1.2 Gas exchange rates by LIF imaging of O2 concentration boundary layer . . . . 145<br />
5.1.3 Water flow measurements in environmental and biological systems . . . . . . . 146
CONTENTS 5<br />
5.1.4 Measuring depth dependent concentration profiles via fluorescent pH-indicator 147<br />
5.1.5 3D fluid flow measurement close to free water surfaces . . . . . . . . . . . . . . 148<br />
5.1.6 Small-scale turbulence in the sea-surface microlayer . . . . . . . . . . . . . . . 149<br />
5.1.7 Measurement of short wind waves . . . . . . . . . . . . . . . . . . . . . . . . . 150<br />
5.1.8 Spectroscopic Techniques for Gas-Exchange Measurements . . . . . . . . . . . 151<br />
6 Forschungsstelle “Radiometrie” of the Heidelberger Akademie der Wissenschaften155<br />
6.1 Forschungsstelle ”Radiometrie” of the Heidelberger Akademie der Wissenschaften . . . 157<br />
6.1.1 Modelling growth and isotopic composition of stalagmites . . . . . . . . . . . . 160<br />
6.1.2 A precisely dated climate record for the last 9 kyr from three high alpine stalagmites,<br />
Spannagel Cave, Austria . . . . . . . . . . . . . . . . . . . . . . . . . 161<br />
6.1.3 Measurement of 231 Pa in deep-sea sediments via ICP-MS and AMS . . . . . . . 162<br />
6.1.4 Ghost Resonance in Glacial Climate . . . . . . . . . . . . . . . . . . . . . . . . 163<br />
6.1.5 Dating and interpretation of climate proxies for three Holocene stalagmites from<br />
the South of Chile (Patagonia) . . . . . . . . . . . . . . . . . . . . . . . . . . . 164<br />
6.1.6 14 C in speleothems . . . . . . . . . . . . . . . . . . . . . . . . . . . . . . . . . 165<br />
6.1.7 Precise dating of D/O-Events on a stalagmite from Socorta Island (Indian Ocean)166<br />
6.1.8 Trace element mapping of speleothems . . . . . . . . . . . . . . . . . . . . . . . 167<br />
6.1.9 U-series dating and paleoclimatic interpretation of the stable isotope profile of<br />
stalagmite ER76 from Grotta di Ernesto, Italy . . . . . . . . . . . . . . . . . . 168<br />
6.1.10 Kinetic Fractionation of Stable Isotopes in Speletothems - Laboratory Experiments169<br />
6.1.11 231 Pa/ 235 U-Dating of fossil corals with AMS . . . . . . . . . . . . . . . . . . . 170<br />
6.1.12 Reconstruction of the geomagnetic field strength over the past 300.000 years<br />
derived from 10 Be data of deep sea sediments from the North and South Atlantic<br />
Ocean . . . . . . . . . . . . . . . . . . . . . . . . . . . . . . . . . . . . . . . . . 171<br />
Bibliography 177
6 CONTENTS
Introduction<br />
In Heidelberg, environmental physics continuously developed since the 1950s from the application of<br />
nuclear physics methods to environmental research, mainly driven by Otto Haxel. In 1975, this led to<br />
the foundation of the <strong>Institut</strong> <strong>für</strong> <strong>Umweltphysik</strong> (<strong>Institut</strong>e of Environmental Physics), the first of its<br />
kind in Germany, in the Fakultät <strong>für</strong> Physik und Astronomie with Karl-Otto Münnich as its founding<br />
director.<br />
From the start, the IUP focused on the underlying physics of a wide spectrum of environmental processes<br />
and less on specific applications in atmospheric sciences, soil sciences, hydrology, or oceanography.<br />
This turned out to be a major strength and it continues to distinguish the IUP from other large<br />
environmental research institutes. With this focus, the IUP attains great flexibility in its methods<br />
and is able to provide an environment where classical divisions between systems and disciplines can<br />
be overcome. For instance, we investigate boundary layers between compartments which determine<br />
the soil-atmosphere and ocean-atmosphere interactions. This direction of research is also adopted<br />
by large international programs, like the International Geosphere Biosphere Project (IGBP), which<br />
in recent times focus increasingly on investigation of interaction between compartments of the Earth<br />
system. With its firm rooting in physics, the IUP sees itself in an excellent position to recognize and<br />
investigate system properties of our environment and the interplay of its subsystems (atmosphere,<br />
cryosphere, soil, groundwater, oceans,. . . ).<br />
The IUP is a strongly experiment-oriented institution. Our current major fields of research are:<br />
• physical foundations of climate research (budgets of greenhouse gases, oxidation capacity of the<br />
atmosphere, radiation in the atmosphere),<br />
• consequences of global change on central cycles in the earth system (water, carbon), and<br />
• reconstruction of paleoclimate from a variety of environmental archives.<br />
Our spectrum of methods still contains those developed from nuclear physics inheritance, specifically<br />
the analysis of 14 C and various stable isotopes including noble gases. In addition, we employ an<br />
array of new techniques like spectroscopy (of the atmosphere) and imaging spectroscopy, remote<br />
sensing from ground-, air-, and space-borne platforms, time series analysis, as well as experiment- and<br />
process-oriented modeling and simulation.<br />
This report gives a snapshot of the research performed at the IUP by diploma students, doctoral<br />
students, and senior scientist. It is intended as a comprehensive but concise overview for the members<br />
of the institute as well as for the scientific community.<br />
7
Atmosphere and Remote Sensing<br />
2.1 Tropospheric Research Group . . . . . . . . . . . . . . . . . . . . . . . . . 13<br />
2.2 Stratospheric Research Group . . . . . . . . . . . . . . . . . . . . . . . . . 35<br />
2.3 Radiative Transfer . . . . . . . . . . . . . . . . . . . . . . . . . . . . . . . . 47<br />
2.4 Satellite Group . . . . . . . . . . . . . . . . . . . . . . . . . . . . . . . . . . 55<br />
2.5 MarHal - Modeling of marine and halogen chemistry . . . . . . . . . . . 73<br />
2.6 Carbon Cycle Group . . . . . . . . . . . . . . . . . . . . . . . . . . . . . . 81<br />
9
Overview<br />
Summary<br />
Atmospheric research at the IUP (headed by U. Platt) concentrates on the physical and chemical<br />
properties and composition of the atmosphere related to the global climate system as well as on processes<br />
governing the oxidation capacity of the atmosphere. Central topics are reactive halogen species<br />
in the troposphere, their release mechanisms, abundance, and influence on the oxidation capacity as<br />
well as other free radical cycles in the stratosphere and troposphere, fundamental research related to<br />
scattering and absorption of short-wave radiation transport in the atmosphere, and on the abundance<br />
and role of trace and greenhouse gases in atmospheric chemistry and in the climate system. Main<br />
tools of our research are spectroscopic observing systems on global, continental and regional scales<br />
relying on sophisticated surface-, aircraft-, and balloon- based as well as space-borne remote sensing<br />
techniques.<br />
Observations are integrated in modelling studies of marine and stratospheric photochemistry with a<br />
particular focus put on the chemistry of halogens, atmospheric radiation transport, and on global,<br />
regional and trajectory models of source and sink processes of greenhouse gases.<br />
Central topics include:<br />
• Atmospheric composition and links to human health<br />
• Radiation transfer processes and links to climate<br />
• Tropospheric halogen species and their role in the oxidation capacity of the atmosphere<br />
• Stratospheric ozone as influenced by halogen and nitrogen species<br />
• Sources and sink processes as well as isotopic abundances of greenhouse gases<br />
• Global observing systems<br />
• Further development of remote sensing techniques (e.g. tomographic techniques)<br />
A detailed description of the different topics is presented in the individual group reports.<br />
Atmospheric composition and links to human health<br />
Studies of radical processes in tropospheric chemistry were performed, free radicals determine the<br />
oxidation capacity of the troposphere, i.e. the capacity of the atmosphere to clean itself from natural<br />
and anthropogenic pollutants. Scientific objectives include studies of the processes governing the<br />
oxidation capacity of the troposphere. In particular the release and activation processes of reactive<br />
halogen species in the troposphere. Studies in this year centred on the following questions:<br />
• The abundance of reactive halogen species (BrO, IO, OIO, I2) in the marine boundary layer in<br />
coastal regions.<br />
• The abundance of reactive halogen species (BrO, IO) and related compounds over the open<br />
ocean.<br />
• The abundance of reactive halogen species, in particular BrO, and related species like NO2, NO3<br />
and CH2O in the free troposphere<br />
• The rate of volcanic emissions of SO2 and reactive halogen species, e.g. BrO, ClO, OClO.<br />
• The chemical evolution of reactive halogen species in volcanic plumes, with particular emphasis<br />
on the processes after O2 and O3 mixes into the originally reducing plume.<br />
• The tomographic determination of the 2D-distribution of air pollutants over the city of Heidelberg.<br />
The different topics are described in detail in the individual group reports.<br />
11
12 CHAPTER 2. ATMOSPHERE AND REMOTE SENSING<br />
Future Work<br />
Future work will encompass<br />
1. Continued establishment of a large network of ground based remote sensing instruments to<br />
quantify volcanic emissions, which will provide the first comprehensive study of volcanic sulfur<br />
and halogen emissions (EU-project NOVAC).<br />
2. Further study of the marine halogen chemistry with particular emphasis on iodine-particle formation<br />
(EU-project MAP), nonlinear chemistry, and emission ”hot spots”.<br />
3. Spectroscopic studies of atmospheric particles will be performed within a large long-term intercomparison<br />
exercise (EU-project ICARTT).<br />
4. Study of the inter-annual variation of the solar radiation field including 2-D imaging spectroscopy<br />
of the radiative properties of the atmosphere with a particular focus on the radiative properties<br />
during the life cycle of individual clouds (DFG Forschergruppe ’life cycles of clouds’)<br />
5. Using novel ballon-based instrumentation (Mini-DOAS), the time-dependence of ozone destroying<br />
radicals (BrO, and OClO) and inferred reactive chlorine will be investigated from which<br />
conclusions on the most important loss reactions for stratospheric ozone in polar winter can be<br />
drawn.<br />
6. Investigation of the transport and photochemical processes at the major entrance of tropospheric<br />
air into the stratosphere, i.e. the tropical upper troposphere layer/lowermost stratosphere<br />
(TTL/LMS). Conclusions will be drawn on the ozone depletion potential of major manmade<br />
and naturally emitted ozone destroying chemicals passing the TTL/LMS (EU-project<br />
SCOUT-O3).<br />
7. Study of the European carbon balance and in particular the fossil fuel CO2 contribution (EUproject<br />
CarboEurope-IP).<br />
8. Within the carbon system, investigation of independent constraints on global carbon exchange<br />
as derived from long-term high precision 14 CO2 observations in combination with model studies<br />
(DFG project, Atmospheric 14 C).<br />
9. Investigation of the continental European hydrogen budget (in particular the anthropogenic<br />
source and the soil sink) using continuous and aircraft observations over Europe and Siberia<br />
(EUROHYDROS and TCOS II, submitted EU proposals). Instrument development will be<br />
continued, a particular topic being preparation for the new German research aircraft HALO. In<br />
this context we are developing novel instruments based on imaging and near-IR spectroscopy.<br />
Literature<br />
A total of 52 peer reviewed manuscripts where accepted by or appeared in scientific journals. Members<br />
of the institute were invited to give one presentation on topics related to atmospheric research at<br />
scientific conferences<br />
Diploma and Doctoral Theses<br />
A total of 1 Diploma theses and 6 Doctoral theses on topics related to atmospheric research were<br />
completed in the reporting period.
2.1. TROPOSPHERIC RESEARCH GROUP 13<br />
2.1 Tropospheric Research Group<br />
Group members<br />
Prof. Dr. U. Platt, Group leader Atmosphere<br />
Jessica Balbo, Diploma Student<br />
Dipl. Phys. B. Dix, Ph.D. Student<br />
Marleen Gillmann, technician<br />
Dr. Klaus-Peter Heue, Post-Doc<br />
M.Sc. Ossama Ibrahim, Ph.D. Student<br />
Dipl. Phys. Christoph Kern, Ph.D. Student<br />
Dipl. Phys. Thomas Lehmann, software development<br />
Dipl. Phys. André Merten, Ph.D. Student<br />
Jan Meinen, Diploma Student (Univ. of Ilmenau, jointly with T. Leisner)<br />
Dr. C. Peters, Post Doc<br />
Dipl. Phys. Denis Poehler, Ph.D. Student<br />
Dipl. Phys. Katja Seitz, Ph.D. Student<br />
Susanne Lindauer, technician<br />
Dipl Phys. Roman Sinreich, Ph.D. Student<br />
Holger Sihler, Diploma Student (University of Jena)<br />
Thorsten Stein, Diploma Student<br />
Jens Tschritter, Diploma Student<br />
Markus Woyde, Diploma Student<br />
Abstract<br />
Tropospheric research in the IUP concentrates on the processes governing the oxidation capacity of the<br />
atmosphere. Of particular interest are release processes of reactive halogen species from a multitude of<br />
sources (marine biology, sea spray, volcanoes, etc.) into the troposphere. Consequences for the state<br />
of the troposphere are studied together with the other atmospheric subgroups and within national<br />
and international collaborations.<br />
Scientific Objectives<br />
include studies of the processes governing the oxidation capacity of the troposphere. In particular the<br />
release and activation processes of reactive halogen species in the troposphere. The questions studied<br />
in this year centred on the following questions:<br />
• The abundance of reactive halogen species (BrO, IO, OIO, I2) in the marine boundary layer in<br />
coastal regions and over the open ocean.<br />
• The abundance of reactive halogen species, in particular BrO, and related species like NO2, NO3<br />
and CH2O in the free troposphere.<br />
• The rate of volcanic emissions of SO2 and reactive halogen species, e.g. BrO, ClO, OClO.<br />
• Modelling and observational studies of the chemical evolution of reactive halogen species in<br />
volcanic plumes, in particular with respect to processes after mixing of O2 and O3 into the<br />
originally reducing gases emanating from the lava.<br />
• Determination of two-dimensional trace gas distributions.<br />
Overarching topic<br />
Studies of radical processes in tropospheric chemistry, the oxidation capacity of the troposphere, i.e.<br />
the capacity of the atmosphere to clean itself from natural and anthropogenic pollutants. The role of<br />
aerosol particles in atmospheric radiation.<br />
Background<br />
Free radicals play a pivotal role in atmospheric chemistry. Despite their exceedingly small concentration<br />
(mixing ratios around < 10 −12 to about 10 −10 ), these species are the driving force for most<br />
chemical processes in the atmosphere. While the role of hydrogen radicals (OH, HO2) is relatively<br />
well studied and largely understood, other free radicals like halogen atoms or halogen oxides (e.g. IO,<br />
BrO, ClO) have been neglected until recently. In particular, at the levels suggested by the available
14 CHAPTER 2. ATMOSPHERE AND REMOTE SENSING<br />
measurements tropospheric halogen species can have profound effects on many aspects of tropospheric<br />
chemistry, these include:<br />
(1) Reactive halogen species, and in particular reactive bromine and iodine can readily destroy tropospheric<br />
ozone, which can have a multitude of consequences, both chemical and climatic (e.g. [Roscoe<br />
et al. , 2001], [Platt & Hönninger, 2003]). Catalytic ozone destruction essentially occurs by two distinct<br />
reaction cycles. Either (I) involving self reaction of halogen oxide radicals with other halogen oxide<br />
radicals (XO+XO or XO+YO) or (II) reaction of halogen oxides with hydrogen radicals XO+HO2):<br />
leading to the net result:<br />
O3 + O3 → 3O2<br />
Cycle (I) has been identified as the prime cause for polar boundary layer ozone destruction (e.g.<br />
[Barrie & Platt, 1997]). Since the rate of ozone destruction is usually proportional to the square of<br />
the halogen oxide concentration, cycle (I) ineffective at low XO levels usually found in mid-latitude<br />
coastal areas. At low RHS levels, however O3 destruction takes place by reaction cycle (II), here the<br />
rate of O3 destruction is linearly dependent on the XO concentration.<br />
(2) An important side effect of cycle (II) the conversion of HO2 to OH and thus a reduction of the<br />
HO2/OH ratio, in particular at low NOX levels. At a given photochemical situation (O3, H2O levels,<br />
insolation) the presence of BrO or IO will therefore increase the OH concentration. It is interesting<br />
to note that both effects have been observed in the upper troposphere (e.g. [Wennberg et al. , 1998]).<br />
(3) The reaction of XO with NO leads to conversion of NO to NO2 and thus to an increase of the<br />
Leighton ratio (L=[NO2]/[NO]). An increase in L is thus usually regarded as an indicator for photochemical<br />
ozone production (due to the presence of RO2 (R = organic radical)) in the troposphere.<br />
However, as already noted by [Platt & Janssen, 1996] an increase in L due to halogen oxides will not<br />
lead to O3 production.<br />
(4) A more subtle consequence of reactive halogen species for the ozone levels in the free troposphere<br />
is due to the combination of the above effects (2) and (3) as pointed out by [Stutz et al. , 1999]:<br />
Photochemical ozone production in the troposphere is limited by the reaction<br />
(2.1)<br />
NO + HO2 → NO2 + OH (2.2)<br />
However, the presence of reactive bromine will reduce the concentrations of both educts of the above<br />
reaction and thus reduce the NOX - catalysed ozone production.<br />
(5) Heterogeneous reactions of bromine species (i.e. HOBr) with (sea salt) chloride can lead to the<br />
release of Cl-atoms. This process constitutes a Br catalysed chlorine activation. Since Cl-atoms are<br />
highly reactive, this process directly enhances the oxidation capacity of the troposphere, see e.g. [Platt<br />
et al. , 2004].<br />
(6) Gas-phase iodine species (like IO, OIO or HOI) may facilitate transport of I from the coast to<br />
inland areas and thus contribute to our iodine supply [Cauer, 2004], [Cox et al. , 1999].<br />
(7) Deposition of mercury was found to be enhanced by the presence of reactive bromine species in<br />
particular in polar regions (e.g. [Barrie & Platt, 1997]), this process appears to be linked to the<br />
oxidation of Hg0 to Hg(II), likely by reaction with BrO [Lindberg et al. , 2002].<br />
(8) The reaction of BrO with dimethyl sulfide (DMS) might be important in the unpolluted remote<br />
marine boundary layer where the only other sink for DMS is the reaction with OH radicals (e.g. [von<br />
Glasow et al. , 2004], [von Glasow & Crutzen, 2004]).<br />
(9) Iodine species have been shown to be involved in particle formation in the marine BL ([Leck &<br />
Bigg, 1999], [Hoffmann et al. , 2001], [O’Dowd et al. , 2002], [Burkholder et al. , 2004]).<br />
(10) Evidence is accumulating (see e.g. [Platt & Hönninger, 2003]) that there is a wide-spread ”background”<br />
level of BrO radicals in the free troposphere, due to the processes described under (1)-(5)<br />
and (8) above there might be an important effect of reactive halogens on the global tropospheric<br />
chemistry as summarised by [von Glasow et al. , 2004].<br />
Main methods<br />
include the experimental determination of the halogen oxide distribution and the distribution of related<br />
species in several compartments of the troposphere:<br />
1) The marine boundary layer in coastal regions (Mace Head, Ireland).<br />
2) The open ocean.<br />
3) The free troposphere.<br />
4) Volcanic emissions (contents of reactive halogen species, e.g. BrO, ClO, OClO in volcanic plumes).
2.1. TROPOSPHERIC RESEARCH GROUP 15<br />
The measurements are made by Differential Optical Absorption Spectroscopy (DOAS), which allows<br />
the detection of many atmospheric trace gases at a sensitivity in the ppt - range (i.e. at mixing<br />
ratios down to 10-12ppt). For studies in the different compartments a series of variants of the technique<br />
were applied:<br />
1) Studies in the marine boundary layer were performed by active DOAS (i.e. using artificial light<br />
sources), which allows also nighttime studies, as well as by passive ”Multi-Axis” DOAS (MAX-DOAS).<br />
2) Ship-borne measurements in the open ocean relied on MAX-DOAS observations requiring relatively<br />
little logistic prerequisites and allowed unattended operation.<br />
3) Aircraft-based measurements in the free troposphere are also based on passive MAX-DOAS observations,<br />
while ground based observations (at the Zugspitze) employ active DOAS measurements.<br />
4) Aircraft-based measurements of pollution plumes employed the newly developed Airborne Imaging-<br />
DOAS technique.<br />
5) Observation at volcanoes were made by passive MAX-DOAS and by the novel Imaging-DOAS<br />
technique recently developed in our group.<br />
In addition to the field campaigns a number of projects is aimed at technological improvements of<br />
the DOAS technology. Activities included studies on the reduction of the optical noise [Platt, 1994]<br />
by the use of optical fibers and mode mixers to connect light source and transmitting telescope, the<br />
use of Light Emitting Diodes as DOAS light sources, and development of novel techniques for the<br />
inversion of MAX-DOAS measurements to derive the aerosol optical density as well as the vertical<br />
distribution of trace gases in the lower atmosphere.<br />
Main activities<br />
A large number of field campaigns were conducted:<br />
• Expeditions to the volcanoes Etna (Italy) and ... to study emission of halogen oxide radicals<br />
and SO2.<br />
• Studies of nitrate radicals and related species at the Schneeferner Haus (Zugspitze, Germany)<br />
• Ship expedition (on RV Polarstern) during ... to study the NO2, O3, and BrO from 52 o S to<br />
72 o N.<br />
• Studies of the oxidation capacity of the lower atmosphere in New England (USA) within the<br />
framework of the ICARTT project.<br />
• Participation in the CARIBIC - Project.<br />
• Also world wide long-term measurements of halogen oxides and related species were performed<br />
by the ”Heidelberg Ground-Based Network”.<br />
• Transsects with Automobile based DOAS instruments were performed to study emission plumes<br />
(e.g. from fire in southern England).<br />
• Observation of the 2-dimensional trace gas distribution over the centre of Heidelberg using<br />
tomographic - DOAS techniques.<br />
• DOAS Measurements of VOCs and HOX precursors in Mexico City during the MCMA-2006<br />
campaign.<br />
A series of laboratory studies aimed at the improvement of the DOAS technique:<br />
• Investigation of the suitability of LEDs as light sources for active DOAS measurements<br />
• Development of a new quartz-fibre based technique for coaxial DOAS instruments, which promises<br />
more compact and robust instruments.<br />
• Development of the Airborne Imaging-DOAS technique.
16 CHAPTER 2. ATMOSPHERE AND REMOTE SENSING<br />
Funding<br />
EUSAAR (EU)<br />
NOVAC (EU)<br />
MAP (EU)<br />
IALSI (EU)<br />
TURBAN (DFG)<br />
DFG-HALO<br />
SCIAMACHY validation (BMBF)<br />
CARIBIC<br />
Two Ph.D. students are funded through the International Max-Planck Research School on ”Experimental<br />
Atmospheric Chemistry”.<br />
Cooperation within the institute and with groups outside of the institute<br />
Obviously there is close cooperation within the atmospheric groups. National and international cooperation<br />
exists with the following groups:<br />
Chalmers University, Gothenburg, Sweden (B. Galle)<br />
Volcanic observatory Etna, Italy (M. Burton)<br />
Max-Planck Institue for Chemistry, Mainz (J. Crowley, T. Wagner)<br />
University of Mainz (Heumann)<br />
University of Bayreuth (C. Zetzsch)<br />
<strong>Institut</strong>e for Physical Chemistry, University of Wuppertal (I. Barnes)<br />
Alfred Wegener <strong>Institut</strong>e for Polar Research, Bremerhafen<br />
NOAA, Boulder (M. Trainer)<br />
University of Cambridge (Oppenheimer)<br />
Atmospheric Environment Sevice of Canada, Toronto, CDN (J. Bottenheim)<br />
University of California, Los Angeles, USA (J. Stutz)<br />
IfM-Geomar, Kiel (D. Wallace)<br />
IfT Leipzig (Neuhaus)<br />
Future Work<br />
will encompass the establishment of a large network of volcanic stations to provide the first comprehensive<br />
and quantitative study of volcanic sulfur and halogen emissions (EU-project NOVAC). Also<br />
marine halogen chemistry will be studied, particular emphasis will be of iodine-particle formation (Euproject<br />
MAP), nonlinear chemistry, and emission ”hot spots”. Spectroscopic studies of atmospheric<br />
particles will be performed within a large long-term intercomparison exercise (EU-projcet ICARTT).<br />
Instrument development will be continued, a particular topic being preparation for the new German<br />
research aircraft HALO.<br />
Peer Reviewed Publications<br />
1. Allen et al. [2006]<br />
2. Bobrowski et al. [2006a]<br />
3. Bobrowski et al. [2006c]<br />
4. Bruns et al. [2006]<br />
5. Kern et al. [2006]<br />
6. Frießet al. [2006]<br />
7. Frins et al. [2006]<br />
8. Hartl et al. [2006]<br />
9. Leigh et al. [2006]<br />
10. Mettendorf et al. [2006]<br />
11. Wang et al. [2006]<br />
12. Oppenheimer et al. [2006]
2.1. TROPOSPHERIC RESEARCH GROUP 17<br />
Other Publications<br />
1. Barkly et al. [2006]<br />
2. Bobrowski & Platt [2006]<br />
3. Bobrowski et al. [2006b]<br />
4. Frieler et al. [2006]<br />
5. Frieß& Platt [2006b]<br />
6. Frieß& Platt [2006a]<br />
7. Lee et al. [2006]<br />
8. Louban et al. [2006]<br />
9. Platt et al. [2006]<br />
10. Sebastian et al. [2006]<br />
11. Sinreich et al. [2006]<br />
12. Simpson et al. [2006]<br />
13. Stutz et al. [2006]<br />
14. Xie et al. [2006]<br />
Diploma Theses<br />
1. Stein [2006]<br />
PhD Theses<br />
1. Bossmeyee [2006]<br />
2. Hak [2006]
18 CHAPTER 2. ATMOSPHERE AND REMOTE SENSING<br />
2.1.1 Long term measurements of reactive halogen species, trace gases and<br />
aerosols by Multi Axis Differential Optical Absorption Spectroscopy<br />
(MAX-DOAS)<br />
Jessica Balbo (Udo Frieß, Ulrich Platt)<br />
Abstract Two multi-axis DOAS instruments were set up at (1) the Global Atmospheric Watch<br />
(GAW) site in Hohenpeissenberg, Germany, and (2) at the new SOLAS observatory on the island<br />
of São Vicente, Cape Verde. The purpose of these long-term measurements is the investigation of<br />
the tropospheric chemistry in polluted areas (Hohenpeissenberg) and in the remote marine boundary<br />
layer (Cape Verde).<br />
Figure 2.1: Mounting of Mini Max-Doas instruments on Hohenpeissenberg, Germany (left) and São<br />
Vicente, Cape Verde (right)<br />
Background Long-term observations of compounds<br />
playing a key role in the atmospheric<br />
chemistry are of great importance for the understanding<br />
of the chemical processes occurring on<br />
time scales ranging between minutes and years.<br />
Anthropogenically emitted pollutants, such as<br />
NOx and volatile organic compounds (VOCs)<br />
have an impact on the tropospheric ozone budget<br />
and can affect human health. On the other<br />
hand, it is also important to study the remote<br />
atmosphere in order to understand its chemical<br />
behaviour in the absence of man-made emissions.<br />
In recent years evidence has grown that halogen<br />
compounds emitted by the ocean can have a severe<br />
impact on the chemistry of the marine boundary<br />
layer, and possibly also on the ozone budget and<br />
thus climate on a global scale.<br />
Methods and results Two multi-axis DOAS<br />
instruments were installed with the purpose of<br />
performing long-term measurements of atmospheric<br />
trace gases. The first instrument has<br />
been installed in August 2006 and is operated<br />
in collaboration with the Deutsche Wetterdienst<br />
at the Global Atmospheric Watch (GAW) Station<br />
in Hohenpeissenberg, Germany (figure 2.1,<br />
left). The GAW station is located about 60 km<br />
south-west of Munich at an altitude of ≈ 1000 m.<br />
Max-DOAS measurements performed at this location<br />
will, depending on the wind direction, allow<br />
to measure several important trace gases (NO2,<br />
formaldehyde, nitrous acid) both in background<br />
air and in polluted air masses originating from<br />
Munich. The second long-term MAX-DOAS instrument<br />
has been installed on the SOLAS observatory<br />
on the island of São Vicente, Cape Verde<br />
(figure 2.1, right). The main focus of these unique<br />
measurements is the investigation of reactive halogen<br />
chemistry in the subtropical marine boundary<br />
layer based on measurements of BrO, IO, and possibly<br />
OIO in a region where atmospheric measurements<br />
are still very sparse.<br />
Outlook/Future work The long-term measurements<br />
in Hohenpeissenberg and on the Cape<br />
Verde Islands are planned to be performed for<br />
several years, allowing to investigate the tropospheric<br />
chemistry both under polluted conditions<br />
in central Europe and in the subtropical marine<br />
boundary layer. The spectral analysis of the time<br />
series from the two MAX-DOAS instruments is<br />
currently under development and first results are<br />
expected in early 2007.
2.1. TROPOSPHERIC RESEARCH GROUP 19<br />
2.1.2 DOAS on board: trace gas measurements on CARIBIC flights<br />
Barbara Dix (Udo Frieß, Thomas Wagner, Ulrich Platt)<br />
Abstract CARIBIC (Civil Aircraft for the Regular Investigation of the atmosphere Based on an<br />
Instrument Container) is an innovative project to study atmospheric processes on board a passenger<br />
aircraft during long-distance flights. Besides in-situ measurements of various atmospheric compounds,<br />
it also features a Multi-Axis DOAS instrument to detect specific trace gases.<br />
Figure 2.2: The inlet pylon (h=0.5m) is mounted to the airplane’s lower body. Three small black<br />
holes in the upper half indicate the position of the DOAS telescope entrances.<br />
Background Halogen compounds and nitrogen<br />
oxides have a significant impact on the global<br />
ozone budget, e.g. reactive bromine and chlorine<br />
compounds cause stratospheric ozone depletion.<br />
A possible background of reactive bromine compounds<br />
in the free troposphere would also have<br />
a strong impact on the tropospheric ozone budget.<br />
Therefore global measurements of tropospheric<br />
compounds are of great interest.<br />
Within the framework of CARIBIC, a new<br />
DOAS (Differential Optical Absorption Spectroscopy)<br />
instrument was built. Besides BrO, it<br />
can also detect HCHO, OClO, HONO, O3, NO2,<br />
water vapor, and O4.<br />
Methods and results Airborne DOAS measurements<br />
provide an excellent platform to study<br />
the free troposphere globally. The CARIBIC<br />
DOAS instrument is one of 21 instruments<br />
mounted in a cargo container, that has been successfully<br />
put into operation on a new long-range<br />
Airbus (A340-600) of Deutsche Lufthansa. Since<br />
May 2005 regular flights with fully automated<br />
measurements are performed once a month. A<br />
miniaturized telescope system, which was especially<br />
designed to fit into the inlet pylon (see figure<br />
2.2), collects UV-visible scattered sun light<br />
from three different viewing directions (straight<br />
down, 10 degrees above and below the horizon).<br />
With this Multi-Axis technique the separation<br />
of boundary layer, free tropospheric and stratospheric<br />
columns is possible. Trace gases are identified<br />
and quantified from their individual absorption<br />
structures in recorded spectra.<br />
Results show stratospheric columns of BrO,<br />
NO2 and O3 as well as tropospheric water vapor<br />
in the tropics. So far there where no enhanced<br />
BrO levels detected in the free troposphere, perhaps<br />
due to an evenly distributed background.<br />
Enhanced levels of tropospheric NO2 and HCHO<br />
during landing and take-off in big cities such as<br />
Sao Paulo, Guanghzou (China) or Manila are seen<br />
as expected due to anthropogenic pollution. During<br />
several flights over South America and China<br />
biomass burning plumes were seen and in one convective<br />
pollution plume over China even HONO<br />
could be detected. Measured columns of the oxygen<br />
dimer O4 yield information on the radiative<br />
transport.<br />
Outlook/Future work Radiative transfer<br />
modelling will be performed in order to extract<br />
vertical columns for BrO, NO2 and O3 as well as<br />
for characterizing the boundary layer upon landing<br />
and take-off. Together with other CARIBIC<br />
participants the questions of transport and chemistry<br />
within plumes will be discussed and by spring<br />
2007 a full year of flights from Germany to China<br />
will provide the foundation for first statistics.
20 CHAPTER 2. ATMOSPHERE AND REMOTE SENSING<br />
2.1.3 Airborne Imaging DOAS<br />
Klaus-Peter Heue (Stephen Broccardo 2 , Stuart Piketh 2 , Ulrich Platt, Kristy Ross 3 )<br />
2 University of Witwatersrand Johannesburg, 3 ESKOM, South Africa<br />
Abstract Two dimensional distribution of a several trace gases were mapped by a ground based<br />
imaging DOAS instrument build in 2003. Now a modified instrument for airborne measurements was<br />
realised and first measurements were performed in a test campaign in the Highveld region South Africa<br />
in October 2006.<br />
N u m b e r o f p ix e l<br />
5<br />
1 0<br />
1 5<br />
2 0<br />
2 5<br />
D is ta n c e [m ]<br />
0 5 0 0 1 0 0 0 1 5 0 0 2 0 0 0 2 5 0 0 3 0 0 0 3 5 0 0<br />
4 3 8 0 4 3 8 5 4 3 9 0 4 3 9 5 4 4 0 0 4 4 0 5 4 4 1 0 4 4 1 5 4 4 2 0<br />
N u m b e r o f s p e c tru m<br />
8 0 0<br />
6 0 0<br />
4 0 0<br />
2 0 0<br />
0<br />
-2 0 0<br />
-4 0 0<br />
-6 0 0<br />
-8 0 0<br />
w in d d ire c tio n<br />
flig h t d ire c tio n<br />
Figure 2.3: NO2 SCD distribution below the aircraft close to the power station in Majuba, South<br />
Africa, which is indicated by the circle (preliminary result).<br />
Background In most atmospheric investigations<br />
information about the two dimensional distribution<br />
of tropospheric trace gases is highly desirable.<br />
A typical use is the identification of source<br />
areas, emission plumes, or the validation of chemical<br />
transport models. In the past various attempts<br />
have been made on different spatial scales, e.g.<br />
DOAS tomography on local scales (10 km), or<br />
satellite measurements on a global scale. We build<br />
an instrument based on imaging spectroscopy to<br />
map the 2D distribution of a series of relevant<br />
trace gases including NO2, glyoxal, H2O, O4 and<br />
BrO. It is installed on an aeroplane and observes<br />
the local distribution with a spatial resolution of<br />
100 m.<br />
The Imaging DOAS instrument Lohberger<br />
et al. [2004] consists of an imaging spectrometer<br />
combined with a two dimensional detector<br />
(i.e. a CCD camera) analysing sun-light backscattered<br />
from the earth’s surface. The CCD camera<br />
records the spectral information in one dimension<br />
(x) and spatial information in the other dimension<br />
(y) perpendicular to the aircraft’s flight direction.<br />
The spectra are analysed using the DOAS technique<br />
?, to retrieve the concentration integrated<br />
along the light paths which is called slant column<br />
densities (SCD’s). Thereby 2D-maps of the trace<br />
gas’s SCD are recorded.<br />
The newly build instrument was installed on<br />
an Aero Commander (ZS-JRA) of the South<br />
D is ta n c e [m ] a t g ro u n d le v e l<br />
re la tiv e to th e p lu m b lin e<br />
African Meteorological Service for a research campaign<br />
in the Highveld (ZA) in early October 2006.<br />
The instrument’s total field of view was 24.5 o (corresponding<br />
to a swath width of e.g. 1900 m at<br />
4400 m flight altitude above ground).<br />
Methods and results First results are shown<br />
in figure 2.3 depicting the recorded NO2 columns<br />
when the aeroplane passed over a power station.<br />
The prevailing wind (indicated by the arrow) blew<br />
the plume across the flight track as it is clearly<br />
visible in the reconstructed NO2 SCD map.<br />
Outlook/Future work The existing instrument<br />
has to be further improved until next spring<br />
when the second part of the campaign will take<br />
place.<br />
In cooperation with the Anhui <strong>Institut</strong>e of Optics<br />
& Fine Mechanics (Hefei, China) new improved<br />
instruments will be build and employed on<br />
a high altitude research aircraft.<br />
Meanwhile the construction of a more sophisticated<br />
instrument for the new research aircraft<br />
HALO (Gulfstream 550) has just begun.<br />
Funding The measurements in South Africa<br />
were funded by the South African electricity<br />
supply company (Eskom). The instrument was<br />
funded by the <strong>Institut</strong>e.<br />
2 ]<br />
N O 2 S C D [1 0 1 6 m o le c /c m<br />
2 2<br />
2 0<br />
1 8<br />
1 6<br />
1 4<br />
1 2<br />
1 0<br />
8<br />
6<br />
4<br />
2<br />
0
2.1. TROPOSPHERIC RESEARCH GROUP 21<br />
2.1.4 Auto-MAX DOAS measurements for Tropospheric NO2 in Europe<br />
O. W. Ibrahim (Thomas Wagner, Torsten Stein and Ulrich Platt)<br />
Abstract Detection and retrieval of Vertical Column Densities of tropospheric air pollutant trace gas<br />
NO2 was carried on in industrial/traffic/urban areas in Europe. Measurements have been performed<br />
using the Automobile Multi Axis Differential Optical Absorption Spectroscopy technique(Auto-MAX<br />
DOAS)<br />
Figure 2.4: Panel (A): The route of driving with Auto-MAX DOAS from Brussels (Belgium) to<br />
Heidelberg (Germany). Panel(B):The Vertical Column Densities (VCDs) along the route retrieved<br />
from these measurements.<br />
Background Measurements of tropospheric<br />
pollutant trace gases in urban and industrial areas<br />
need a suitable spatial resolution. Although<br />
Satellites and airplanes can perform tropospheric<br />
columns measurements , their spatial resolution is<br />
still of the order of several kilometers. The Automobile<br />
Multi Axis Differential Optical Absorption<br />
Spectroscopy technique (Auto-MAX DOAS) has a<br />
more suitable spatial resolution (ranging between<br />
few tens of meters and few hundred meters). Making<br />
it an attractive tool for the measurements of<br />
trace gases on the scale of cities. The Auto-MAX<br />
DOAS fills the knowledge gap of tropospheric pollution<br />
between the local scale of cities and regional<br />
scale.<br />
Methods and results The use of UV/Vis spectroscopy<br />
with a miniature instrument installed on<br />
a car roof enables the detection and quantification<br />
of trace gases such as NO2, SO2, HONO,<br />
and CH2O in the troposphere. The time resolution<br />
of measurements is about 20-30 seconds and<br />
the spatial resolution from this method is ranging<br />
between tens of meters and a few hundred<br />
meters depending on the actual integration time<br />
and the driving speed of the car. The detection<br />
limit of NO2 is about 1 ppb, depending on the<br />
observation geometry. In contrast to in-situ techniques,<br />
from continuous Auto-MAX DOAS observations<br />
the integrated amount of trace gases (integrated<br />
over the altitude) is derived. Here we<br />
present the results of NO2 Vertical Column Densities<br />
(VCDs) from Auto-MAX DOAS measurements.<br />
Figure 2.4(A): the route of the Auto-MAX<br />
DOAS when driving from Brussels (Belgium) to<br />
Heidelberg (Germany), (B) The Vertical Column<br />
Densities (VCDs) along the route retrieved from<br />
these measurements. The VCDs retrieved by this<br />
method can be used for comparison/evaluation of<br />
satellite measurements over Urban areas with the<br />
advantage of having a better spatial resolution<br />
(i.e. the ability to see the gradients of the trace<br />
gases within the satellite pixel).<br />
Outlook/Future work Further improvement<br />
of the Auto-MAX DOAS is planned for the near<br />
future. This includes optimization of time resolution<br />
and spatial resolution. The expected improvement<br />
in time resolution will be achieved by<br />
using a newer generation of spectrometers with<br />
detectors (QE65000) with a higher quantum efficiency<br />
(up to 90 percent) and a better light<br />
throughput compared to the one used here. This<br />
will reduce the total integration time (i.e.improve<br />
the time resolution) by about one order of magnitude<br />
which will also improve the spatial resolution<br />
of the Auto-MAX DOAS.<br />
Funding International Max Plank Research<br />
School scholarship.<br />
Main publications Under preparation.
22 CHAPTER 2. ATMOSPHERE AND REMOTE SENSING<br />
2.1.5 NOVAC - Network for Detection of Volcanic and Atmospheric Change<br />
Christoph Kern<br />
Abstract A novel passive DOAS instrument was designed and built explicitly for the measurement<br />
of volcanic emissions in the scope of the NOVAC project. The first measurements with the instrument<br />
prototype were conducted at Mt. Etna, Sicily.<br />
Figure 2.5: Left panel: example results of an SO2 flux measurement on Oct. 2, 2006 az Mt. Etna.<br />
Each graph represents a MAX DOAS scan through the volcanic plume. The integral over the entire<br />
scan yields the amount of SO2 in the plume cross section. By measuring the wind speed, the flux can<br />
subsequently be derived. The photo on the right shows the measurement geometry.<br />
Background NOVAC is an EU funded project<br />
started in October 2005 with the aim to establish<br />
a global network of stations for the quantitative<br />
measurement of volcanic gas emissions.<br />
The project is based on a newly designed scanning<br />
mini-DOAS instrument. Primarily, the instruments<br />
will be used to provide new parameters<br />
in the toolbox of the observatories for risk<br />
assessment, gas emission estimates and geophysical<br />
research on the local scale. In addition to this,<br />
data will be exploited for other scientific purposes,<br />
e.g. global estimates of volcanic gas emissions and<br />
large scale volcanic correlations. Moreover, the instruments<br />
also allow studies of climate change and<br />
studies of stratospheric ozone depletion. In particular,<br />
large scale validation of satellite instruments<br />
for observing volcanic gas emissions will be possible<br />
for the first time, thus bringing the observation<br />
of volcanic gas emissions from space a significant<br />
step forward [Khokhar et al. , 2005].<br />
Methods and results During the first year of<br />
the project, the main emphasis was on the design<br />
and production of a fully functional prototype of<br />
a scanning DOAS instrument specifically suited<br />
for the measurement of volcanic emission fluxes.<br />
The first measurements were conducted with this<br />
prototype at Mt Etna, Sicily, Italy, in September<br />
2006 (see Figure 2.5). During this measurement<br />
campaign, it was established that the proto-<br />
type is capable of measuring both SO2 and BrO<br />
in volcanic plumes, as well as the wind speed inside<br />
the plume. By combining this information,<br />
BrO/SO2 ratios and real-time SO2 fluxes can be<br />
compiled. The instruments are designed to operate<br />
on a stand-alone basis over long periods of<br />
time. Therefore, a large amount of data will be<br />
compiled, and a database for archiving this data<br />
was designed and tested. A fully functional search<br />
mask was conceived to allow quick access to data<br />
of interest.<br />
Outlook/Future work The next step is to install<br />
a larger number of NOVAC instruments at<br />
the respective sites. Besides the studies mentioned<br />
above, we also plan to conduct investigations<br />
with respect to chemical components and<br />
processes taking place inside volcanic plumes. After<br />
validating satellite measurements of volcanic<br />
emissions, worldwide monitoring will be possible<br />
and global estimates of volcanic gas emissions<br />
(SO2, BrO, CS2) will be compiled. These will allow<br />
us to analyze the impact of volcanic emissions<br />
on global climate change and tropospheric chemistry.<br />
Funding EU Project: NOVAC<br />
Main publications www.novac-project.eu
2.1. TROPOSPHERIC RESEARCH GROUP 23<br />
2.1.6 Enhancement and improvement of the DOAS software DOASIS;<br />
Development of the NOVAC database<br />
Thomas Lehmann<br />
Abstract The existing DOASIS framework for DOAS measurements and evaluations was enhanced<br />
by including new functions, control of new spectrometers and correction of software bugs.<br />
The NOVAC (Network for Observation of Volcanic and Atmospheric Change) project will provide<br />
continuous gas measurements of 15 - 25 active volcanos. For the estimated 1 billion or more spectra,<br />
a sophisticated and high performance database is being developed.<br />
Figure 2.6: Screenshot of the standard screen of<br />
DOASIS. A measured spectrum can be seen in the<br />
big window.<br />
Background To use the Differential Optical<br />
Absorption Spectroscopy (DOAS), an efficient<br />
software basis is needed. The DOASIS framework<br />
covers the whole range from hardware support,<br />
data management to the evaluation process<br />
[Kraus, 2005].<br />
The huge amount of spectra an of parameters per<br />
spectrum in the NOVAC project can only be evaluated<br />
reasonably with a large and fast database<br />
system. An emphasis has to be placed on the<br />
programming of searches inside the database to<br />
ensure that all scientists of the collaboration can<br />
find the data that fit their needs.<br />
Methods and results The programming of<br />
DOASIS took place inside the Microsoft .NET<br />
environment, using C# and JScript as programming<br />
languages. The communication with the<br />
spectrometers works via ActiveX controls. Several<br />
new spectrometers (Ocean Optics’ x4000 series,<br />
QE65000) were implemented into the framework.<br />
By analyzing the code step by step, existing errors<br />
have been removed and a documentation was<br />
begun. Generally, the whole system was more<br />
adapted to the user requirements. DOASIS is<br />
used by various groups world-wide and new releases<br />
are published on a regular basis.<br />
As database system for NOVAC, a MySQL<br />
database is used. Storing and querying the data is<br />
Figure 2.7: Screenshot of the search page of the<br />
NOVAC database. The input form is on top, below<br />
the table of results.<br />
done with the programming language PHP. The<br />
whole system will run on a Linux-cluster.<br />
For conducting searches in the database, various<br />
search- and sorting-options are implemented that<br />
are individually adjustable for the different user<br />
groups. The database is used via webinterfaces.<br />
Found scans and spectra can be <strong>download</strong>ed as<br />
a package or can be plotted directly from the<br />
database.<br />
A precise structure of the database and a modular<br />
programming are important to guarantee later<br />
changes and scalability. An emphasis has to be<br />
placed on the performance optimization, where<br />
satisfying results can often be found empirically<br />
only. The search for data and the import of data<br />
already work for the most part.<br />
Outlook/Future work The next steps in programming<br />
DOASIS will be primarily the verification<br />
and adaption of the mathematical evaluation<br />
routines, furthermore continuous changes in the<br />
user interface.<br />
Concerning NOVAC, the next steps will be to<br />
configure the database in a way that it can be<br />
easily modified to be used locally in the associated<br />
observatories, furthermore the improvement<br />
to high performance and the extension of the<br />
plotting function.<br />
Funding NOVAC
24 CHAPTER 2. ATMOSPHERE AND REMOTE SENSING<br />
2.1.7 Long-Path-DOAS Measurements of VOCs and HOx precursors in<br />
Mexico City during MCMA-2006<br />
André Merten ( Philip Sheehy 1 , Rainer Volkamer 1,2 )<br />
1 MIT, Cambridge, MA 02139; 2 UC San Diego, La Jolla, CA 92093<br />
Abstract Two Long-Path-DOAS instruments were installed in Mexico City in March 2006 as part of<br />
MCMA2006 field campaign to measure VOC and radical precursors of HOx (Glyoxal, HCHO, HONO)<br />
and other species in a megacity urban environment.<br />
Toluene time series from different light paths<br />
Mexico City March 2006<br />
200<br />
180<br />
160<br />
140<br />
120<br />
100<br />
80<br />
60<br />
40<br />
20<br />
0<br />
04.03 05.03 06.03 07.03 08.03 09.03 10.03 11.03<br />
date [UTC]<br />
toluene light path 1 to reflector at ground<br />
toluene light path 2 to reflector at water tower<br />
Toulene [ppb]<br />
Opitical density<br />
1.0x10 -2<br />
0.5x10 -2<br />
0<br />
-0.5x10 -2<br />
-1.0x10 -2<br />
Naphthalene fit result Mexico City 2006 DOAS#1<br />
08.03.2006 14:32:43 UTC<br />
274 276 278 280 282 284 286<br />
wavelength nm<br />
measurement (RMSE= 6,12E-4 ∆= 4,90E-3)<br />
naphthalene (5,07E-1+/-1,0E-1)ppb<br />
9,58E+9cm -3 CD=1,97E+15 mean OD=3,83E-3<br />
Figure 2.8: left: time series of different light paths make toluene plume visible. right: sample spectrum<br />
of the polyaromatic specie naphtale<br />
Background Two Long-Path-DOAS instruments<br />
were installed in Mexico City in March<br />
2006 during the MCMA-2006 (Mexico City<br />
Metropolean Area) field campaign as part of<br />
the MILAGRO (Megacity Initiative: Local and<br />
Global Research Observations) project which also<br />
involves airborne measurements and field studies<br />
in other areas of Mexcio. The goal of MILA-<br />
GRO is to improve the knowledge of the chemistry<br />
and transport processes in the Mexico City<br />
atmosphere and use this as a model to describe<br />
the conditions in other megacities and their global<br />
impact. The measurements were performed in collaboration<br />
with Molina Center for Energy and the<br />
Enviroment and UCSD.<br />
Methods and results The DOAS1 telescope<br />
primarily measured aromatic volatile organic compounds<br />
(VOCs) as precursors for secondary organic<br />
aerosol (SOA) formation, among other<br />
species like O3 and SO2. The telescope was oriented<br />
alternately to two reflector arrays at an<br />
altitude of 35m and at the ground. Measured<br />
VOCs included benzene derivatives e.g. toluene,<br />
styrene, phenol, cresols and xylenes, as well as<br />
two ring aromatic compounds, e.g., naphthalene<br />
(Figure 2.8 right panel) and methylnaphthalene.<br />
Episodes of remarkably high concentrations of<br />
toluene (e.g.190 ppb on March 8 left panel) and<br />
styrene (14.5 ppb on March 23) were observed.<br />
DOAS2 was dedicated mainly to measure HOx<br />
radical precursors (Glyoxal, HONO, HCHO, O3).<br />
The NO2 measurement shows a mean daily maximum<br />
of 71ppb with maximal values of 133 ppb.<br />
Glyoxal, a product of VOC oxidation, showed<br />
maximum concentrations between 0.5 and 1.4 ppb<br />
. For the first time during a field campaign a new<br />
fibre optics set up was used to couple the light<br />
source in the telescope and to receive the light<br />
from the reflector. This set-up provides a higher<br />
stability of the alignment and improves the spectral<br />
characteristics of the light source. A particular<br />
focus of the combined DOAS setup was to<br />
assess horizontal gradients of species that were<br />
measured by both instruments on different spatial<br />
scales and directions. While similar values<br />
are measured for NO2, SO2, HONO, HCHO and<br />
O3, the concentrations of VOC differ significantly<br />
on the two different light paths probably due to<br />
plumes of solvents moving through the city (left<br />
panel).<br />
Outlook/Future work The extensive data set<br />
combined with other measurements like meteorological<br />
information will allow to evaluate chemical<br />
models describing the air pollution in megacities.
2.1. TROPOSPHERIC RESEARCH GROUP 25<br />
2.1.8 Long-Path-DOAS Measurements with new fibre optic set-up<br />
André Merten (Jens Tschritter)<br />
Abstract For the first time during a field campaign a new fibre optics set up was used to couple the<br />
light source in the telescope and to receive the light from the reflector. This set-up provides a higher<br />
stability of the alignment and improves the spectral characteristics of the light source.<br />
Figure 2.9: schematic view of the new fibre optic set-up for DOAS devices<br />
Background Long-Path-Telescopes are commonly<br />
used for atmospheric trace gas measurement,<br />
especially in combination with the DOAS<br />
(Differential Optical Absorption Spectroscopy)<br />
analysis technique. Such an instrument combines<br />
the emitting and receiving telescope in one device<br />
with a double-Newton-style set up and a Xe-high<br />
pressure lamp as light source and has a typical size<br />
from 1..2m. Therefore this instrument requires a<br />
high effort in planning and executing of field measurements<br />
and has also a limited signal-to-noise<br />
ratio. The signal-to-noise ratio is limited due to<br />
the inadequate characterization of the spectrum of<br />
the light source. The used Xenon-high pressures<br />
arc lamps are showing strong variation of spectral<br />
structures across the arc. When using a ’shortcut<br />
optics’ to obtain the lamp emission spectrum is<br />
not guaranteed that the same area of the arc is<br />
imaged used in the measurement. This can cause<br />
strong residual structures, which can be misinterpreted<br />
as optical densities. Another problem is<br />
the complicated alignment of the Long-Path telescope,<br />
since all optical elements must be adjusted<br />
exactly to obtain good light throughput, which is<br />
only possible at night and limits it use as an automatic<br />
running air quality monitor. The dimensions<br />
and the weight of the lamp house require<br />
also a certain size and stability of the whole telescope.<br />
A smaller and easier to handle, and more<br />
reliable telescope would extend the range of the<br />
application for DOAS instruments.<br />
Methods and results Transmitting the light<br />
of the lamp by an optical fibre placed in the focus<br />
of the main mirror, instead of the first plane<br />
mirror, was already tested successfully. The lamp<br />
must not be connected mechanically with the tele-<br />
scope anymore and the same area of the arc is imaged<br />
in measurement and short cut regime. Since<br />
the retroreflector is imaged again to its origin<br />
(with a small displacement) emitting and receiving<br />
fibres were combined together in a bundle.<br />
Now as son as the telescope catches the reflector,<br />
the reflected light hits also to the receiving<br />
fibre (Figure 2.9). The system is now much easier<br />
to align and due to the fewer degrees of freedom<br />
much more stable. And in addition, it is also more<br />
efficient. For the quality of the short cut system a<br />
uniform illumination of the receiving fibre is important.<br />
Different reflecting materials were tested<br />
and the best results were reached with a quartz<br />
stray disc that is placed with a small motor directly<br />
in front of the fibre bundle. This set-up was<br />
tested successfully with a telescope with 1,5m focal<br />
length in the visible and near UV ranges and<br />
then used successfully in the MCMA-2006 (Mexico<br />
City Metropolitan Area) campaign in march<br />
2006 measure NO2, HCHO, Glyoxal and other<br />
species. For three weeks no manual realignment<br />
of the telescope was necessary, except for the illumination<br />
of the fibre by the lamp, which is not<br />
automated yet but can be done very simple when<br />
running the short cut optics.<br />
Outlook/Future work The optimal fibre optic<br />
configuration is now a topic of diploma thesis<br />
that should lead to the complete understanding<br />
of the optical behaviour and therefore to a new<br />
generation of DOAS telescopes [see report from<br />
Tschritter, 2.1.13]. The use of fibre optics offers<br />
the possibility to work with other light sources<br />
like LED or SLD and a fast switch between these<br />
sources.
26 CHAPTER 2. ATMOSPHERE AND REMOTE SENSING<br />
2.1.9 Tomographic LP-DOAS measurements of 2D trace gas distributions<br />
in Heidelberg<br />
Participating scientists Denis Poehler, Andreas Hartl, Ulrich Platt<br />
Abstract Two dimensional distributions of trace gases were investigated with relatively high spatial<br />
and temporal resolution by tomographic LP-DOAS technique in the city of Heidelberg. In total<br />
nearly simultaneous measurements along 20 different light paths were performed. Using tomographic<br />
inversion techniques first two dimensional NO2 and SO2 distributions could be achieved.<br />
NNO N O 2<br />
8:30 A M<br />
9.2.2006<br />
w in d<br />
directio n<br />
S O 2<br />
8:30 A M<br />
9.2.2006<br />
w in d<br />
directio n<br />
Figure 2.10: Measurement setup and reconstructed NO2 and SO2 trace gas distributions in the city of<br />
Heidelberg. The white lines in the map of Heidelberg indicate the measured light paths with LP-DOAS<br />
technique. The yellow lines indicate the boxes used for the reconstruction. Center and right panel<br />
show distributions of NO2 and SO2, respectively. Colour scale: 1 unit = 5∗10 11 Molec./cm 3 = 18.9ppb<br />
(preliminary results).<br />
Background LP-DOAS (Long Path-<br />
Differential Optical Absorption Spectroscopy) is<br />
a well known remote sensing technique for measuring<br />
the average concentration of tropospheric<br />
trace gases along extended light paths in the open<br />
atmosphere. In order to retrieve information of<br />
the spatial trace gas distribution tomographic LP-<br />
DOAS measurements are useful. They combine<br />
the measurement along several intersecting light<br />
paths with tomographic inversion techniques and<br />
allow 2 and 3 dimensional retrieval of trace gas<br />
distributions. The development of the ”Multibeam”<br />
LP-DOAS telescope Pundt & Mettendorf<br />
[2005], allows the measurement along several light<br />
paths simultaneously with one instrument. With<br />
the suitable combination of two or more ”Multibeam”<br />
telescopes a good coverage of the investigating<br />
area can be achieved (see Figure 2.10).<br />
Methods and results In a campaign in Heidelberg,<br />
Germany, a measurement set-up encompassing<br />
a total of 20 light paths by using three<br />
”Multibeam” LP-DOAS instruments (placed on<br />
the buildings: IUP, Heidelberger Druckmaschinen<br />
and SAS) is being tested. 18 retro reflector arrays<br />
are installed on different buildings all over<br />
the city, and two reflectors are installed on the<br />
mountains for further three dimensional reconstructions.<br />
The investigated area is about 4 * 4<br />
km 2 above the city centre and covers different ur-<br />
ban areas with different emission sources. In the<br />
detected wavelength range from 285nm to 365nm<br />
the average concentrations of the trace gases NO2,<br />
SO2, O3, HCHO and HONO along each light path<br />
could be retrieved with a temporal resolution below<br />
15 minutes. The first evaluated data from<br />
winter 2005/06 show high accuracy for NO2 (Error<br />
≈ 2%) and SO2 (Error ≈ 4%) mean concentrations.<br />
They allow to derive two-dimensional<br />
distributions for these trace gases above the city.<br />
We were able to create time series of the distributions<br />
for several days. Thus different emission<br />
sources varying strongly in space and time can be<br />
identified. We can localise emissions from traffic<br />
(mainly NO2) at the high traffic roads and resident<br />
heating systems (mainly SO2). In combination<br />
with several weather stations transport of the<br />
gases can be studied. The results are compared<br />
with in-situ monitors.<br />
Outlook/Future work The results demonstrate<br />
that tomographic DOAS measurements can<br />
be used to study emissions and transport of trace<br />
gases and are valuable input to evaluate models<br />
predicting the air quality. From improved measurements<br />
in summer / autumn / winter 2006 we<br />
expect to retrieve the trace distributions of additional<br />
components. To improve the quality of the<br />
reconstructed distributions, we intend to optimize<br />
the reconstruction grid.
2.1. TROPOSPHERIC RESEARCH GROUP 27<br />
2.1.10 DOAS measurements of iodine oxides in the framework of the MAP<br />
project<br />
Katja Seitz (Denis Pöhler, Maria Martin, Torsten Stein, Ulrich Platt)<br />
Abstract The role of iodine oxides as precursors for formation of secondary marine aerosols (SMA)was<br />
investigated by active as well as passive DOAS measurements which were performed in the framework<br />
of the MAP (Marine Aerosol Production) project. During an intensive measurement campaign simultaneous<br />
measurements of halogen oxides were performed at the Mace Head research station (Irish<br />
West Coast) and on board the Celtic Explorer research vessel.<br />
Figure 2.11: Ship Course of the Celtic Explorer, colour indicates biological activity.<br />
Background Recent field and laboratory studies<br />
indicate a great relevance of reactive iodine in<br />
new particle formation processes. Since particles<br />
in the marine atmosphere affect the microphysical<br />
properties of clouds, they have a potential impact<br />
on climate. Objective of MAP was to quantify the<br />
key processes associated with primary (PMA) and<br />
secondary marine aerosol production from natural<br />
sources.<br />
Methods and results To get seasonal information<br />
of the correlation between biological activity<br />
and the iodine oxides as precursor of SMA<br />
two Mini-MAX-DOAS instruments were established<br />
at Mace Head research station. In order<br />
to validate the results of the Mini-MAX-DOAS<br />
and also due to the better detection limit and the<br />
possibility to also measure at nighttime during an<br />
intensive campaign in June additional longpath<br />
DOAS measurements were performed. Simultaneous<br />
there were Mini-MAX-DOAS measurements<br />
on board the Celtic Explorer research vessel cruising<br />
the Northern Atlantic in front of the Irish west<br />
coast. Objective on the Celtic Explorer was to<br />
quantify the particle formation independent from<br />
coastal influence. In first evaluations IO levels<br />
up to ≈ 3.5ppt could be detected at Mace Head<br />
with the Mini-MAX-DOAS as well as with the<br />
longpath DOAS. Also the detection of iodine oxides<br />
was correlated with large particle formation<br />
events. In first evaluations no iodine oxides could<br />
be detected for the ship cruise.<br />
Outlook/Future work In the next step more<br />
sophisticated evaluation of all data have to be performed.<br />
The results will then be compared to informations<br />
available from other groups involved in<br />
MAP e.g. particle formation events, tidal height<br />
and biological activity.<br />
Funding PhD Thesis in the framework of the<br />
MAP project, funded by the European Union.
28 CHAPTER 2. ATMOSPHERE AND REMOTE SENSING<br />
2.1.11 Applicability of light-emitting diodes as light sources for active<br />
DOAS measurements<br />
Holger Sihler (Christoph Kern, Ulrich Platt)<br />
Abstract The spectral stability of light-emitting diodes (LEDs) was studied in view of their applicability<br />
in Long Path Differential Optical A bsorption Spectroscopy (LP-DOAS). Beside a constant<br />
temperature also a highly accurate current source to drive the LEDs was found to be essential.<br />
intensity of LED [a.u.]<br />
10 18<br />
10 19<br />
10 20<br />
10 21<br />
400 420 440 460 480 500 520<br />
10 22<br />
540<br />
wavelength [nm]<br />
Figure 2.12: Spectral emission of a Luxeon LXHL-LR3C high power 3 W royal blue LED (at 700 mA,<br />
10 ◦ C, blue line) in comparison with the absorption cross sections of two trace gases – NO2 (Voigt<br />
2002, red line) and Glyoxal (Volkamer 2005, black line) – which have significant absoption structures<br />
in this spectral range.<br />
Background To date, high pressure xenon arc<br />
lamps have established themselves as the most<br />
common light sources for active DOAS instruments.<br />
However, these have several disadvantages<br />
including poor power efficiency in the required<br />
wavelength region and short lifetime resulting in<br />
high maintenance costs. Modern LEDs potentially<br />
represent a very advantageous alternative<br />
for both LP-DOAS [Kern et al. , 2006] and cavity<br />
enhanced absorption spectroscopy (CEAS) [Ball<br />
et al. , 2004; Langridge et al. , 2006]. Additionally<br />
LEDs are much easier to maintain considering the<br />
risk of explosions and interfering electromagnetic<br />
radiation.<br />
Methods and results As one may notice in<br />
the comparison between the emission of an LED<br />
and the trace gas absorption cross sections (Figure<br />
2.12), the LED spectrum contains some narrowband<br />
structures considered to be etalon structures.<br />
Only a slight variation of these structures<br />
during the measurement process increases<br />
the residual of a DOAS evaluation by one order of<br />
magnitude or even more in comparison to Xenon<br />
arc lamps. Stabilising their emission spectrum is<br />
therefore the key to make LEDs competitive as<br />
DOAS light-sources.<br />
The spectral position of the etalon structure<br />
depends on the chip temperature. A non-zero<br />
heat resistance between chip and heat sink yields<br />
optical density of trace gas [cm2/molecule]<br />
a dependency on both the heat sink tempearture<br />
and the dissipation of electrical energy inside the<br />
chip. In the special case of the LXHL-LR3C an<br />
already attained temperature stabilisation within<br />
0,1 K corresponds to 0,1 % of the current. Hence,<br />
a stabilisation of the LED drive current was found<br />
to be as important as controlling the temperature.<br />
A compact sealed LED housing with a peltiercooled<br />
heatsink and molecular sieve drying agent<br />
was designed to decouple the LED from the ambient<br />
temperature. Together with a standard PIDcontroller<br />
and a current source, the spectral noise<br />
of a LED could be reduced to a value lower than<br />
that of halogen lamps. The stability of an arc<br />
lamp has not been attained yet.<br />
Funding IUP<br />
Outlook/Future work Future experiments<br />
will concentrate on UV-LEDs to detect further<br />
trace gases (e.g., SO2, ClO, or CH2O). Also superluminescent<br />
LEDs (SLEDs) will be studied in<br />
respect to their applicability. The latter provide<br />
very high radiances but are only in the wavelength<br />
region above 650 nm available. Also the application<br />
of an even more precise temperature controller<br />
(TEC) is very promising. A newly customdesigned<br />
current source-TEC combination has to<br />
be tested and compared to industry standard components.
2.1. TROPOSPHERIC RESEARCH GROUP 29<br />
2.1.12 Multi Axis Differential Optical Absorption Spectroscopy (MAX-<br />
DOAS) of Trace Gas and Aerosol Distributions<br />
Roman Sinreich (Rainer Volkamer, Thomas Wagner)<br />
Abstract MAX-DOAS measurements, i.e. DOAS measurements at different elevation angles from<br />
the ground, enable the detection of trace gases in the planetary boundary layer even at low concentrations<br />
due to their long light path at low elevation angles. Furthermore, MAX-DOAS values combined<br />
with radiative transfer modelling can yield distributions of trace gases and aerosols.<br />
Figure 2.13: HONO SCDs on March 6th, 2006, in Mexico City. Enhanced values in the morning were<br />
typical throughout the measurement campaign.<br />
Background For three decades DOAS has been<br />
applied to measure trace gases like e.g. NO2, SO2<br />
or HCHO by means of sunlight [?]. Sunlight passing<br />
through the atmosphere is scattered and absorbed<br />
by gas molecules in the air whereby the<br />
absorption occurs at wavelengths which are characteristic<br />
for each trace gas. This absorption pattern<br />
is suitable to detect and quantify the according<br />
trace gases.<br />
In this study, ground-based DOAS measurements<br />
were performed and their spectra analysed.<br />
By using the measured results and modelled data<br />
from a radiative transfer model, it is possible to<br />
derive trace gas and aerosol distributions.<br />
Methods and results The retrieval of trace<br />
gases by means of DOAS yields Slant Column<br />
Densities (SCDs) which depend on the concentration<br />
of the according trace gas and the light<br />
path of the measurement. Since scattered sunlight<br />
is measured, the light path is not readily defined<br />
and has to be calculated by atmospheric radiation<br />
transport models. Furthermore, different elevation<br />
angles from the ground have to be performed<br />
in order to get information on the vertical profile.<br />
This method is called Multi-Axis-DOAS (MAX-<br />
DOAS) and allows to derive gas and aerosol distributions<br />
near the surface.<br />
Aerosol properties can be derived indirectly by<br />
measurements of gas species whose 3-dimensional<br />
distribution is already known and relatively constant.<br />
E.g. O4, whose concentration is proportional<br />
to the square of the O2 concentration, provides<br />
these qualities. So variations in measured<br />
O4-SCDs are dominated by the aerosol distribution,<br />
which causes different light paths in the atmosphere<br />
[Wagner et al. , 2004].<br />
In March 2006, MAX-DOAS measurements<br />
were performed at several sites in Mexico City in<br />
the framework of MILAGRO (Megacity Initiative:<br />
Local and Global Research Observations, see also<br />
report of Merten et al. 2.1.7 ). Thereby, SCDs<br />
of NO2, CHOCHO, HCHO, O4 and SO2 could be<br />
retrieved. Furthermore, SCDs of HONO at daytime<br />
could be detected for the first time by means<br />
of MAX-DOAS (a typical diurnal cycle of HONO<br />
SCDs is shown in Figure 2.13).<br />
Outlook/Future work The MAX-DOAS values<br />
from Mexico City will be compared with insitu,<br />
active DOAS and satellite measurements.<br />
Moreover, improvements of the technique of deriving<br />
gas and aerosol distributions will allow to<br />
perform the inversion procedure more analytically.<br />
Main publication Sinreich et al. [2006]
30 CHAPTER 2. ATMOSPHERE AND REMOTE SENSING<br />
2.1.13 Third Generation DOAS Telescopes<br />
Jens Tschritter (Andre Merten, Ulrich Platt)<br />
Abstract To get high resolution trace gases measurements in the troposphere, A. Perner and U.<br />
Platt developed an active DOAS System in 1980. Technical improvements in fiber optics now make a<br />
redesign of the classic Active Long-Path system possible in order to use smaller telescopes with easier<br />
handling yet maintaining the same optical properties and light throughput.<br />
A: Axelssons telescope<br />
projected mirror surface<br />
transmittsurface<br />
Receive surface<br />
receive surface<br />
spectrograph<br />
light source<br />
retro<br />
B: 3rd Generation telescope<br />
receive fiber<br />
projected mirror surface<br />
for transmission and receive<br />
transmission fiber<br />
spectr. spectrograph<br />
light source<br />
Figure 2.14: Lightpath of Axelssons System (left) and the Third Generation Telescope (right)<br />
Background Optical Absorption Spectroscopy<br />
is a well known laboratorial analyzing instrument.<br />
Specially for trace gas measurements in the troposphere<br />
the Differential Optical Absorption Spectroscopy<br />
(DOAS) is well established. The classic<br />
experimental set up of a active DOAS system consisting<br />
of a transmitting telescope, which sends<br />
a light beam trough the atmosphere, a retro reflector,<br />
a receiving telescope, a controlling system<br />
and a spectrometer. The telescopes main mirror<br />
is used as transmitting mirror as well as receiving<br />
mirror. This coaxial merge of a transmitting and<br />
receiving telescope as shown in the Fig. 2.14 A<br />
was first described by Axelsson et al. [1990]. The<br />
difficult handling and the size, led to a decrease in<br />
the number of measurements with Axelsson-type<br />
long path systems in the last years. Therefore<br />
passive systems, which are using the sun as light<br />
source, are used more and more for tropospheric<br />
trace gas measurements. However, the active systems<br />
allow measurements at night and with spectral<br />
ranges different from the sunlight. Thus we<br />
decided to develop a smaller long path telescope<br />
with easier handling.<br />
Methods and results Using fibers to conduct<br />
light in the telescope allows to use a defusor plate<br />
as short cut system instead of a retro reflector<br />
to reduce lamp structures and to provide uniform<br />
illumination of the spectrographs field of view,<br />
Abstract<br />
which reduces the measurements residuum. Because<br />
we use no mirrors to conduct the light on<br />
our telescopes main mirror we have no shadows,<br />
so we can use the complete main mirror for sending<br />
and receiving and we gain more light intensity<br />
in the spectrograph. Motors controlled by the<br />
measurement program automatically optimize focus<br />
and direction of our light beam and help to<br />
adjust the optical set up. we experimentally verified<br />
that the intensity coupled into the fiber at<br />
the receiving end should not depend on the focal<br />
length of our telescopes main mirror. This result<br />
of our test-measurements is the base fact for constructing<br />
a smaller telescope with the same light<br />
throughput.<br />
Outlook/Future work If we adapt the f/# of<br />
our spectrometer to that of our telescope we would<br />
be able to construct a very small telescope. This<br />
Third Generation Telescope (fig. 2.14 B) which<br />
can be carried by one person allows measurements<br />
in remote areas. New software applications help<br />
handling the optical set up. Using light emitting<br />
diodes (LED) as light source could help to further<br />
reduce the costs. Thus, we can build a global<br />
measurement network for trace gases in the troposphere<br />
which helps us to understand the atmospheric<br />
chemistry.<br />
retro
2.1. TROPOSPHERIC RESEARCH GROUP 31<br />
2.1.14 Testing a new Near-IR Sensor for Detection of Methane<br />
Markus Woyde , Christian Frankenberg, Thomas Wagner, Ulrich Platt<br />
Abstract A new spectrometer with InGaAs linear image sensor was tested with respect to its<br />
applicability for detecting methane in the near infrared region. Measurements of CH4 cuvettes were<br />
conducted to test its feasibility as well as atmospheric observations using a hill as reflective surface<br />
for sunlight providing a new observation mode.<br />
log(I/I 0 )<br />
expected transmission<br />
−0.1<br />
−0.15<br />
−0.2<br />
−0.25<br />
−0.3<br />
1635 1640 1645<br />
wavelength [nm]<br />
1650 1655 1660<br />
1<br />
0.8<br />
0.6<br />
0.4<br />
0.2<br />
fitted<br />
measured<br />
Unconvolved expected transmission<br />
0<br />
1635 1640 1645<br />
wavelength [nm]<br />
1650 1655 1660<br />
Figure 2.15: top panel: Displayed is the optical density of a cuvette filled with methane; measured<br />
data is shown in green, IMAP-DOAS fit in blue. bottom: Unconvolved expected transmision resolved<br />
in a wavelength-grid corresponding to pixels on the sensor.<br />
Background Methane is, after carbon dioxide,<br />
the second most important anthropogenic<br />
greenhouse gas, contributing directly 0.48 Wm −2<br />
to the total anthropogenic radiative forcing of<br />
2.43 Wm −2 by well-mixed greenhouse gases<br />
(IPCC, 2001). Its individual source strengths<br />
need to be quantified more precisely. There have<br />
already been successful satellite-based CH4 measurements<br />
by SCIAMACHY onboard ENVISAT<br />
using the DOAS-technique providing a global coverage<br />
but with a limited temporal and spatial resolution.<br />
Therefore it is desirable to compensate<br />
for these limitations by developing a ground-based<br />
instrument.<br />
Funding IUP<br />
Methods and results The sensor properties<br />
such as dark current, offset and linearity were<br />
characterized. After that measurements of CH4<br />
cuvettes were performed, covering a spectral<br />
range from about 1600nm to 1670nm (see figure<br />
2.15).The concentration was analyzed by means of<br />
IMAP-DOAS developed by C. Frankenberg. As<br />
one can see there is already a good agreement between<br />
data and fit. For better results a more detailed<br />
investigation of the slit-function is nescessary.<br />
Further, the sensor was tested in Heidelberg<br />
using a new observation mode. A hill at about<br />
2.1km was used as reflective area for sunlight,<br />
the reference spectrum was obtained by observing<br />
sunlight directly reflected into the spectrograph<br />
by an aluminium plate, so that it is possible to<br />
determine the CH4 concentration along the way<br />
between spectrograph and hill.<br />
Outlook/Future work Future work will encompass<br />
improving the instrument by a better<br />
temperature stabilization and preparing it for field<br />
campaigns. This would enable us to examine the<br />
differences between modeled data and measured<br />
data by SCIAMACHY. Furthermore an interesting<br />
application might be searching for leakages in<br />
gas pipelines or measuring water vapor in the atmosphere.<br />
Main publications ?
32 CHAPTER 2. ATMOSPHERE AND REMOTE SENSING<br />
References<br />
Allen, G., Mather, T.A., McGonigle, A.J.S., Aiuppa, A., Delmelle, P., Davison, B., Bobrowski,<br />
N., Oppenheimer, C., Pyle, D.M., & Inguaggiato, S. 2006. Sources, size distribution and downwind<br />
grounding of aerosols from Mt. Etna. Journal of Geophysical Research, 111(D10302).<br />
doi:10.1029/2005JD006015.<br />
Axelsson, H., Galle, B., Gustavson, K., P., Regnason, & Rudin, M. 1990. A transmitting/receiving<br />
telescope for DOAS-measurements using reflector technique. Pages 641–644 of: Series, OSA Technical<br />
Digest (ed), Digest of Tropical Meeting on Optical Remote Sensing of the Atmosphere, vol. 4.<br />
Optical Society of America.<br />
Ball, S. M., Langridge, J. M., & Jones, R. L. 2004. Broadband cavity enhanced absorptions spectroscopy<br />
using light-emitting diodes. Chem. Phys. Lett., 398, 68–74.<br />
Barkly, M.P., Frieß, U., & Monks, P.S. 2006. Measuring atmospheric CO2 from space using Full<br />
Spectral Initiation (FSI) WFM-DOAS. Atmospheric Chemistry and Physics Discussion, 6, 2765–<br />
2807.<br />
Barrie, L. A., & Platt, U. 1997. Arctic tropospheric chemistry. Overview to Tellus special issue, 49B,<br />
450–454.<br />
Bobrowski, N., & Platt, U. 2006. Bromine Monoxide Studies in Volcanic Plumes. Journal of Volcanology<br />
and Geothermal Research. submitted 31. 7. 2005.<br />
Bobrowski, N., Hönninger, G., Lohberger, F., & Platt, U. 2006a. I-DOAS: A new monitoring technique<br />
to study the 2D distribution of volcanic gas emissions. Journal of Volcanology and Geothermal<br />
Research, 150(4), 329–338.<br />
Bobrowski, N., Burton, M.R., Caltabiano, T., Salerno, G., & Platt, U. 2006b. Measurements of<br />
the Halogen and SO2 Flux from Mt. Etna in September 2003. Geophysical Research Letters. in<br />
preparation.<br />
Bobrowski, N., Glasow, R.v., Aiuppa, A., Inguaggiato, S., Louban, I., Ibrahim, O.W., & Platt,<br />
U. 2006c. Reactive Halogen Chemistry in Volcanic Plumes. Journal of Geophysical Research.<br />
accepted,2006JD007206.<br />
Bossmeyee, Jens. 2006. Studies of Aldehydes in an Atmosphere Simulation Chamber, Degradation of<br />
Higher Aldehydes by Nitrate Radicals. PhD Thesis, <strong>Universität</strong> Heidelberg.<br />
Bruns, M., Buehler, S.A., Burrows, J.P., Richter, A., Rozanov, A., Wang, P., Heue, K.-P., Platt, U.,<br />
Pundt, I., & Wagner, T. 2006. NO2 Profile retrieval using airborne multi axis UV-visible skylight<br />
absorption measurements over central Europe. Atmospheric Chemistry and Physics, 6, 3049–3058.<br />
Burkholder, J. B., Curtius, J., Ravishankara, A. R., & Lovejoy, E. R. 2004. Laboratory studies of the<br />
homogeneous nucleation of iodine oxides. Atmos. Chem. Phys., 4, 19–34.<br />
Cauer, H. 2004. Schwankungen der Jodmenge der Luft in Mitteleuropa, deren Ursachen und deren<br />
Bedeutung <strong>für</strong> den Jodgehalt unserer Nahrung (Auszug). Angewandte Chemie 52, 11, 625–628.<br />
Cox, R. A., Bloss, W. J., Jones, R. L., & Rowley, D. M. 1999. OIO and the Atmospheric Cycle of<br />
Iodine. Geophys. Res. Lett., 26 (13), 1857–1860.<br />
Frieler, K., Rex, M., Salawitch, R.J., Canty, T., Streibel, M., Stimpfle, R.M., Pfeilsticker, K., Dorf,<br />
M., Weisenstein, D.K.and Godin-Beekmann, S., & von der Gathen, P. 2006. Towards a better quantitative<br />
understanding of polar stratospheric ozone loss. Geophysical Research Letters. submitted.<br />
Frieß, U., & Platt, U. 2006a. Absolute concentration measurements by DOAS at ”Zero Visibility”. in<br />
preparation.<br />
Frieß, U., & Platt, U. 2006b. Tropospheric IO in the Antarctic Coastal Region - Observations by<br />
Multi-Axis DOAS. in preparation.<br />
Frieß, U., Monks, P.S., Remedios, J.J., Rozanov, A., Sinreich, R., Wagner, T., & Platt, U. 2006.<br />
MAX-DOAS O4 measurements: A new technique to derive information on atmospheric aerosols.<br />
(II) Modelling studies. Journal of Geophysical Research, 111(D14203). doi:10.1029/2005JD006618.
2.1. TROPOSPHERIC RESEARCH GROUP 33<br />
Frins, E., Bobrowski, N., Platt, U., & Wagner, T. 2006. Tomographic multiaxis-differential optical<br />
absorption spectroscopy observations of Sun-illuminated targets: a technique providing well-defined<br />
absorption paths in the boundary layer. Applied Optics, 45(24), 6227–6240.<br />
Hak, Claudia. 2006. VARIABILITT VON FORMALDEHYD-KONZENTRATIONEN IN DER VER-<br />
SCHMUTZTEN PLANETAREN GRENZSCHICHT: MESSUNGEN IM BALLUNGSRAUM VON<br />
MILANO. PhD Thesis, <strong>Universität</strong> <strong>Karls</strong>ruhe.<br />
Hartl, A., Song, B.C., & Pundt, I. 2006. 2-D reconstruction of atmospheric concentration peaks from<br />
horizontal long path DOAS tomographic measurements: parametrisation and geometry within a<br />
discrete approach. Atmospheric Chemistry and Physics, 6, 847–861.<br />
Hoffmann, T., O’Dowd, C. D., & Seinfeld, J. H. 2001. IO homogeneous nucleation. An explanation<br />
for coastal new particle formation. Geophys. Res. Lett., 28 (10), 1949–1952.<br />
Kern, C., Trick, S., Rippel, B., & Platt, U. 2006. Applicability of light-emitting diodes as light sources<br />
for active DOAS measurements. Applied Optics, 45, 2077–2088.<br />
Khokhar, M. F., Frankenberg, C., Van Roozendael, M., Beirle, S., Kühl, S., Richter, A., Platt, U., &<br />
Wagner, T. 2005. Satellite Observations of Atmospheric SO2 from Volcanic Eruptions during the<br />
Time-Period of 1996 to 2002. Adv. Space Res., 36(5), 879–887.<br />
Kraus, Stefan. G. 2005. DOASIS - A Framework Design for DOAS. PhD Thesis, <strong>Universität</strong><br />
Mannheim, <strong>Universität</strong> Heidelberg.<br />
Langridge, J. M., Ball, S. M., & Jones, R. L. 2006. A compact broadband cavity enhanced absorption<br />
spectrometer for detection of atmospheric NO2 using light emitting diodes. Analyst, 131, 916–922.<br />
Leck, C., & Bigg, E. K. 1999. Aerosol production over remote marine areas - A new route. Geophys.<br />
Res. Lett., 26, 3577–3580.<br />
Lee, J. S., Kim, Y. J., Geyer, A., & Platt, U. 2006. Simultaneous Measurements of Atmospheric Trace<br />
Gases and Atmospheric Visibility by DOAS System. in preparation.<br />
Leigh, R. J., Corlett, G. K., Frieß, U., & Monks, P. S. 2006. concurrent multi axie differential optical<br />
absorption spectroscopy system for the measurement of tropospheric nitrogen dioxide. Applied<br />
Optics, 45(28), 7504–7518.<br />
Lindberg, S., Brooks, S., Lin, C. J., Scott, K. J., Landis, M. S., Stevens, R. K., Goodsite, M., &<br />
Richter, A. 2002. Dynamic Oxidation of Gaseous Mercury in the Arctic Troposphere at Polar<br />
Sunrise. Environ. Sci. Technol., 36, 1245–1256.<br />
Lohberger, F., Hönninger, G., & Platt, U. 2004. Ground-based imaging differential optical absorption<br />
spectroscopy of atmospheric gases. Applied Optics, 43(24), 4711–4717.<br />
Louban, I, Bobrowski, N., Rouwet, D., Inguaggiato, S., & Platt, U. 2006. Imaging DOAS for Volcanological<br />
Applications. in preparation.<br />
Mettendorf, K.U., Hartl, A., & Pundt, I. 2006. An Indoor Test Campaign of the Tomography Long<br />
Path Differential Optical Absorption Spectroscopy (DOAS) Technique. Journal of Environmental<br />
Monitoring, 8, 279–287.<br />
O’Dowd, C., Jimenez, J. L., Bahreini, R., Flagan, R. C., Seinfeld, J. H., Hämeri, K., Pirjola, L., ans<br />
S. G. Jennings, M. Kulmala, & Hoffmann, T. 2002. Marine aerosol formation from biogenic iodine<br />
emissions. Nature, 417, 632–636.<br />
Oppenheimer, C., Tsanev, V. I., Braban, C. F., Cox, R. A., Adams, J. W., Aiuppa, A., Bobrowski, N.,<br />
Delmelle, P., Barclay, J., & McGonigle, A. J. 2006. BrO formation in volcanic plumes. Geochimica<br />
et Cosmochimica Acta, 70, 2935–2941.<br />
Platt, U. 1994. Differential optical absorption spectroscopy (DOAS). In: Sigrist, M. W. (ed), Air<br />
Monitoring by Spectroscopic Techniques. New York: John Wiley.<br />
Platt, U., & Hönninger, G. 2003. The Role of Halogen Species in the Troposphere. Chemosphere 52,<br />
2, 325–338.
34 CHAPTER 2. ATMOSPHERE AND REMOTE SENSING<br />
Platt, U., & Janssen, C. 1996. Observation and role of the free radicals NO3, ClO, BrO and IO in the<br />
Troposphere. Faraday Discuss., 100, 175–198.<br />
Platt, U., Allan, W., & Lowe, D. 2004. Hemispheric Average Cl Atom Concentration from 13 C/ 12 C<br />
Ratios in Atmospheric Methane. Atmos. Chem. Phys., 4, 2393–2399.<br />
Platt, U., Pfeilsticker, K., & Vollmer, M. 2006. Chapter 24: Atmospheric Optics. In: Träger, F. (ed),<br />
Springer Handbook of Lasers and Optics. Heidelberg: Springer.<br />
Pundt, I., & Mettendorf, K. U. 2005. Multibeam long-path differential optical absorption spectroscopy<br />
instrument: a device for simultaneous measurements along multiple light paths. Applied Optics,<br />
44(23). 4985 - 4994.<br />
Roscoe, H.K., Kreher, K., & Friess, U. 2001. Ozone loss episodes in the free Antarctic troposphere,<br />
suggesting a possible climate feedback. Geophys. Res. Lett., 28, 2911–2914.<br />
Sebastian, O., Geyer, A., Hönninger, G., Platt, U., Sciare, J., & Mihalopoulos, N. 2006. The influence<br />
of radicals on DMS oxidation in the Eastern Mediterranean marine boundary layer. in preparation.<br />
Simpson, W.R., Carlson, D., Hönninger, G., Douglas, T.A., Sturm, M., Perovich, D., & Platt, U.<br />
2006. First-year sea-ice contact predicts bromine monoxide (BrO) levels better than potential frost<br />
flower contact. Atmospheric Chemistry and Physics Discussion, 6, 1105111066.<br />
Sinreich, R., Volkamer, R., Filsinger, F., Frieß, U., Kern, C., Platt, U., Sebastián, O., & Wagner, T.<br />
2006. MAX-DOAS detection of glyoxal during ICARTT 2004. Atmospheric Chemistry and Physics<br />
Discussion, 6, 9459–9481.<br />
Stein, Thorsten. 2006. Diplomarbeit, <strong>Universität</strong> Heidelberg.<br />
Stutz, J., Hebestreit, K., Alicke, B., & Platt, U. 1999. Chemistry of halogen oxides in the troposphere:<br />
comparison of model calculations with recent field data. J. Atmos. Chem., 34, 65–85.<br />
Stutz, J., Hebestreit, K., Hönninger, G., & U., Platt. 2006. Simultaneous measurement of iodine oxide<br />
and nitrogen dioxide at Mace Head, Ireland. in preparation.<br />
von Glasow, R., & Crutzen, P.J. 2004. Model study of multiphase DMS oxidation with a focus on<br />
halogens. Atmos. Chem. Phys., 4, 589–608.<br />
von Glasow, R., von Kuhlmann, R., Lawrence, M. G., Platt, U., & Crutzen, P.J. 2004. Impact of<br />
reactive bromine chemistry in the troposphere. Atmos. Chem. Phys., 4, 2481 – 2497.<br />
Wagner, T., Dix, B., v. Friedeburg, C., Frieß, U., Sanghavi, S., Sinreich, R., & Platt, U. 2004.<br />
MAX-DOAS O4 measurements: A new technique to derive information on atmospheric aerosols -<br />
Principles and information content. Journal of Geophysical Research, 109, D22205.<br />
Wang, P., Richter, A., Bruns, M., Burrows, J.P., Scheele, R., Junkermann, W., Heue, K.-P., Wagner,<br />
T., Platt, U., & Pundt, I. 2006. Airborne multi-axis DOAS measurements of tropospheric SO2<br />
plumes in the Po-valley, Italy. Atmospheric Chemistry and Physics, 6, 329–338.<br />
Wennberg, P.O., Hanisco, T. F., Jaegle, L., Jacob, D. J., Hintsa, E. J., Lanzendorf, E. J., Anderson,<br />
J.G., Gao, R. S., Keim, E. R., Donnelly, S. G., Negro, L. A. Del, Fahey, D. W., McKeen, S. A.,<br />
Salawitch, R. J., Webster, C. R., May, R. D., Herman, R. L., Proffitt, M. H., Margitan, J. J., Atlas,<br />
E. L., Schauffler, S. M., Flocke, F., McElroy, C. T., & Bui, T. P. 1998. Hydrogen radicals, nitrogen<br />
radicals, and the production of O3 in the upper troposphere. Science, 279, 49–53.<br />
Xie, P., Geyer, A., Volkamer, R., Yu, Y., Platt, U., Galle, B., & Chen, L. 2006. Investigation of the<br />
distribution of aromatic hydrocarbons in Shanghai (China). in preparation.
2.2. STRATOSPHERIC RESEARCH GROUP 35<br />
2.2 Stratospheric Research Group<br />
Klaus Pfeilsticker<br />
Group members<br />
Prof. Dr. K. Pfeilsticker, Head of group<br />
Dr. A. Butz, Post Doc<br />
Dr. M. Dorf, Post Doc<br />
S. Kreycy, Diploma Student<br />
Dipl. Phys. L. Kritten, PhD Student<br />
M. Sc. C. Prados, PhD Student<br />
B. Simmes, Diploma Student<br />
Dr. F. Weidner, left by May 2006<br />
Abstract<br />
Our stratospheric research concentrates on an improved understanding of the photochemical processes<br />
controlling upper tropospheric and lower stratospheric (UT/LS) ozone and its link to climate. This<br />
overall objective is achieved by (a) high-precision spectroscopic measurements of trace gases (O3, NO2,<br />
BrO, OClO, IO, OIO, . . . ) important for UT/LS ozone, and (b) by comparing of the obtained results<br />
with outputs of global 3-dimensional chemistry transport models (CTM). Further, the measurements<br />
are used to infer the spectral solar irradiance and the limb radiance of the sky in the UV/Vis spectral<br />
range. The various studies are performed by spectroscopic techniques employed on aircrafts (Falcon,<br />
HALO) and high-altitude balloons (LPMA/DOAS, LPMA/IASI, MIPAS-B) during international field<br />
campaigns.<br />
Tangent height / km<br />
30<br />
25<br />
20<br />
15<br />
10<br />
0.1 ppt<br />
Retrieved IO SCD<br />
1x and 2x IO detection limit<br />
Modeled IO SCD assuming multiples of 0.1 ppt I y<br />
Same as but omitting OIO photolysis<br />
Tropopause altitude<br />
0 2 4 6 8<br />
IO SCD / (10 13 molecules cm -2 )<br />
IO<br />
Retrieved OIO SCD<br />
1x OIO detection limit<br />
Modeled OIO SCD assuming multiples of 0.1 ppt I y<br />
Same as but omitting OIO photolysis<br />
Tropopause altitude<br />
OIO SCD / (10 13 molecules cm -2 -1 0 1 2 3<br />
)<br />
Figure 2.16: IO (left panel) and OIO (right panel) SCDs as a function of tangent height. Measured<br />
data are shown as black open boxes with error bars. The theoretical detection limits inferred from<br />
the observations are plotted as thick red lines. For IO, additionally twice the detection limit is<br />
shown. IO SCDs exceed the detection limit below 20 km. The observations are to be compared to<br />
modeled IO and OIO SCDs assuming different amounts of total gaseous inorganic iodine (Iy). Iodine<br />
loadings are chosen in multiples of 0.1 ppt. Modeled SCDs are shown for two scenarios: One allows<br />
for OIO photolysis (gray solid lines), the other scenario omits OIO photolysis (gray dotted lines). In<br />
the range of the UT/LS (14 - 19 km), IO observations/upper limits are roughly consistent with the<br />
model run assuming 0.3 ppt and 0.4 ppt Iy if OIO photolysis is considered and omitted, respectively.<br />
The detection limits for OIO are consistent with more than 1 ppt and 0.3 - 0.4 ppt Iy considering and<br />
omitting OIO photolysis, respectively.<br />
OIO<br />
30<br />
25<br />
20<br />
15<br />
10<br />
Tangent height / km
36 CHAPTER 2. ATMOSPHERE AND REMOTE SENSING<br />
Scientific objectives<br />
• Photochemistry and budget of upper tropospheric and stratospheric bromine (BrO, Bry) and<br />
its relevance to stratospheric ozone<br />
• Photochemistry and budget of upper tropospheric and stratospheric iodine (IO, OIO, Iy) [Butz,<br />
2006; Schwärzle, 2005; Figure 2.16]<br />
• Stratospheric chemistry and budget of odd nitrogen (NO, NO2, HNO3, ClONO2) [Butz, 2006];<br />
• Partitioning and photochemistry of chlorine and bromine in the high-latitude stratosphere and<br />
the assessment of the instantaneous in-situ ozone loss rate [Butz et al. , 2006b]<br />
• Prominent natural and anthropogenic sources contributing to the trace gas composition of the<br />
tropical tropopause and lowermost stratosphere (TTL/LMS) [Reichl, 2005; Schwärzle, 2005]<br />
• Temporal and spatial dependencies of stratospheric radical concentrations (e. g. NO2/N2O5 and<br />
BrO/OClO) [Section 2.2.5]<br />
• Validation of remote sensing satellite instruments such as ILAS/ADEOS, POAM II and III,<br />
SAGE II and III, ODIN/OSIRIS, GOME/ERS-2, and SCIAMACHY/ENVISAT [Butz et al. ,<br />
2006a; Dorf et al. , 2006a]<br />
Background<br />
In recent years it became clear that the destructive influence on the stratospheric ozone layer needs<br />
further investigation and monitoring. It is triggered by a changing atmospheric composition due to<br />
the anthropogenic emission of a variety of ozone harmful and greenhouse gases. In addition, research<br />
(to which our research group is also largely contributing) is indicating that naturally emitted and<br />
mostly short-lived halogen bearing organic species may significantly contribute to the burden of ozone<br />
harmful halogens (Cl, Br, and I). Most important, and evident, appears their efficient transport from<br />
the various terrestrial and oceanic sources through the tropical troposphere into the lower stratosphere<br />
of the tropics. It appears worthwhile to identify the various sources of these organic gases, their fate,<br />
and their inorganic products in the tropical atmosphere. This approach is presently followed with<br />
various experimental and theoretical methods used by the research group and the various cooperating<br />
partners. Further, processes leading to stratospheric ozone loss, e. g. in the polar region in winter or<br />
the decline in mid-latitude ozone, need to be investigated.<br />
A second objective of our research relies on the experimental skills of the research group and the<br />
known deficits in properly understanding the spectral solar irradiance and its variability. Improving<br />
the knowledge of the latter is most important in particular for the UV-A and B spectral ranges. This<br />
supports a better understanding of possible sun-climate interactions, the atmospheric photochemistry<br />
and energy budget, and is of interest for the solar cell industry.<br />
Main methods<br />
The research objectives imply to probe the stratosphere by high-altitude (∼ 40 km) balloon soundings.<br />
For that purpose the research group is operating (1) a self-made two channel UV/Vis spectrometer for<br />
direct sun measurements, and (2) a novel limb-scanning UV/Vis spectrometer. Both spectrometers<br />
are deployed on the joint French-German LPMA/DOAS (Laboratoire de Physique Moléculaire et<br />
Applications/Differential Optical Absorption Spectroscopy) balloon payload. Jointly with our direct<br />
sun measurements, our French partner operates a near-IR Fourier-Transform spectrometer to measure<br />
mid-IR absorbing gases. Balloon flights are regularly performed at high (Kiruna, Sweden), mid (Aire<br />
sur l’Adour, France), and low latitudes (Teresina, Brazil). Interpretation of the measurements also<br />
involves radiative transfer studies and 1-D photochemical modelling on air-mass trajectories provided<br />
by our partner Meteorologisches <strong>Institut</strong>, FU-Berlin, Germany. The model’s required initialization<br />
is provided through outputs from a 3-D chemistry model (CTM-SLIMCAT) run by the <strong>Institut</strong>e for<br />
Atmospheric Science – School of Earth and Environment, University of Leeds, UK.<br />
Our scientific objectives are primarily achieved through measurements of stratospheric radicals (O3,<br />
NO2, BrO, OClO, IO, OIO, . . . ) and related trace gases (CH4, N2O, HCl, NO, HNO3, ClONO2, . . . )<br />
and the interpretation of the results with respect to the photochemistry of stratospheric ozone. Major<br />
research objectives involve studies of the processes leading to the formation of the ozone hole during<br />
polar winter, the global decline in stratospheric ozone, and since recently the photochemistry and<br />
transport in the tropical tropopause layer (TTL) and lowermost stratosphere (LMS). The research of<br />
the group is largely contributing to various international assessments on stratospheric ozone (WMO<br />
report in 1998, 2002, and 2006), organized by the World Meteorological Organisation (WMO).
2.2. STRATOSPHERIC RESEARCH GROUP 37<br />
Main activities<br />
• The retrieval and interpretation of data from past field campaigns<br />
• Dissemination of the results obtained from previous atmospheric soundings<br />
• Performance of a mini-DOAS flight on the MIPAS-B payload at Kiruna (67.9 ◦ N, 21.1 ◦ E) on<br />
March 1, 2006<br />
• The design and set-up of a novel mini-DOAS instrument for aircraft applications<br />
Funding<br />
Funding comes through research contracts with European Community (EU-EVK2-CT-2000-00059 and<br />
505390-GOCT-CT-2004), the Bundesministerium <strong>für</strong> Bildung und Forschungs (BMBF) through the<br />
DLR (DLR-50FE0017) and the Deutsche Forschungsgemeinschaft (DFG PF384/3-1 and PF384/5-1).<br />
Cooperation within the institute and with groups outside the institute<br />
The research group closely cooperates with the following institutions as, for example, documented in<br />
joint peer-reviewed publications:<br />
1. Forschungszentrum Jülich GmbH, <strong>Institut</strong> <strong>für</strong> Chemie und Dynamik der Geosphäre (ICG-I:<br />
Stratosphäre), Jülich, Germany<br />
2. Laboratoire de Physique Moléculaire pour l’Atmosphere et l’Astrophysique (LPMAA), Université<br />
Pierre et Marie Curie, Paris, France<br />
3. Harvard-Smithsonian Center for Astrophysics, Cambridge, USA<br />
4. <strong>Institut</strong>e for Atmospheric Science – School of Earth and Environment, University of Leeds,<br />
Leeds, UK<br />
5. Meteorologisches <strong>Institut</strong>, Freie <strong>Universität</strong> Berlin, Berlin, Germany<br />
6. Service d’Aeronomie du CNRS, Verrieres le Buisson, France<br />
7. Belgian <strong>Institut</strong>e for Space Aeronomy (BIRA-IASB), Brussels, Belgium<br />
8. Jet Propulsion Laboratory (JPL), Pasadena, USA<br />
9. <strong>Institut</strong> <strong>für</strong> Atmosphäre und Umwelt, J. W. Goethe <strong>Universität</strong> Frankfurt, Frankfurt, Germany<br />
10. European Space Agency (ESA), Nordwijk, Netherland<br />
11. <strong>Institut</strong> <strong>für</strong> <strong>Umweltphysik</strong> und Fernerkundung, University of Bremen, Bremen, Germany<br />
12. Chemistry Department, University of Cambridge, Cambdrige, UK<br />
13. <strong>Institut</strong> <strong>für</strong> Meteorologie und Klima (IMK), Forschungszentrum <strong>Karls</strong>ruhe, <strong>Karls</strong>ruhe, Germany<br />
Future work<br />
Future work will concentrate on (1) time-resolved measurements of stratospheric radicals, (2) the budget<br />
and trend of stratospheric bromine and iodine, (3) the photochemistry and transport of the tropical<br />
upper troposphere and stratosphere, (4) improved measurements of the spectral solar irradiance with<br />
an emphasis on the UV-A and B, and (5) the validation of existing (ENVISAT/SCIAMCHY) and<br />
future satellite instruments (Metop/GOME-2 and IASI).<br />
Peer Reviewed Publications<br />
1. Butz et al. [2006a]<br />
2. Dorf et al. [2006a]<br />
3. Dorf et al. [2006b]<br />
4. Feng et al. [2006]<br />
5. Frieler et al. [2006]<br />
6. Sioris et al. [2006]<br />
7. WMO [2006]
38 CHAPTER 2. ATMOSPHERE AND REMOTE SENSING<br />
Other Publications<br />
1. Butz et al. [2006b]<br />
PhD Theses<br />
1. Butz [2006]
2.2. STRATOSPHERIC RESEARCH GROUP 39<br />
2.2.1 Observational constraints on stratospheric ozone loss cycles<br />
André Butz (Marcel Dorf, Sebastian Kreycy, Lena Kritten, Cristina Prados, Benjamin Simmes,<br />
Frank Weidner, Klaus Pfeilsticker)<br />
Abstract Balloon-borne observations of a comprehensive set of trace gases in the Arctic winter<br />
stratosphere are used to constrain a photochemical model. Model-measurement comparisons aim<br />
at testing the consistency of various recently suggested scenarios of the involved reaction kinetics.<br />
Particular focus is put on the ClO-BrO and the ClO-ClO cycles, and on inferring implications for<br />
ozone loss.<br />
Figure 2.17: Measured (boxes) and modeled (lines) slant column densities (SCD) of OClO as a function<br />
of tangent height. Various model runs are shown as indicated in the legend.<br />
Background Several studies indicate that measured<br />
ozone loss in the Arctic winter/spring<br />
stratosphere is underestimated by current stratospheric<br />
chemistry models when using standard<br />
recommendations for the reaction kinetics. Erroneous<br />
representation of the known catalytic ozone<br />
loss cycles in the models could explain why modeled<br />
ozone loss falls short when compared to observations.<br />
Here, recently suggested updates of<br />
the kinetics of the two most important cycles, the<br />
ClO-ClO and ClO-BrO cycle, are tested for consistency<br />
with the observations.<br />
Methods and results We discuss a case study<br />
of the Arctic stratosphere in February 1999 where<br />
ozone loss occurred locally in a moderately activated<br />
polar vortex. Simultaneous balloon-borne<br />
solar occultation observations of HNO3, NO2, NO,<br />
HCl, ClONO2, Cly, OClO, and BrO provide a<br />
comprehensive view of the chemical species involved<br />
in catalytic ozone loss. In particular, simultaneous<br />
measurements of BrO and OClO can<br />
be used to inspect the ClO + BrO reaction, the<br />
branching ratio of which has been questioned recently.<br />
Simultaneous observations of ClONO2 and<br />
NO2 are particularly useful to investigate deactivation<br />
of the short-lived chlorine species and<br />
the speculative existence of unstable isomers of<br />
ClONO2. A stratospheric chemistry model is constrained<br />
to all observed species except for OClO.<br />
Several recently suggested updates of the relevant<br />
reaction kinetics are tested. Model-measurement<br />
comparisons of OClO provide an estimate on how<br />
well the ClO-BrO cycle and the ClO-ClO cycle<br />
are represented by the proposed model scenarios.<br />
Implications are discussed on the basis of the modeled<br />
ozone loss rates.<br />
The model-measurement comparisons show that<br />
formation of an unstable isomer of ClONO2 cannot<br />
be reconciled with our observations. Further<br />
suggestions concerning the photolysis rate of the<br />
ClO dimer, the equilibrium constant between the<br />
ClO dimer and monomer, the rate of the ClO-<br />
ClO association reaction, and the branching ratio<br />
of the ClO-BrO reaction produce model output<br />
consistent with observations of OClO. However,<br />
ozone loss can be enhanced by 10%- 20% compared<br />
to currently recommended kinetics.<br />
Outlook/Future work Similar studies conducted<br />
during night-time will allow us to further<br />
discriminate between the various suggested<br />
kinetic scenarios. Time-resolved observations of<br />
the build-up of OClO during sunset could further<br />
constrain the kinetics of the ClO-BrO cycle.<br />
Funding The present work has been supported<br />
by ESA, BMBF, DLR and the European Union.<br />
Main publication Butz et al. [2006b]
40 CHAPTER 2. ATMOSPHERE AND REMOTE SENSING<br />
2.2.2 Is there inorganic gaseous iodine in the tropical UT/LS ?<br />
André Butz (Marcel Dorf, Sebastian Kreycy, Lena Kritten, Cristina Prados, Benjamin Simmes,<br />
Frank Weidner, Klaus Pfeilsticker)<br />
Abstract Solar absorption spectra recorded during a tropical balloon flight by the LPMA/DOAS<br />
payload are analyzed for the absorption of IO and OIO yielding undetectable or very low amounts of iodine<br />
in the tropical UT/LS. Photochemical modeling of the partitioning among the iodine family shows<br />
that tropical inorganic gaseous iodine (Iy) < (0.3/0.4 ± 0.1) ppt (OIO photolysis considered/omitted).<br />
Figure 2.18: Absorption of IO in solar absorption spectra at high (upper panel) and low latitudes<br />
(lower panels). Black line inferred IO absorption + residual. Red line inferred IO absorption. Blue<br />
line theoretical IO absorption corresponding to 0.5 ppt below 20 km. TH tangent height.<br />
Background Solomon et al. [1994] suggested<br />
that already very small amounts of iodine could<br />
significantly contribute to lower stratospheric<br />
ozone loss. So far, most studies assessing the<br />
stratospheric iodine budget conclude on undetectable<br />
low amounts of gaseous inorganic iodine<br />
(Iy). Bösch et al. [2003] gives the currently<br />
best upper limits of Iy for high and mid-latitudes.<br />
Here, the latter study is extended to low-latitudes<br />
which are of particular importance due to their<br />
crucial role in transporting tropospheric air to the<br />
stratosphere.<br />
Methods and results In June 2005, the<br />
LPMA/DOAS balloon payload has been deployed<br />
at a tropical site in northern Brazil for the first<br />
time. While floating in the middle stratosphere,<br />
the balloon-borne instruments recorded solar absorption<br />
spectra during sunset. Light paths in the<br />
upper troposphere/lower stratosphere (UT/LS)<br />
extended over several hundred kilometers making<br />
the observations very sensitive to minor abundant<br />
trace species. The spectra are analyzed for<br />
the absorption of IO and OIO in the visible spectral<br />
range applying the DOAS retrieval algorithm.<br />
Most importantly, the spectral retrieval of IO requires<br />
a correction for the solar center-to-limb-<br />
darkening effect explored in detail by Bösch et al.<br />
[2003].<br />
The inferred absorption of IO slightly exceeds the<br />
theoretical, statistical detection limit but cannot<br />
be considered trustworthy since systematic residual<br />
structures hinder the retrieval. The OIO<br />
retrievals yield absorptions below the detection<br />
limit. Below 20 km altitude, upper limits for<br />
IO and OIO consistent with the observations<br />
range between 0.15 ppt and 0.24 ppt and between<br />
0.01 ppt and 0.1 ppt, respectively. Photochemical<br />
model runs indicate that a consistent upper limit<br />
for Iy in the tropical UT/LS is (0.3 ± 0.1) ppt or<br />
(0.4 ± 0.1) ppt if OIO photolysis is considered or<br />
omitted, respectively.<br />
Outlook/Future work More tropical observations<br />
of gaseous and particulate iodine are necessary<br />
to further constrain the stratospheric iodine<br />
budget.<br />
Funding The present work has been supported<br />
by ESA, BMBF, DLR and the European Union.<br />
Main publications<br />
Butz [2006], WMO [2006]
2.2. STRATOSPHERIC RESEARCH GROUP 41<br />
2.2.3 Trend of stratospheric bromine<br />
Marcel Dorf (André Butz, Frank Weidner, Klaus Pfeilsticker, Martyn P. Chipperfield (University<br />
of Leeds, UK))<br />
Abstract Balloon-borne DOAS (Differential Optical Absorption Spectroscopy) bromine monoxide<br />
(BrO) measurements and model simulations are used to investigate the inorganic stratospheric bromine<br />
budget for the past 10 years.<br />
Background Although bromine is much less<br />
abundant than chlorine in the atmosphere, it is<br />
known to deplete stratospheric ozone 45 to 69<br />
times more efficiently on a per atom basis. Reactions<br />
involving bromine contribute about half of<br />
the seasonal polar ozone loss and about 45% of the<br />
long-term column loss at northern mid-latitudes,<br />
with chlorine species being largely responsible for<br />
the remainder. There is currently great uncertainty<br />
in the present stratospheric bromine budget,<br />
how it has evolved over the past decade and<br />
how it will change in the future.<br />
Figure 2.19: Measured trends for bromine in the<br />
near-surface troposphere (lines) and stratosphere<br />
(squares). Global tropospheric bromine from the<br />
sum of methyl bromide plus halons as measured in<br />
ambient air, archived air and firn air (thick solid<br />
line) is compared with bromine from CH3Br and<br />
halons plus bromine from VSLS organic bromine<br />
compounds (Br<br />
V SLS<br />
y<br />
), assuming total contribu-<br />
tions of 3, 5, or 7 ppt of these species to Bry (thin<br />
dotted lines). Total inorganic bromine derived<br />
from stratospheric measurements of BrO and photochemical<br />
modeling that accounts for BrO/Bry<br />
partitioning from slopes of Langley BrO observations<br />
above balloon float altitude (filled squares)<br />
and lowermost stratospheric BrO measurements<br />
(open squares). Bold/faint error bars correspond<br />
to the precision/accuracy of the estimates, respectively.<br />
The years indicated on the abscissa are<br />
sampling times for tropospheric data. For stratospheric<br />
data, the date corresponds to the time<br />
when the air was last in the troposphere, i.e. sampling<br />
date minus estimated mean time in stratosphere.<br />
Methods and results Stratospheric Bry is estimated<br />
based on balloon-borne observations of<br />
BrO in the middle stratosphere. These results are<br />
combined with surface trend data of the major<br />
stratospheric bromine source gases; methyl bromide<br />
(CH3Br) and halons. By comparing the observed<br />
source gas changes in the lower atmosphere<br />
with Bry, one can determine the net contribution<br />
to Bry from other short-lived species (BrVSLS y ) and<br />
assess the trends in all bromine sources for the<br />
past decade (see Figure 1). From the early 1990s<br />
until the early 2000s, stratospheric Bry increased<br />
from about (17.8 ± 2.5) ppt to (21.5 ± 2.5) ppt,<br />
but in recent years this increase appears to be<br />
slowing, consistent with restrictions on the use of<br />
CH3Br as a fumigant. In order to explain the difference<br />
between the sum of CH3Br plus halons and<br />
our estimated stratospheric Bry, brominated very<br />
short-lived species (VSLS) must also contribute<br />
with about (4.0 ± 2.5) ppt to stratospheric Bry<br />
on a global average. The balloon soundings presented<br />
here reveal BrO mixing ratios typically in<br />
the range of 0 to 2 ppt at the tropopause, with<br />
a rapid increase above, which can only be explained<br />
by the fast release of additional bromine<br />
from short-lived bromine sources.<br />
Outlook/Future work The threat of thinning<br />
the stratospheric ozone layer by bromine may not<br />
be over, since in a warmer climate the oceanic<br />
emission of VSLS will possibly become accelerated.<br />
A sea-surface temperature increase and a<br />
concurrent increase of this additional source of<br />
Bry is an important new aspect of atmospheric<br />
bromine, since it potentially links climate change<br />
occurring at the surface with the abundance of<br />
stratospheric ozone. Thus future measurements<br />
are needed to closely follow the trend and to quantify<br />
the contribution of VSLS.<br />
Funding Funding came from the BundesMinisterium<br />
<strong>für</strong> Bildung und Forschung (BMBF), contract<br />
DLR-50EE0017, and the European Union<br />
through the QUILT (EVK2-2000-00545) and<br />
SCOUT-O3 (505390-GOCE-CT-2004) projects.<br />
Main publications<br />
Dorf et al. [2006b], WMO [2006]
42 CHAPTER 2. ATMOSPHERE AND REMOTE SENSING<br />
2.2.4 High precision measurement of the UV BrO absorption cross section<br />
Sebastian Kreycy (André Butz, Marcel Dorf, Lena Kritten, Cristina Prados, Benjamin Simmes,<br />
Klaus Pfeilsticker, Manfred Birk (DLR, <strong>Institut</strong> <strong>für</strong> Methodik der Fernerkundung, Oberpfaffenhofen))<br />
Abstract The Bromine monoxide (BrO) absorption cross section will be simultaneously measured<br />
(a) in the UV at low spectral resolution (35 cm −1 ) with the balloon DOAS instrument and (b) at high<br />
resolution (0.002 cm −1 ) using a Fourier-Transformation (FT) spectrometer in the far-infrared. The<br />
set of observations provides information on the BrO absorption cross section at high precision, based<br />
on the knowledge of the BrO dipole transition matrix element (0 → 0).<br />
Figure 2.20: Compendium of previous measurements of the temperature dependent differential<br />
bromine monoxide cross section obtained by different groups.<br />
Background Bromine is one of the most important<br />
compounds acting as a catalyst in the depletion<br />
of stratospheric ozone. Hence, it is of major<br />
concern in atmospheric ozone research. Today<br />
the most limiting fact in determining total<br />
stratospheric bromine (Bry) is the knowledge of<br />
the BrO absorption cross section which is essential<br />
in inferring total bromine from spectroscopic<br />
observations of stratospheric BrO.<br />
Methods and results Absorption cross section<br />
measurements require the knowledge of the targeted<br />
species’ concentration within an absorption<br />
cell. In that respect, past BrO absorption cross<br />
section measurements based on chemical analysis<br />
of the BrO concentration within the absorption<br />
cell were limited. In our approach, the chemical<br />
analysis is replaced by an in-situ optical procedure,<br />
i. e. simultaneous observation of the BrO<br />
cross section in the UV (300 - 380 nm) by a low<br />
resolution DOAS spectrograph and at high resolution<br />
in the far-IR (330 - 1000 µm), where the<br />
line strengths of the ground-state rotational transitions<br />
of BrO are well known. In a second experiment<br />
aiming at thorough characterization of<br />
the UV absorption, the BrO cross section will be<br />
simultaneously measured at low and high resolution<br />
whereby the low resolution measurements of<br />
the balloon spectrometer are used as a transfer<br />
standard.<br />
Outlook/Future work incudes the steps:<br />
1. Upgrading and characterization of the balloon<br />
spectrometer.<br />
2. Estimation of the light throughput of the<br />
White-cell.<br />
3. Design of the light in- and output optics.<br />
4. Studying and recording of the curve of<br />
growth for the BrO cross section at low and<br />
high resolution.<br />
5. Laboratory measurement of the BrO cross<br />
sections<br />
• UVlow vs IRhigh resolution<br />
• UVlow vs UVhigh resolution<br />
in temperature steps of 10 K ranging from<br />
220 K to 300 K.<br />
6. Evaluation of the data.<br />
Funding comes through the Deutsche Forschungsgemeinschaft,<br />
DFG (PF384/3-1).
2.2. STRATOSPHERIC RESEARCH GROUP 43<br />
2.2.5 Photolytic lifetime of stratospheric N2O5<br />
Lena Kritten (André Butz, Marcel Dorf, Sebastian Kreycy, Cristina Prados, Ulrike Reichl, Benjamin<br />
Simmes, Frank Weidner, Klaus Pfeilsticker)<br />
Abstract Time-dependent profiles of atmospheric radicals were measured in the upper troposphere<br />
and stratosphere during the first international high-altitude balloon campaign in the tropics (Teresina,<br />
Brazil, 5.1 ◦ S, 42.9 ◦ W). The observed diurnal variation of stratospheric NO2 [Weidner et al. , 2005]<br />
in conjunction with photochemical modelling allows to infer the photolytic lifetime of N2O5.<br />
Altitude / km<br />
30<br />
25<br />
20<br />
15<br />
11 12 13 14 15 16<br />
T ime / UT<br />
11 12 13 14 15 16<br />
T ime / UT<br />
[10<br />
17<br />
8 molec/cm 3 ]<br />
Figure 2.21: Measured (left side) and modelled (right side) concentration of NO2 inferred from DOAS<br />
scanning limb observations on the LPMA/IASI payload on June 30, 2005.<br />
Background The amount and partitioning of<br />
stratospheric NOx (NO, NO2 and NO3) and NOy<br />
(NOx, N2O5, HNO3, ClONO2, HO2NO2, and<br />
BrONO2) largely govern ozone photochemistry<br />
in the mid-stratosphere (25-40 km). During daytime,<br />
the tropical NOx is mainly supplied by the<br />
photochemical decay of the nighttime reservoir<br />
N2O5. Monitoring the diurnal variation of NO2<br />
thus provides information on the photolytic lifetime<br />
of N2O5.<br />
Methods and results Within the framework<br />
of an international measurement campaign dedicated<br />
to the ENVISAT/SCIAMACHY validation,<br />
three stratospheric balloon flights of the<br />
mini-DOAS scanning limb instrument were performed<br />
aboard the MIPAS-B, LPMA/DOAS and<br />
IASI balloon payloads in tropical latitudes near<br />
Teresina, Northern Brazil. During all flights the<br />
UV/Vis spectrometer recorded spectra of sunlight<br />
scattered near the horizon in the atmosphere.<br />
Scanning elevation angles range between 0 ◦ and<br />
−6 ◦ with the balloons floating around 33 km altitude.<br />
The spectral retrieval of the obtained skylight<br />
spectra relies on the DOAS method. Pro-<br />
NO 2<br />
file information is then obtained using established<br />
inversion techniques (optimal estimation<br />
technique) in combination with a 3-D radiative<br />
transfer model [Weidner et al. , 2005]. The obtained<br />
profiles of O3 and NO2 are compared to<br />
the outputs of a 1-D photochemical model, which<br />
was initialized with trace gas observations of the<br />
LPMA/DOAS and MIPAS payloads. From the<br />
observed increase of stratospheric NO2 at daytime,<br />
current estimates for the photolysis frequency<br />
of N2O5 can be tested.<br />
Outlook/Future work<br />
Check the photolytic lifetime of N2O5.<br />
Analysis of all three balloon flights at Teresina for<br />
UV/Vis absorbing gases such as O3, NO2, BrO,<br />
OClO, IO, OIO, and CH2O.<br />
Preparation of, and participation in, future measurement<br />
campaigns (at Kiruna in April 2007 and<br />
at Teresina in Sept. 2007).<br />
Funding comes through ESA, BMBF, DFG,<br />
and the European Union.<br />
15<br />
13<br />
11<br />
9<br />
7<br />
5<br />
3<br />
1<br />
-1
44 CHAPTER 2. ATMOSPHERE AND REMOTE SENSING<br />
2.2.6 Measurement of upper tropospheric and lower stratospheric radicals<br />
by balloon- and aircraft-borne scanning limb DOAS<br />
Benjamin Simmes (Cristina Prados, Lena Kritten, Frank Weidner, Klaus Pfeilsticker)<br />
Abstract Based on a versatile miniDOAS instrument that has been successfully tested on several<br />
stratospheric balloon flights within the last 4 years, a new airborne miniDOAS instrument was designed<br />
and built for the application on high flying research aircrafts like the German Falcon and HALO (DLR),<br />
or the Russian Geophysica. The instrument aims at the detection of upper tropospheric and lower<br />
stratospheric trace gases such as O3, NO2, CH2O, CH2O2, BrO, H2O, OClO, IO, OIO, and O4 by<br />
means of scanning limb spectrometry of scattered skylight.<br />
Background In the past two decades remote<br />
sensing of the atmosphere by optical methods<br />
has evolved into a powerful tool for meteorology,<br />
atmospheric photochemistry and climate studies.<br />
Quasi in-situ UV/Vis limb profiling from balloon<br />
has proven to be a sensitive and reliable method<br />
[Weidner, 2005]. Similar instruments on highflying<br />
aircraft could extend the possibility of gathering<br />
important atmospheric data regarding atmospheric<br />
photochemistry, transport and climate.<br />
Figure 2.22: Scanning-limb spectrometer with two<br />
telescopes looking perpendicular to the aircraft’s<br />
flight direction.<br />
Instrumentation The instrument consists of<br />
two commercial Ocean Optics grating spectrometers<br />
for the UV and visible spectral range.<br />
Both are kept under stable optical conditions in<br />
a vacuum-sealed aluminum housing that is immersed<br />
into a water-ice-bath contained in a resin<br />
tank. Skylight is received from two telescopes that<br />
are mounted on motorized elevation scanners to<br />
perform limb scans perpendicular to the sun. An<br />
embedded computer controls both spectrometers<br />
and the telescope cradles.<br />
Methods Skylight radiances (330 - 550 nm) are<br />
measured up to a height of ∼ 32 km in the case<br />
of balloons. The spectra are analyzed for column<br />
densities along the line of sight of the chemical<br />
species mentioned above by Differential Optical<br />
Absorption Spectroscopy (DOAS). Radiative<br />
Transfer (RT) calculations using the lab programmed<br />
Monte Carlo RT Model TRACY are<br />
used to simulate the measured absorptions and<br />
to infer vertical profiles of targeted gases using<br />
the Maximum a Posteriori (MAP) inversion technique.<br />
Subsequent measurements of the profiles of<br />
these species allow us to draw information on the<br />
temporal and spatial variations of these species,<br />
related photochemistry, transport and climate.<br />
Results Balloon-borne limb scattered measurements<br />
have been tested against simultaneous measurements<br />
of the same parameters available from<br />
in-situ or UV/Vis/NIR solar occultation observations<br />
performed on the same payload. In past<br />
studies (e. g., Weidner et al. [2005]) reasonable<br />
agreement has been found between measured and<br />
RT calculated limb radiances as well as between<br />
O3, NO2, BrO and correlative profile measurements<br />
when properly accounting for all relevant<br />
atmospheric parameters (temperature, pressure,<br />
aerosol extinction, and major absorbing trace<br />
gases).<br />
Outlook/Future work The new aircraft-borne<br />
instrument has now been build and is awaiting<br />
first application. Future work will focus on characterization<br />
and benchmarking the new instrument’s<br />
abilities and their improvement, and deployments<br />
on the Falcon aircraft during the AS-<br />
TAR campaign in March 2007, on balloons during<br />
the tropical balloon campaign at Teresina/Brazil<br />
in fall 2007 and future campaigns.<br />
Funding comes through the Deutsche Forschungsgemeinschaft,<br />
DFG (PF384/5-1).
2.2. STRATOSPHERIC RESEARCH GROUP 45<br />
References<br />
Bösch, H., Camy-Peyret, C., Chipperfield, M. P., Fitzenberger, R., Harder, H., Platt, U., & Pfeilsticker,<br />
K. 2003. Upper limits of stratospheric IO and OIO inferred from center-to-limb-darkeningcorrected<br />
balloon-borne solar occultation visible spectra Implications for total gaseous iodine and<br />
stratospheric ozone. J. Geophys. Res., 108, 4455.<br />
Butz, A. 2006. Case studies of stratospheric nitrogen, chlorine and iodine photochemistry based on<br />
balloon-boren UV/visible and IR absorption spectroscopy. PhD Thesis, <strong>Universität</strong> Heidelberg.<br />
Butz, A., Bösch, H., Camy-Peyret, C., Chipperfield, M. P., Dorf, M., G., Dufour, Grunow, K., Jeseck,<br />
P., Kühl, S., Payan, S., Pepin, I., Pukite, J., Rozanov, A., von Savigny, C., Sioris, C., Weidner,<br />
F., & Pfeilsticker, K. 2006a. Inter-comparison of stratospheric O3 and NO2 abundances retrieved<br />
from balloon borne direct sun observations and Envisat/SCIAMACHY limb measurements. Atmos.<br />
Chem. Phys., 6, 1293–1314.<br />
Butz, A., Bösch, H., Camy-Peyret, C., Dorf, M., Engel, A., Payan, S., & Pfeilsticker, K. 2006b.<br />
Observational constraints on the kinetics of the ClO-BrO and ClO-ClO ozone loss cycles in the<br />
Arctic winter stratosphere. Geophys. Res. Lett. submitted.<br />
Dorf, M., Bösch, H., Butz, A., Camy-Peyret, C., Chipperfield, M. P., Engel, A., Goutail, F., Grunow,<br />
K., Hendrick, F., Hrechanyy, S., Naujokat, B., Pommereau, J.-P., Van Roozendael, M., Sioris, C.,<br />
Stroh, F., Weidner, F., & Pfeilsticker, K. 2006a. Balloon-borne stratospheric BrO measurements:<br />
Comparison with Envisat/SCIAMACHY BrO limb profiles. Atmos. Chem. Phys., 6, 2483–2501.<br />
Dorf, M., Butler, J. H., Butz, A., Camy-Peyret, C., Chipperfield, M. P., Kritten, L., Montzka, S. A.,<br />
Simmes, B., Weidner, F., & Pfeilsticker, K. 2006b. Long-term observations of stratospheric bromine<br />
reveal slow down in growth. Geophys. Res. Lett., 33, L24803. doi:10.1029/2006GL027714.<br />
Feng, W., Chipperfield, M. P., Dorf, M., & Pfeilsticker, K. 2006. Mid-latitude Ozone Changes: Studies<br />
with a 3-D CTM Forced by ERA-40 Analyses. Atmos. Chem. Phys. Discuss., 6, 6695–6722.<br />
Frieler, K., Rex, M., Salawitch, R. J., Canty, T., Streibel, M., Stimpfle, R. M., Pfeilsticker, K., Dorf,<br />
M., Weisenstein, D. K., & Godin-Beekmann, S. 2006. Towards a better quantitative understanding<br />
of polar stratospheric ozone loss. Geophys. Res. Lett., 22. doi:10.1029/2005GL025466.<br />
Reichl, U. 2005. Ground-based direct Sun UV/vis spectroscopy in Timon, Northeastern Brazil: Comparison<br />
of tropospheric air mass pollution in the dry and wet season. Diploma Thesis, <strong>Universität</strong><br />
Heidelberg.<br />
Schwärzle, J. 2005. Spektroskopische Messung von Halogenoxiden in der marinen atmosphärischen<br />
Grenzschicht in Alcântara, Brasilien. Staatsexamensarbeit, <strong>Universität</strong> Heidelberg.<br />
Sioris, C. E., Kovalenko, L. J., McLinden, C. A., Salawitch, R. J., Van Roozendael, M., Goutail,<br />
F., Dorf, M., Pfeilsticker, K., Chance, K., von Savigny, C., Liu, X., Kurosu, T. P., Pommereau,<br />
J.-P., Bösch, H., & Frerick, J. 2006. Latitudinal and vertical distribution of bromine monoxide in<br />
the lower stratosphere from SCIAMACHY limb scattering measurements. J. Geophys. Res., 111,<br />
D14301. doi:10.1029/2005JD006479.<br />
Solomon, S., Garcia, R., & Ravishankara, A. 1994. On the role of iodine in ozone depletion. J. Geophys.<br />
Res., 99, 20491–20499.<br />
Weidner, F. 2005. Development and Application of a Versatile Balloon-Borne DOAS Spectrometer<br />
for Skylight Radiance and Atmospheric Trace Gas Profle Measurements. PhD Thesis, <strong>Universität</strong><br />
Heidelberg.<br />
Weidner, F., Bösch, H., Bovensmann, H., Burrows, J. P., Butz, A., Camy-Peyret, C., Dorf, M.,<br />
Gerilowski, K., Gurlit, W., Platt, U., von Friedeburg, C., Wagner, T., & Pfeilsticker, K. 2005.<br />
Balloon-borne Limb profiling of UV/vis skylight radiances, O3, NO2, and BrO: Technical set-up<br />
and validation of the method. Atmos. Chem. Phys., 5, 1409–1422.<br />
WMO (ed). 2006. Scientific Assessment of Ozone Depletion: 2006. World Meteorological Organization<br />
Global Ozone Research and Monitoring Project: Geneva.
2.3. RADIATIVE TRANSFER 47<br />
2.3 Radiative Transfer<br />
Klaus Pfeilsticker<br />
Group members<br />
Prof. Dr. K. Pfeilsticker, Head of group<br />
C. Fensterer, Diploma Student<br />
Dr. A. Lotter, Post Doc<br />
Dr. T. Scholl, left by July 2006<br />
Abstract<br />
Our research on the radiative transfer (RT) in the Earth’s atmosphere concentrates on an improved<br />
understanding of the UV/Vis solar irradiance, its temporal variation, and the deposition of solar radiation<br />
in the atmosphere. These studies include spectroscopic measurements from different platforms<br />
and sophisticated radiative transfer modelling.<br />
Scientific objectives<br />
• Measurements of path length distributions of solar photons being transmitted to the ground<br />
[Scholl et al. , 2006]<br />
• The absolute spectral solar irradiance (320 - 650 nm) and its temporal variation [Lindner, 2005;<br />
Gurlit et al. , 2005; Weidner et al. , 2005]<br />
• Measurements of UV/Vis actinic fluxes, e. g. JNO2, and the limb radiance near horizon<br />
• The detection and characterization of unknown, overlooked, or yet poorly characterized atmospheric<br />
absorbers such as H2O continuum absorption, metastable and stable H2O–H2O dimers,<br />
or the collisional complex O2–O2 [Lotter, 2006]<br />
• Measurements of the stratospheric aerosol extinction and its relation to volcanic eruptions, the<br />
formation of polar stratospheric clouds, and aerosols of the tropical upper troposphere and lower<br />
stratosphere<br />
• Validation of level 1 products (spectral solar irradiance, limb radiances) of the SCIAMACHY<br />
instrument deployed on the European research satellite ENVISAT [Weidner et al. , 2005]<br />
Background<br />
The transfer of solar radiation in the Earth’s atmosphere is one of the most complicated issues in<br />
environmental sciences mostly due to the variety and complex nature of atmospheric absorbers and<br />
scatterers (e. g., gases, aerosols, liquid and solid cloud particles), their spectroscopic signatures, and<br />
their varying spatial arrangements. Accordingly it is found that clear and cloudy sky radiative transfer<br />
is the major uncertainty in climate modelling, thus the validation of RT models appears to be necessary.<br />
RT models are also used for photochemical investigations and for in-situ and remote sensing studies.<br />
Main methods<br />
Methods used for the investigation of radiative transfer involve: (1) The study of absolute spectral<br />
solar irradiance in the UV/Vis/NIR region and the corresponding near horizon skylight limb radiances<br />
measured by different grating- and Fourier-Transformation-spectrometers deployed on high altitude<br />
(∼ 40 km) balloon platforms. These measurements include on-site absolute radiometric calibration<br />
to NIST (National <strong>Institut</strong>e of Standard and Technology, USA) and PTB (Physikalische Technische<br />
Bundesanstalt) radiometric standards; (2) Ground-based spectroscopy of zenith scattered skylight<br />
of the oxygen A-band (767 - 771 nm) at high spectral resolution (see upper panel of Figure 2.23) to<br />
receive path length distributions of solar photons for a variety of cloudy skies (see lower panel of<br />
Figure 2.23); (3) Near-surface long path absorption spectroscopy in wavelength intervals ranging from<br />
the UV to the NIR. All the instruments are deployed on internationally organized field campaigns<br />
that address a wider range of scientific objectives. The interpretation of these measurements also<br />
involves sophisticated radiative transfer modelling (ray-tracing, Monte Carlo, discrete ordinate models,<br />
DISORT) that, for example, accounts for the sphericity of the atmosphere, refraction, cloud cover,<br />
and time and space dependent trace gas and aerosol concentrations.
48 CHAPTER 2. ATMOSPHERE AND REMOTE SENSING<br />
Figure 2.23: Upper panel: Comparison of measured (black) and simulated (red) oxygen A-band<br />
spectrum for the observation at Cabauw (NL) on May 11, 2003 at UT 14:59. The identification of the<br />
oxygen A-band and solar Fraunhofer lines is given next to the respective lines. Middle panel: Residual<br />
spectrum taken as the natural logarithm of the ratio of measured and simulated spectrum, hence the<br />
natural units of vertically integrated optical density (VOD) or air-mass. Lower panel: Inferred photon<br />
path PDF, assuming a Γ-distribution for the in-cloud transfer (adopted from Scholl et al. [2006]).<br />
Main activities<br />
The activities in 2006 concentrated on the dissemination of the results obtained in past studies.<br />
Cooperation within the institute and with groups outside the institute<br />
Activity (1) as given in methods has been performed within a French-German collaboration with the<br />
Laboratoire de Physique Moléculaire et Applications, Université Pierre et Marie Curie, Paris and<br />
within a collaboration with the IUP at the University of Bremen, Germany. Activity (2) has been<br />
carried out within the framework of the 4-D Cloud project in cooperation with eight institutions<br />
(DWD, Deutscher Wetterdienst, Observatorium Lindenberg; GKSS, Forschungszentrum Geesthacht;<br />
IfM, <strong>Institut</strong> <strong>für</strong> Meereskunde, <strong>Universität</strong> Kiel; IfT, <strong>Institut</strong> <strong>für</strong> Troposphärenforschung, Leipzig; IPA,<br />
<strong>Institut</strong> <strong>für</strong> Physik der Atmosphäre, <strong>Universität</strong> Mainz; MIUB, Meteorologisches <strong>Institut</strong>, <strong>Universität</strong><br />
Bonn; MPI-M, Max-Planck-<strong>Institut</strong> <strong>für</strong> Meteorologie, Hamburg; TUD, Technische <strong>Universität</strong> Dresden).<br />
Finally, activity (3) has been performed within a cooperation with partners from the University<br />
of Grenoble, France and the Brazilian military.
2.3. RADIATIVE TRANSFER 49<br />
Future work<br />
• Improved measurements of the solar irradiance in the UV-A and UV-B (λ > 242 nm)<br />
• 2-D mapping of cloud properties by imaging DOAS (IDOAS) from the ground<br />
• Improved spectral retrieval of water vapor, water continuum, and water dimer absorption in the<br />
Vis/NIR spectral region (600 - 750 nm)<br />
• A feasibility study of aircraft-borne spectrometry of gaseous, liquid and ice water path<br />
Peer Reviewed Publications<br />
1. Scholl et al. [2006]<br />
PhD Theses<br />
1. Lotter [2006]<br />
2. Scholl [2006]
50 CHAPTER 2. ATMOSPHERE AND REMOTE SENSING<br />
2.3.1 2-D mapping of cloud parameters<br />
Claudia Fensterer (Klaus-Peter Heue, Andreas Lotter, Klaus Pfeilsticker)<br />
Abstract The present diploma study is concerned with the development of a 2-D imaging spectrometer<br />
to monitor the temporal and spatial changes of optical properties of clouds (e. g. the cloud<br />
optical density and photon path lengths). The observations will be performed by monitoring the<br />
zenith sky radiances and Vis/NIR absorptions of O2, O4 and H2O, the spectroscopic data retrieval<br />
will be carried out using the DOAS technique.<br />
Figure 2.24: Principle of Imaging Spectroscopy<br />
(IDOAS): (A) The spectrum of a volcano plume<br />
is observed by an imaging spectrometer equipped<br />
with a CCD-detector. (B-C) The spectra are<br />
recorded line-wise and the optical density of atmospheric<br />
absorbers are visualized (here SO2 and<br />
in future O2, O4 and H2O). (D) The second spatial<br />
dimension is monitored by scanning the entrance<br />
slit across the targeted field of view.<br />
Background In climate modelling a reasonable<br />
representation of clouds and their impact on the<br />
absorption of solar radiation is still a challenging<br />
task. In particular, sub-grid variability of clouds<br />
is not well understood. Therefore, the primary<br />
goal of the present study is to investigate cloud<br />
parameters (cloud optical density, photon path<br />
lengths, gaseous absorption) in two dimensions on<br />
spatial scales commensurate with radiative transfer<br />
(from 100 m to kilometers). For this purpose<br />
two-dimensional maps of the optical density of O2,<br />
O4 and H2O as a tracer for photon path lengths<br />
and cloud optical density are inferred from spectroscopic<br />
observations of skylight radiance in a<br />
wavelength range from 400 to 800 nm.<br />
Methods and Results The method relies on<br />
the 2-D spectroscopy of atmospheric trace gases<br />
using the Differential Optical Absorption Spectroscopy<br />
(DOAS) technique. Past experiences<br />
have shown [Lohberger, 2003; Louban, 2005], that<br />
most challenging in the 2-D imaging of atmospheric<br />
trace gases are (a) a sufficiently high wavelength<br />
dispersion, (b) an excellent focus of the slit<br />
image on the detector in the observed first spatial<br />
dimension, and (c) a good estimate of the field of<br />
view in the scanning (second) spatial dimension.<br />
Accordingly, most of the work of the present study<br />
has been invested to improve, optimize, and characterize<br />
an existing imaging spectrometer.<br />
In particular, for the present study a spectrometer<br />
is adapted to monitor skylight in the wavelength<br />
range between 400 and 800 nm where the most important<br />
trace gas absorptions (O2, O3, O4, NO2<br />
and H2O) for cloud studies are found. Upgrading<br />
this spectrometer is still under way. Meanwhile<br />
and in parallel another existing spectrometer<br />
previously used for aircraft measurements<br />
[Heue, 2005] is being deployed in the field and first<br />
results are expected to be obtained soon.<br />
Outlook/Future work Future work includes<br />
(a) to set up a lab-based spectrometer for the<br />
400 and 800 nm holographic concave grating and<br />
to find an optimal imaging, (b) to transfer the<br />
lab set-up into a field usable housing including<br />
temperature stabilization in order to maintain the<br />
wavelength calibration, and (c) to deploy the aircraft<br />
instrument in the field for cloud observations.<br />
Funding The project is funded by the DLR,<br />
’Virtuelles HALO <strong>Institut</strong>’.
2.3. RADIATIVE TRANSFER 51<br />
2.3.2 Field measurements of water continuum and water dimer absorption<br />
Andreas Lotter (Klaus Pfeilsticker)<br />
Abstract Long path length atmospheric absorption spectra of the 4ν, 4ν+δ, and 5ν water polyads<br />
are analyzed for water continuum and water dimer absorption. The measured water continuum<br />
absorption agrees with two versions of the semi-empirical CKD model by order of magnitude. An<br />
upper limit of KP(301 K) = 0.055 atm −1 is inferred for the water dimer equilibrium constant.<br />
optical depth<br />
1.2<br />
1.1<br />
1.0<br />
0.9<br />
CKD_2.4.1<br />
MT_CKD_1.0<br />
residual: measurement - H 2 O monomer (HITRAN04)<br />
H 2 O dimer<br />
Ma and Tipping<br />
700 710 720 730 740 750<br />
wavelength (nm)<br />
Figure 2.25: Residual between measurement and<br />
HITRAN04 water monomer reference. The predicted<br />
water continuum absorption by the Ma and<br />
Tipping far wing line shape theory [Ma & Tipping,<br />
1999] and two versions of the semi-empirical CKD<br />
model [Clough et al. , 1989] are superimposed.<br />
Also shown is the calculated water dimer absorption<br />
based on the absorption cross section by<br />
Schofield & Kjaergaard [2003] and a water dimer<br />
equilibrium constant of KP(301 K) = 0.055 atm −1 .<br />
Background Since atmospheric water vapor<br />
strongly absorbs the incoming solar shortwave and<br />
the outgoing thermal infrared radiation, the exact<br />
knowledge of the spectroscopic signature of water<br />
vapor is of central importance for climate research.<br />
Superimposed on the water monomer absorption<br />
a water continuum absorption has been<br />
recognized for a long time, but its true nature is<br />
still controversial. On the one hand, water continuum<br />
absorption is explained by a deformation<br />
of the line shape of water monomer absorption<br />
lines as a consequence of molecular collisions. On<br />
the other hand, truly bound and metastable water<br />
dimers possibly contribute to water continuum<br />
absorption, too.<br />
Methods and results The spectra recorded by<br />
an active Long Path DOAS instrument during<br />
three field measurement campaigns in the midlatitudes<br />
and the tropics (absorption path lengths:<br />
18 - 29 km, ambient water vapor partial pressures:<br />
7 - 29 mbar) are analyzed for water continuum and<br />
water dimer absorption. The 4ν, 4ν+δ and 5ν water<br />
polyads in the visible and near-infrared spectral<br />
region are selected for the measurements as<br />
three water dimer absorption bands are predicted<br />
to exist almost free of interference by strong water<br />
monomer absorption bands [Schofield & Kjaergaard,<br />
2003]. For a firm evidence of water dimer<br />
absorption a quadratic dependence on the water<br />
monomer absorption has to be verified.<br />
In this context our report of the first detection<br />
of atmospheric water dimers [Pfeilsticker et al. ,<br />
2003] has to be reconsidered as these results can<br />
not be confirmed by subsequent measurements,<br />
especially by those carried out in the tropics. It<br />
is shown that the quality of existing spectral line<br />
databases (e. g., HITRAN, ESA-WV, Partridge-<br />
Schwenke) is insufficient to provide accurate water<br />
monomer references in order to confidently detect<br />
superimposed water dimer absorption. Therefore,<br />
only an upper limit of water dimer absorption<br />
is obtained resulting in the upper limit<br />
of the water dimer equilibrium constant being<br />
KP(301 K) = 0.055 atm −1 . The water dimer band<br />
FWHM is, at least, 40 cm −1 .<br />
The measured water continuum absorption and<br />
the predictions by the semi-empirical CKD 2.4.1<br />
and MT CKD 1.0 water continuum models<br />
[Clough et al. , 1989] are of the same order of<br />
magnitude. In contrast, the Ma and Tipping far<br />
wing line shape theory [Ma & Tipping, 1999] underestimates<br />
water continuum absorption by one<br />
order of magnitude in the 4ν and 5ν water bands,<br />
and by two orders of magnitude in the 4ν+δ water<br />
band. Based on the present state of knowledge<br />
about the spectroscopic and thermochemical<br />
properties of the water dimer, its contribution to<br />
the observed water continuum absorption in the<br />
visible and near-infrared spectral region is minor.<br />
Outlook/Future work For the detection of<br />
water dimers the theoretical Long Path DOAS<br />
detection limit could not be achieved due to the<br />
inaccuracy of existing water vapor spectral line<br />
databases in the 4ν, 4ν+δ, and 5ν spectral regions.<br />
High resolution measurements of the water<br />
monomer spectrum are required with an extinction<br />
as low as 10 −10 cm −1 , in order to benefit from<br />
the full power of the Long Path DOAS technique.<br />
Funding came through the Deutsche Forschungsgemeinschaft,<br />
DFG (PF384/2-1 and 2-3).<br />
Main publication Lotter [2006]
52 CHAPTER 2. ATMOSPHERE AND REMOTE SENSING<br />
2.3.3 Oxygen A-band measurements for solar photon path length distribution<br />
studies<br />
Thomas Scholl (Klaus Pfeilsticker)<br />
Abstract High resolution spectroscopy of the oxygen A-band (760 - 780 nm) in zenith scattered<br />
skylight is a powerful tool to infer path length distributions of solar photons transmitted to the<br />
ground. The relation between the moments 〈L〉 and 〈L 2 〉 of the probability density function (PDF)<br />
and the rescaled cloud optical depth τ ∗ is a strong indicator for 3-D effects on radiative transfer (RT).<br />
Height [m]<br />
10000<br />
8000<br />
6000<br />
4000<br />
2000<br />
0 :0<br />
12:<br />
:5 :10 :15 :20 :25 :30 :35 :40 :45 :50 :55<br />
Time [UTC]<br />
-60 -50 -40 -30 -20 -10 0 10 20<br />
Reflectivity [dBZ]<br />
Figure 2.26: Left panel: Measured radar reflectivities from KNMI 35 GHz Radar for May 22, 2003<br />
UT 12:00-13:00; Right panel: Mean cloud photon paths 〈Lc〉 as a function of effective cloud optical<br />
depth τ ∗ c . The black lines are predictions for different values of the Lévy index α ≤ 2. The three data<br />
clusters (color-coded blue, red and green) correspond to the three different probed cloud situations.<br />
Background Modelling the radiative transfer<br />
in cloudy skies is one of the most challenging tasks<br />
in climate research. The photon PDF is commonly<br />
a hidden property of standard RT models<br />
controlled by the spatial distribution of scattering<br />
and absorption. Since the scattering properties<br />
of clouds and aerosols vary slowly and predictably<br />
with wavelength, the principle of equivalence<br />
allows to draw conclusions about radiative<br />
properties of the atmosphere from a photon PDF<br />
measured in one wavelength band. The photon<br />
PDF in the near-infrared region is very representative<br />
for the shortwave region as a whole. In<br />
the study of Scholl et al. [2006], the first two<br />
moments of the PDF of solar photons transmitted<br />
through cloudy skies to the ground are investigated.<br />
Combining the spectroscopic measurements<br />
with other cloud properties measured<br />
simultaneously by in-situ techniques during two<br />
campaigns allowed to test the theory of anomalous<br />
photon diffusion through clouds.<br />
Methods and Results The multiple of different<br />
line strengths offered by the oxygen A-band<br />
implicitly provide direct information on the PDF<br />
of the photons transmitted to the ground. The<br />
spectral retrieval is solved by forward modelling<br />
the measured spectra with a prescribed photon<br />
PDF (usually a Γ-function) at high spectral resolution.<br />
Then the free parameters of the PDF<br />
are iteratively calculated by using a nonlinear<br />
least square fit leading to the searched quantities<br />
〈L〉 and 〈L 2 〉. Davis & Marshak [2002] inferred<br />
for the first moment of the photon PDF:<br />
〈Lc〉/∆H = (1/2 · [1 + C(ɛ)] · τ ∗ ) α−1 , with α being<br />
the Lévy index ranging between 1 and 2. In<br />
particular, the value α = 2 is attained for a homogenous<br />
slab and α < 2 for a inhomogeneous<br />
slab. In Figure 2.26 the enhancement of the mean<br />
photon path length in the cloud (as a function of<br />
τ ∗ = τ · (1 − g)) and the received Lévy indices are<br />
shown.<br />
The findings confirm the theory of anomalous photon<br />
diffusion through clouds and the predictions<br />
for the values in the path length to optical depth<br />
relations. It also provides further evidence that<br />
cloudy sky photon path length require consideration<br />
of non-classical photon transport theory.<br />
Outlook/Future work Photon PDFs are a<br />
central concept of cloud radiative transfer modelling.<br />
For further improvements imaging DOAS<br />
spectroscopy at high temporal and spatial resolution<br />
is required.<br />
Funding came through the AFO-2000 4-D<br />
Cloud project (BMBF-07ATF24).<br />
Main publications<br />
Scholl [2006], Scholl et al. [2006]
2.3. RADIATIVE TRANSFER 53<br />
References<br />
Clough, S. A., Kneizys, F. X., & Davies, R. W. 1989. Line shape and water vapor continuum. Atmos.<br />
Res., 23, 229–241.<br />
Davis, A. B., & Marshak, A. 2002. Space-Time Characteristics of Light Transmitted through Dense<br />
Clouds: A Green’s Function Analysis. J. Atmos. Sci., 59, 2713–2727.<br />
Gurlit, W., Bösch, H., Bovensmann, H., Burrows, J. P., Butz, A., Camy-Peyret, C., Dorf, M., Gerilowski,<br />
K., Lindner, A., Noël, S., Platt, U., Weidner, F., & Pfeilsticker, K. 2005. The UV-A<br />
and visible solar irradiance spectrum: Inter-comparison of absolutely calibrated, spectrally medium<br />
resolved solar irradiance spectra from balloon-, and satellite-borne measurements. Atmos. Chem.<br />
Phys., 5, 1879–1890.<br />
Heue, K.-P. 2005. Airborne Multi AXis DOAS instrument and measurements of two-dimensional<br />
tropospheric trace gas distributions. PhD Thesis, <strong>Universität</strong> Heidelberg.<br />
Lindner, A. 2005. Ballongestütze Messungen der extraterrestrischen spektralen solaren Irradianz.<br />
Diploma Thesis, <strong>Universität</strong> Heidelberg.<br />
Lohberger, F. 2003. Imaging Spectroscopy of Atmospheric Trace Gases. Diploma Thesis, <strong>Universität</strong><br />
Heidelberg.<br />
Lotter, A. 2006. Field Measurements of Water Continuum and Water Dimer Absorption by Active<br />
Long Path Differential Optical Absorption Spectroscopy (DOAS). PhD Thesis, <strong>Universität</strong> Heidelberg.<br />
Louban, I. 2005. Zweidimensionale Spektroskopische Aufnahmen von Spurenstoff-Verteilungen.<br />
Diploma Thesis, <strong>Universität</strong> Heidelberg.<br />
Ma, Q., & Tipping, R. H. 1999. The averaged density matrix in the coordinate representation:<br />
Application to the calculation of the far-wing line shapes for H2O. J. Chem. Phys., 111, 5909–<br />
5921.<br />
Pfeilsticker, K., Lotter, A., Peters, C., & Bösch, H. 2003. Atmospheric Detection of Water Dimer Via<br />
Near-Infrared Absorption. Science, 300, 2078–2080.<br />
Schofield, D. P., & Kjaergaard, H. G. 2003. Calculated OH-stretching and HOH-bending vibrational<br />
transitions in the water dimer. Phys. Chem. Chem. Phys., 5, 3100–3105.<br />
Scholl, T. 2006. Photon Path Length Distributions for Cloudy Skies - Their first and second-order<br />
moments inferred from high resolution oxygen A-Band spectroscopy. PhD Thesis, <strong>Universität</strong> Heidelberg.<br />
Scholl, T., Pfeilsticker, K., Davis, A. B., Klein Baltink, H., Crewell, S., Löhnert, U., Simmer, C.,<br />
Meywerk, J., & Quante, M. 2006. Path length distributions for solar photons under cloudy skies:<br />
Comparison of measured first and second moments with predictions from classical and anomalous<br />
diffusion theories. J. Geophys. Res., 111, D12211. doi:10.1029/2004JD005707.<br />
Weidner, F., Bösch, H., Bovensmann, H., Burrows, J. P., Butz, A., Camy-Peyret, C., Dorf, M.,<br />
Gerilowski, K., Gurlit, W., Platt, U., von Friedeburg, C., Wagner, T., & Pfeilsticker, K. 2005.<br />
Balloon-borne Limb profiling of UV/vis skylight radiances, O3, NO2, and BrO: Technical set-up<br />
and validation of the method. Atmos. Chem. Phys., 5, 1409–1422.
2.4. SATELLITE GROUP 55<br />
2.4 Satellite Group<br />
Group members<br />
Prof Dr. T. Wagner, head of group<br />
Dr. Steffen Beirle, Post Doc<br />
Tim Deutschmann, student<br />
Barbara Dix, PhD student<br />
Dr. Christian Frankenberg, Post Doc<br />
Michael Grzegorski, PhD student<br />
Michael Hayn, Diploma student<br />
Dr. Klaus-Peter Heue, Post Doc<br />
Dr. Jens Hollwedel, Post Doc<br />
Ossama Ibrahim, PhD student<br />
Dr. Muhammad Fahim Khokhar, Post Doc<br />
Dr. Sven Kühl, Post Doc<br />
Dr. Thierry Marbach, Post Doc<br />
Janis Pukite, PhD student<br />
Suniti Sanghavi, PhD student<br />
Abstract<br />
The Satellitegroup is part of the research group Atmospheric Physics of Prof. Dr. Ulrich Platt.<br />
The satellite born remote sensing of the Earth’s atmosphere at the University of Heidelberg started<br />
in 1996 with the retrieval of atmospheric trace gases, namely NO2 and BrO. Today a wide variety of<br />
trace gases and other atmospheric parameters (Aerosols, Clouds, Radiative Transfer) from different<br />
satellite instruments are investigated at the IUP (see also http://satellite.iup.uni-heidelberg.de). In<br />
October 2006 part of the satellite group moved to the Max-Planck-<strong>Institut</strong>e for Chemistry in Mainz.<br />
The group is since then referred to as ’Satellite group Mainz-Heidelberg’.<br />
Scientific Objectives<br />
Since about 10 years now, a new generation of UV/vis/NIR satellite instruments (GOME, SCIA-<br />
MACHY, OMI) with moderate spectral resolution allows the retrieval of a large variety of atmospheric<br />
trace gases. In particular, global maps of several tropospheric trace gases like O3, BrO, NO2, CO,<br />
CH4, CO2, HCHO, SO2, H2O, O2, O4, and cloud properties can be analysed from observations in<br />
nadir viewing mode. The most important advantage of such satellite observations is their spatial (horizontal)<br />
coverage and resolution. The newest generation of nadir looking UV/vis satellite instruments<br />
(e.g. OMI) achieves global coverage within one day and has a horizontal resolution of about 13 x 24<br />
km. From such satellite observations, various individual sources like large cities can be identified. In<br />
addition, the observation of scattered sun light in limb geometry allows to retrieve vertical profiles of<br />
several stratospheric trace gases like O3, NO2, BrO and OClO.
56 CHAPTER 2. ATMOSPHERE AND REMOTE SENSING<br />
Figure 2.27: The timeline of continuous novel UV/vis/NIR satellite measurements starts in April<br />
1995 with GOME (1) on ERS-1. With its successors it will hopefully cover a total period of more<br />
than 25 years.<br />
Main activities<br />
How are single projects linked, list/group the subprojects<br />
The various projects can be classified according to their spectral range, viewing geometry, and<br />
analysis method.<br />
- UV/vis DOAS for Nadir viewing geometry The main target is the determination of global maps<br />
of tropospheric trace gas distributions like NO2, BrO, H2O, HCHO, SO2, Glyoxal. Currently measurements<br />
of GOME and SCIAMACHY are under investigation.<br />
- NIR DOAS for Nadir viewing geometry The main target is the determination of global maps of<br />
tropospheric trace gas distributions like CH4, CO2, and CO. Measurements in the near IR spectral<br />
range are carried out only by SCIAMACHY.<br />
-Cloud retrieval for Nadir viewing geometry The main target is the determination of global maps of<br />
cloud cover (effective cloud fraction) from broad band spectral measurements. From the combination<br />
with narrow band absorption measurements of O2 and O4, also additional parameters like cloud top<br />
height can be retrieved.<br />
-UV/vis DOAS for limb viewing geometry The main target is the determination of vertical profiles<br />
of stratospheric trace gases like O3, NO2, BrO, and OClO. Measurements in limb viewing geometry<br />
are carried out only by SCIAMACHY.<br />
-3-D radiative transfer modelling Detailed radiative transfer modelling is the prerequisite for the<br />
correct interpretation of the results of the spectral analysis. The full spherical 3-dimensional Monte<br />
Carlo model is developed and operated in our group. Also a detailed scheme for the simulation of<br />
radiative properties of aerosols is developed.<br />
-Validation of satellite data with independent observations DOAS observations are carried out<br />
from several ground based stations (Kiruna, Paramaribo, Neumayer) as well as from aircrafts and<br />
ships.<br />
Methods and results From the measured spectra, the narrowband absorption features of several<br />
trace gases are analysed using the DOAS method. The result of the spectral analysis represents the<br />
trace gas absorption integrated along the absorption path. In addition, also the broad band spectral<br />
features are analysed; they yield information in particular on the cloud cover, aerosol load and ground<br />
albedo (in particular also vegetation cover). Various algorithms for the analysis of satellite spectra<br />
were developed in the satellite group within the last years. For the detailed interpretation of the<br />
analysed spectral information, radiative transfer modelling is needed. A 3-D Monte-Carlo radiative<br />
transfer model (TRACY-II) was developed in our group, which allows to simulate various complex<br />
viewing geometries and atmospheric properties. The retrieved global data sets are further investigated<br />
using image sequence techniques.
2.4. SATELLITE GROUP 57<br />
Funding<br />
The group activities are funded through various national and international projects, e.g. EVER-<br />
GREEN, NOVAC, STAR, Tropische Tropopause, ACCENT<br />
Cooperation within the institute and with groups outside of the institute<br />
Intensive interaction and cooperation exists with various international groups, e.g. Uni-Bremen,<br />
IASB Brussels, Uni Mnchen, SRON Utrecht, KNMI Utrecht, EUMETSAT<br />
Future Work<br />
The data analysis will be continued and in particular observations from new instruments (OMI,<br />
GOME-2) will be included.<br />
Peer Reviewed Publications<br />
1. Beirle et al. [2006b]<br />
2. Bergamaschi et al. [2006]<br />
3. Bruns et al. [2006]<br />
4. Butz et al. [2006]<br />
5. Dils et al. [2006]<br />
6. Frankenberg et al. [2006]<br />
7. Frie et al. [2006]<br />
8. Frins et al. [2006]<br />
9. Grzegorski et al. [2006]<br />
10. Hendrick et al. [2006]<br />
11. Loyola et al. [2006]<br />
12. Toenges-Schuller et al. [2006]<br />
13. Wagner et al. [2006e]<br />
14. Wagner et al. [2006j]<br />
15. Wang et al. [2006]<br />
16. Wittrock et al. [2006]<br />
Other Publications<br />
1. Beirle et al. [2006a]<br />
2. Deutschmann & Wagner [2006]<br />
3. Hendrick et al. [2006]<br />
4. Kühl et al. [2006a]<br />
5. Kühl et al. [2006b]<br />
6. Marbach et al. [2006a]<br />
7. Marbach et al. [2006b]<br />
8. Marbach et al. [2006c]
58 CHAPTER 2. ATMOSPHERE AND REMOTE SENSING<br />
9. Marbach et al. [2006d]<br />
10. Pukite et al. [2006b]<br />
11. Pukite et al. [2006c]<br />
12. Pukite et al. [2006a]<br />
13. Sinreich et al. [2006]<br />
14. Wagner et al. [2006d]<br />
15. Wagner et al. [2006c]<br />
16. Wagner et al. [2006f]<br />
17. Wagner et al. [2006g]<br />
18. Wagner et al. [2006h]<br />
19. Wagner et al. [2006b]<br />
20. Wagner et al. [2006i]<br />
21. Wagner et al. [2006a]<br />
Diploma Theses<br />
PhD Theses<br />
1. Khokhar [2006]
2.4. SATELLITE GROUP 59<br />
2.4.1 Satellite observations of Glyoxal<br />
Steffen Beirle (Ulrich Platt, Thomas Wagner)<br />
Abstract Spectral measurements from the satellite instrument SCIAMACHY allow to determine<br />
column densities of several important atmospheric absorbers. Recently, the absorption strucures of<br />
Glyoxal have also been detected in satellite spectra. The mean global glyoxal distribution derived<br />
from SCIAMACHY indicates several photochemical hotspots due to anthropogenic emissions as well<br />
as biogenic and biomass burning VOC emissions.<br />
Figure 2.28: Mean Glyoxal SCD (10 15 molec/cm 2 ) from SCIAMACHY (2003 - 2005).<br />
Background Glyoxal (C2H2O2) is formed by<br />
the oxidation of several volatile organic compounds<br />
(VOCs) and hence serves as an important<br />
indicator for fast VOC chemistry. Glyoxal has<br />
characteristic absorption bands in the blue spectral<br />
range, allowing remote sensing by Differential<br />
Optical Absorption Spectroscopy (DOAS). Here<br />
we present the results of our Glyoxal retrieval from<br />
SCIAMACHY spectra.<br />
Methods and results The DOAS fit has been<br />
implemented for the evaluation of Glyoxal in the<br />
spectral range 436-457 nm. Fig. 2.28 shows the<br />
resulting mean of the global distribution of Glyoxal.<br />
Photochemical hot spots due to anthropogenic<br />
activities can clearly be identified, for instance<br />
Hong Kong or Los Angeles. Also strong biomass<br />
burning events lead to enhanced Glyoxal levels,<br />
e.g. in Brasilia. Generally, the detected Glyoxal<br />
column densities are high over the tropical<br />
rain forest, indicating biogenic VOC emissions.<br />
Also over some bioactive oceanic regions enhanced<br />
Glyoxal levels are found, possibly indicating VOC<br />
emissions over ocean.<br />
Outlook/Future work Future efforts will have<br />
to be taken to come to more quantitative statements.<br />
Especially over oceanic regions, the DOAS<br />
fit has to be improved, involving high resolved<br />
spectral structures of liquid water and chlorophyll<br />
absorption.<br />
Ongoing measurements from SCIAMACHY<br />
and also GOME-2, launched in November 2006,<br />
will lead to reduced statistical errors and will allow<br />
to assess several scientific questions like spatial<br />
distributions and/or seasonal cycles of VOC<br />
emissions or to distinguish between VOC and NOx<br />
limited summer smog regimes.<br />
Funding DFG / ’Eigene Stelle’.<br />
Main publication Wittrock et al. [2006]
60 CHAPTER 2. ATMOSPHERE AND REMOTE SENSING<br />
2.4.2 Development of a Radiative Transfer Forward Model<br />
Tim Deutschmann (Thomas Wagner, Ulrich Platt)<br />
Abstract Radiative transfer modelling (RTM) plays a key role in profile retrieval of atmospheric<br />
trace gases and correct interpretation of spectral measurement results provided by remote sensing<br />
techniques. The developed model is applicable to a manifold of different measurement geometries,<br />
and allows realistic modelling of the transfer process using a Monte Carlo method.<br />
Figure 2.29: Backward trajectory scatter events. Red/Blue: rayleigh/raman s.e., yellow: ground s.e.,<br />
green: aerosol s.e.. Left: measurement from inside a caldera at 360 nm with aerosol layer (1.15km-<br />
1.35km). Center: measurement of a volcanic plum from satellite at 440 nm. Right: The plum as<br />
measured from the ground.<br />
Background Various remote sensing techniques<br />
that use satellites, are ground based or<br />
airborne provide spectra in UV-VIS spectral<br />
range. Applying the DOAS (Differential Optical<br />
Absorption Spectroscopy) method, slant column<br />
densities of several absorbing species can be extracted<br />
from the raw spectra. The slant column<br />
of a trace gas is a path integral of its number density<br />
along the light path. Due to multiple scattering<br />
on air molecules, scattering and absorption on<br />
aerosol particles and absorption by trace gases the<br />
light path is complex. For the inversion of trace<br />
gas profiles, the radiative transfer process must be<br />
modelled using a so called forward modell.<br />
Funding HiWi, soon Diploma Thesis.<br />
Methods and Results The most flexible<br />
method to solve the equation of transfer is the<br />
Monte Carlo method. Using random numbers,<br />
photon trajectories, which obey the physical transition<br />
densities are generated. The developed<br />
modell TRACY-II uses the Backward Monte<br />
Carlo method, which exploits the reciprocity of<br />
the transfer process to generate the trajectories.<br />
Each scatter event of the backward trajectory represents<br />
a physical light path by completing the<br />
light path from the scatter event to the sun. The<br />
amount of sun photons taking this path is measured<br />
by calculating a corresponding weight. The<br />
weight is the product of probabilities, that 1. the<br />
sun photon reaches the first scatter event and 2.<br />
takes the path into the direction of the next scatter<br />
event resp. the detector. Using this formalism<br />
various quantities like intensities, weighting<br />
functions or simulated slant column densities are<br />
calculated.<br />
The existing model was validated during the<br />
ACCENT RTM workshop on 12th of June 2006<br />
and showed excellent agreement with other modells.<br />
Preliminary comparisons with balloon measurements<br />
showed agreement within the measurement<br />
error.<br />
Outlook/Future Work In near future the calculation<br />
of partial derivatives will be focused, in<br />
order to investigate instrument sensitivity on different<br />
parameters. A promising possibility of information<br />
retrieval from measurement is to take<br />
polarization of light by scattering into account.<br />
The models flexibility allows applications in a<br />
wide range of investigations, not only in UV-VIS<br />
spectral range but also in IR.<br />
Main Publication Deutschmann & Wagner<br />
[2006] Wagner et al. [2006d]
2.4. SATELLITE GROUP 61<br />
2.4.3 Retrieval of cloud parameters using SCIAMACHY and GOME data<br />
Michael Grzegorski (Thomas Wagner 1 , Tim Deutschmann, Mark Wenig 2 , Ping Wang 3 , Piet<br />
Stammes 3 )<br />
1 also at Max Planck <strong>Institut</strong>e for chemistry, Mainz<br />
2 NASA Goddard Space Flight Center, Greenbelt, Maryland, USA<br />
3 Royal Meteorological <strong>Institut</strong>e of the Netherlands, KNMI, Utrecht, The Netherlands<br />
Abstract The retrieval of cloud parameters like cloud coverage, cloud top pressure or cloud optical<br />
thickness from satellite is an important issue both for climatology and the analysis of tropospheric<br />
trace gases. The HICRU algorithm improves retrieval of effective cloud fraction using data from<br />
SCIAMACHY on ENVISAT and GOME on ERS-2. The combination of HICRU data with the DOAS<br />
evaluation of O 2 and O 4 allows the retrieval of further cloud parameters.<br />
Figure 2.30: RGB image of the cloud free earth retrieved by HICRU applied to SCIAMACHY data.<br />
The PMD4 (805-900 nm) is used as green channel, because the PMD instruments only provide blue<br />
and red in the visual wavelength bands.<br />
Background The detection of cloud parameters<br />
like cloud coverage, cloud top pressure or<br />
cloud optical thickness from satellite is an important<br />
issue: 1.) for meteorology and the investigation<br />
of climate change and 2.) for the analysis of<br />
tropospheric trace gases from space relevant to environmental<br />
and climatological issues. Although<br />
the retrieval of different cloud parameters is useful<br />
for trace gas retrievals, especially the accurate<br />
identification of completely cloud free regions is<br />
crucial due to the shielding effect, which causes<br />
an underestimation of the vertical column density<br />
of tropospheric trace gases measured by satellite.<br />
Methods and results The Heidelberg Iterative<br />
Cloud Retrieval Utilities (HICRU) retrieve effective<br />
cloud fraction by applying the widely used<br />
threshold method combined with image sequence<br />
analysis and an iterative approach to the socalled<br />
Polarization Monitoring Devices (PMDs)<br />
with higher spatial resolution compared to the<br />
channels used for trace gas retrievals. The algo-<br />
rithm is published in 2006 and was part of validation<br />
studies for the official SCIAMACHY data<br />
product. These studies show the improvement of<br />
HICRU compared to other cloud algorithms, especially<br />
over deserts. Problems of the next release<br />
of the official data product from ESA are worked<br />
out. A DOAS evaluation of O 2 and O 4 is successfully<br />
implemented and it is proven, that the<br />
combination with HICRU allow the retrieval of<br />
at least one further cloud parameter (cloud top<br />
height).<br />
Outlook/Future work The radiation transfer<br />
model TRACY will be used to retrieve modelled<br />
air mass factors of O 2 and O 4 . These will be used<br />
to retrieve a new database containing cloud top<br />
height information.<br />
Funding EVERGREEN (EU project)<br />
Main publication Grzegorski et al. [2006]
62 CHAPTER 2. ATMOSPHERE AND REMOTE SENSING<br />
2.4.4 Analysis of GOME Observations for Anthropogenic SO2 Emissions<br />
over China<br />
M. Fahim Khokhar<br />
Abstract Fossil fuels such as coal and oil contain significant amounts of sulfur. When burned,<br />
this sulfur is generally converted to SO2. GOME observations showed enhancements of SO2 column<br />
amounts due to anthropogenic emission sources around the globe. These enhancements are identified<br />
from the regions with extensive burning of coal and heavy industrial activities such as from China,<br />
Eastern USA, the Arabian Peninsula, Eastern Europe and South Africa. A temporal increase during<br />
the time period of 1996-2002 attributable to coal consumption in China is identified.<br />
Figure 2.31: Time series of monthly mean SO2 SCD calculated from GOME observations for 1996-<br />
2002 over Beijing and Shanghai. Fitted lines indicate the temporal increase in SO2 emissions of 15%<br />
and 21% with winter maximum over Shanghai and Beijing respectively. Figure (adapted from [Zhou,<br />
2001]) in nut shell shows the increase in fuel (coal) in china and black rectangle indicates the period<br />
consistent to GOME observations.<br />
Background satellite remote sensing is useful<br />
tool to have information about various atmospheric<br />
trace gas emissions and their distribution<br />
on a global scale. Satellite instruments having<br />
broader spectral range and better temporal resolution<br />
(few days for global coverage) give us opportunity<br />
to observe the whole globe with same<br />
instrument and consequently help to discriminate<br />
the spatial and temporal variations which make<br />
them advantageous over other conventional instruments.<br />
Methods and results GOME (Global Ozone<br />
Monitoring Experiment, on-board ERS-2 since<br />
1995) is a nadir-scanning UV-Vis. spectrometer<br />
covering the wavelength range from 240 nm to 790<br />
nm. From the ratio of earthshine radiance and<br />
solar irradiance measurements, slant column densities<br />
(SCD) of SO2 are derived by applying the<br />
technique of differential optical absorption spec-<br />
troscopy (DOAS). China’s rapid growth in industrial<br />
activities unbalanced the growth and utilities<br />
of electricity in China. Therefore, it exerts pressure<br />
on coal mining in order to meet the electricity<br />
demands and consequently leads to an increase<br />
in environmental pollution. Figure in nut shell<br />
indicates coal as a major source of fuel for thermal<br />
power plants since 1990 and time series reflect<br />
18% increase in the coal consumption by Chinese<br />
power plants during the GOME time period of<br />
1996-2002 (black box). Extensive use of coal in<br />
China resulted in increase in SO2 emissions as obvious<br />
from time series calculated over Shanghai<br />
and Beijing region with temporal increase of 15%<br />
and 21% respectively (see figure).<br />
Funding PhD thesis (SCIA Validation).<br />
Main Publication Khokhar [2006]
2.4. SATELLITE GROUP 63<br />
2.4.5 Vertical OClO and BrO profiles from SCIAMACHY limb measurements<br />
Sven Kühl<br />
Abstract Vertcial profiles of BrO and OClO were retrieved from SCIAMACHY limb observations<br />
and compared to ballon borne, groundbased and satellite measurements. The profiles are in accord<br />
with expextations from stratopsheric chemistry and in quantitative agreement with the independent<br />
measurements.<br />
Figure 2.32: Left: BrO profiles derived from SCIAMACHY limb observations (black) in comparison<br />
to correlative balloon measurements (red). Right: OClO number density at 18 km for the northern<br />
hemisphere during selected days in January 2005 in comparison to the temperature and the ClO<br />
mixing ratio measured by AURA-MLS at the 490 K Level ( 18km).<br />
Background In the polar winter, temperatures<br />
inside the polar vortex can drop below the threshold<br />
for formation of polar stratospheric clouds<br />
(PSCs) which is e.g. 195 K at an altitude of approx.<br />
19 km. Heterogeneous reactions on PSCparticles<br />
convert the ozone-inert chlorine reservoirs<br />
(mainly ClONO2 and HCl) into ozone destroying<br />
species (active chlorine, mainly Cl, ClO<br />
and ClOOCl). This chlorine activation is the prerequisite<br />
for massive ozone destruction by catalytic<br />
cycles like the ClO-ClOOCl and the ClO-<br />
BrO cycle after the return of sunlight in the polar<br />
spring. Vertical profiles of BrO and OClO can<br />
be derived from the SCIAMACHY observations<br />
in the limb viewing geometry (i.e. tangential to<br />
Earth and its atmosphere). Compared to measurements<br />
of total columns the knowledge about<br />
the vertical distribution allows to establish correlations<br />
in a much more quantitative manner.<br />
Methods and results For the retrieval of vertical<br />
profiles from SCIAMACHY limb spectra we<br />
apply a two step approach: First, SCDs of the<br />
respective absorbers are derived by DOAS. In<br />
the second step, box AMFs calculated by the<br />
Monte Carlo RTM Tracy-II are applied to convert<br />
the SCDs (as function of tangent height) to<br />
vertical concentration profiles (number density as<br />
function of altitude). First results on BrO and<br />
OClO profiles were compared to independent measurements.<br />
For OClO there exist no correlative<br />
observations for SCIAMACHY validation so far.<br />
Therefore, the OClO results are compared to ClO<br />
measurements by AURA-MLS.<br />
Outlook/Future work Improvment of retrieval,Investigating<br />
OClO photochemistry by<br />
combination of measurements in limb, nadir and<br />
occultation geometry. Evaluation of the whole<br />
SCIAMACHY data set for NO2, BrO and OClO<br />
profiles. Monitoring of chlorine and bromine activation,<br />
case studies (e.g. mountain wave-induced<br />
chlorine activation)<br />
Main publication Kühl et al. [2006a]
64 CHAPTER 2. ATMOSPHERE AND REMOTE SENSING<br />
2.4.6 New GOME-Retrieval for Formaldehyde (HCHO) using daily mean<br />
Earthshine Reference<br />
Thierry Marbach<br />
Abstract A new GOME-retrieval has been implemented for the trace gas formaldehyde (HCHO)<br />
with daily mean earthshine as reference for the DOAS-fit. The cross-sections related to this new<br />
retrieval are also calibrated against an earthshine spectra. The results (Figure 2.33) show a better<br />
consistence of the data compare to the retrieval using the daily sun reference.<br />
Figure 2.33: One day formaldehyde slant column density results (HCHO SCD) using the new GOMEretrieval<br />
with daily mean earthshine reference and localization of the earthshine reference area (in<br />
magenta).<br />
Background The former GOME-retrieval used<br />
a daily sun reference as well as sun-calibrated<br />
cross sections for the DOAS-fit. The daily sun<br />
reference is measured by the GOME instrument<br />
once a day. This operation did not taken place<br />
properly for some months. The alternative solution<br />
was to use a fix sun reference instead of the<br />
daily reference for the fit, but that induced offsets<br />
in the results as well as many bad results. To<br />
avoid these problems, we propose to calculate a<br />
daily mean earthshine reference.<br />
Methods and results The DOAS-fit has been<br />
implemented for the evaluation of formaldehyde<br />
(HCHO) in the spectral range 337-360 nm using<br />
earthshine calibrated cross sections. The daily<br />
sun reference has been replaced through a daily<br />
earthshine reference. This reference is calculated<br />
by doing the mean of the GOME measured pixels<br />
situated in a 30 degree wide area over the Pacific<br />
ocean (150W-180W; Figure 2.33). All calibrated<br />
cross sections are linked to the daily mean earthshine<br />
reference spectra for the DOAS fit.<br />
One of the main improvement is the better<br />
localization of the weaker sources (about<br />
2.4x10 16 molec.cm −2 ) like over south-east China,<br />
north India, east USA, and in general an improvement<br />
for the higher latitudes (Figure 2.33). Some<br />
of these weaker HCHO SCD (slant column density)<br />
can also be detected over the oceans like over<br />
the Gulf of Congo or over the coast of Peru. These<br />
observations can be related to those made for the<br />
Glyoxal results presented in this report by Steffen<br />
Beirle (report 2.4.1) who also show over the same<br />
bioactive oceanic regions enhanced Glyoxal levels,<br />
possibly indicating VOC emissions over ocean.<br />
The expected higher HCHO SCD over the evergreen<br />
forests (Amazon basin, Indonesia) for this<br />
season due to biomass burning and/or isoprene<br />
emissions still clearly identify in the results (figure<br />
2.33).<br />
Outlook/Future work The next step is to implemente<br />
a DOAS-fit using a daily mean earthshine<br />
reference for the evaluation of HCHO<br />
from the SCIAMACHY data and maybe also for<br />
GOME-2. The DOAS fit can also be adapted for<br />
other trace gases.<br />
Funding The German Research Foundation<br />
(DLR) is gratefully acknowledged for providing<br />
the financial support.
2.4. SATELLITE GROUP 65<br />
2.4.7 Radiative Transfer Modeling by Monte Carlo method for SCIA-<br />
MACHY limb geometry in the UV/VIS spectral range<br />
Janis Pukite<br />
Abstract Number density profiles of O3, NO2, BrO and OClO can be obtained from SCIAMACHY<br />
limb measurements in the UV-VIS spectral region: first, slant column densities of trace gas are<br />
retrieved by DOAS from SCIAMACHY measurements at different elevation angles. Second, vertical<br />
profiles are derived by inverting the SCDs. For that purpose radiative transfer modelling is necessary.<br />
LOS elevation 39 km τ (340.25 nm)=0.23<br />
LOS elevation 15 km τ (340.25 nm)=7.4<br />
Figure 2.34: Illustration of scattering events (Rayleigh in red, ground in yellow) of photons contributing<br />
to the measured signal in limb geometry at line of sight elevations of 39 and 15 km at tangent<br />
point as calculated by ”Tracy-II”. Due to the large optical thickness for low elevation angles, the<br />
contribution to measured light close to tangent point (TP) is small. Therefore 1) the sensitivity for<br />
low altitudes (¡15 km) is low and 2) the measurements contain information about the atmosphere<br />
between the region where scattering occurs and the instrument.<br />
Background SCIAMACHY (Scanning Imaging<br />
Absorption Spectrometer for Atmospheric<br />
Chartography) on ENVISAT-1 measures solar<br />
UV-VIS-NIR radiation transmitted, backscattered<br />
and reflected by the atmosphere and the<br />
ground. The limb-scanning mode is implemented<br />
by the instrument allowing to perform measurements<br />
at different elevation angles. From the measurements,<br />
Slant column densities (SCDs) are retrieved.<br />
The trace gas SCDs retrieved by DOAS<br />
are indirect measurements of the profiles: they<br />
contain information about their concentration at<br />
different altitudes, related with the length of the<br />
light path crossing these layers. This relation can<br />
be described by a forward model. To connect the<br />
measurements with spatial distribution of trace<br />
gas concentrations in the atmosphere, radiative<br />
transfer modelling needs to be applied.<br />
Methods and results For the RTM the full<br />
spherical Monte Carlo 3D model ”Tracy-II”, (sec-<br />
TP<br />
TP<br />
tion 2.4.2) is used. The Monte Carlo method benefits<br />
from conceptual simplicity and allows realizing<br />
the spherical geometry of the atmosphere and<br />
also its 3D properties. Moreover the model is assuming<br />
every light path and scattering event (fig.<br />
2.34) in terms of probability to take place. When<br />
many light paths are calculated their statistics determine<br />
radiative transfer properties of a model<br />
atmosphere. This allows to calculate box air mass<br />
factors necessary to invert the forward model and<br />
to study the 3D sensitivity field of measurement.<br />
Outlook/Future work A 2D retrieval will be<br />
implemented for northern polar region and the<br />
sensitivity field of measurement field will be studied.<br />
Funding German national funding: Virtual institute<br />
Tropische Tropopause’
66 CHAPTER 2. ATMOSPHERE AND REMOTE SENSING<br />
2.4.8 Satellite observations of global water vapor trends 1996 - 2003<br />
Thomas Wagner<br />
Abstract From modern UV/vis satellite instruments, the integrated water vapor concentration<br />
(often referred to as vertical column density or total column precipitable water) can be observed on<br />
a global scale. In contrast to previous satellite observations in the infrared and microwave spectral<br />
range our observations include both ocean and land surfaces with similar sensitivity.<br />
Surface temperature trend 1996 – 2002 Trend of the H2O VCD 1996 – 2002<br />
Figure 2.35: Global trend patterns of yearly averaged total column precipitable water and surface<br />
temperature (from http://www.giss.nasa.gov/data/update/gistemp/). The trends of the total column<br />
precipitable water are expressed as relative trends per year. Dark blue color indicates areas without<br />
data.<br />
Background Atmospheric water vapor is the<br />
most important greenhouse gas contributing<br />
about 2/3 of the natural greenhouse effect. In<br />
contrast to other greenhouse gases like CO2 and<br />
CH4 it has a much higher temporal and spatial<br />
variability. The correct understanding and assessment<br />
of atmospheric water vapor with respect to<br />
the earths energy budget is further complicated<br />
by its role in cloud formation and transport of<br />
latent heat. Today, many details of how the hydrological<br />
cycle reacts to climate change (water<br />
vapor feedback) are still not understood. Especially<br />
for the tropics, which contribute strongest<br />
to the water vapor greenhouse effect, the strength<br />
of the water vapor feedback is under intense debate.<br />
In our studies we investigate the dependence<br />
of the global distribution of water vapor<br />
on surface temperature. Especially in the tropics<br />
and the southern hemisphere many similarities<br />
between the trend patterns of the total column<br />
precipitable water and the temperature are<br />
found. Over the northern hemispheric continents<br />
also opposite trends occur.<br />
Methods and results Our water vapor algorithm<br />
is based on Differential Optical Absorp-<br />
tion Spectroscopy (DOAS) performed in the wavelength<br />
interval 611-673 nm. It consists of three<br />
basic steps (described in detail in Wagner et al.<br />
[2003]): in the first step, the spectral DOAS fitting<br />
is carried out, taking into consideration cross<br />
sections of O2 and O4 in addition to that of water<br />
vapor. From the DOAS analysis, the water<br />
vapor slant column density (the concentration integrated<br />
along the light path) is derived. In the<br />
second step, the water vapor slant column density<br />
is corrected for the non-linearity arising from<br />
the fact that the fine structure water vapor absorption<br />
lines are not spectrally resolved by the<br />
GOME instrument. In the last step, the corrected<br />
water vapor slant column density is divided by a<br />
’measured’ air mass factor which is derived from<br />
the simultaneously retrieved O4 or O2 absorptions<br />
[Wagner et al., 2006a].<br />
Outlook/Future work The work will be continued<br />
by applying the method to new satellite<br />
instruments like SCIAMACHY and the GOME-<br />
2-series. It can be expected that the time series<br />
can be continued until 2020.<br />
Main publication Wagner et al. [2006e]
2.4. SATELLITE GROUP 67<br />
2.4.9 MAXDOAS observations on board the research vessel Polarstern<br />
Thomas Wagner<br />
Abstract MAX-DOAS measurements were carried on board the Polarstern from October 2005 to<br />
present. Stratospheric and tropospheric trace gases are analysed including O3, NO2, HCHO, O4, and<br />
BrO. During Austral winter 2006 the ship stayed in the area of first year sea ice for several weeks.<br />
During this period almost continuously enhanced tropospheric BrO concentrations were measured.<br />
Latitude [ ]<br />
temperature [ C]<br />
[W/m2]<br />
[1014 molec/cm2]<br />
-30<br />
-40<br />
-50<br />
-60<br />
-70<br />
20<br />
10<br />
0<br />
-10<br />
-20<br />
-30<br />
1E+3<br />
1E+2<br />
1E+1<br />
1E+0<br />
15<br />
10<br />
5<br />
0<br />
a)<br />
b)<br />
c)<br />
d)<br />
Ice edge<br />
temperature<br />
water<br />
air<br />
Global radiation<br />
Sun elevation<br />
Ship<br />
BrO DSCD 1° elevation<br />
17-Jun 27-Jun 7-Jul 17-Jul 27-Jul 6-Aug 16-Aug<br />
Time<br />
Figure 2.36: Daily maximum BrO DSCDs for 1<br />
degree elevation angle (d). Also shown are the<br />
latitude of the ship and the ice edge (a), the temperatures<br />
of air and water (b) as well as daily maximum<br />
values of the global radiation and the sun<br />
elevation (c). High BrO DSCDs are only found for<br />
measurements within the area of first year sea ice<br />
(indicated also by the water temperature < 0 0 C).<br />
For low sun elevation (< −2.8 0 ) also no enhanced<br />
BrO DSCDs were found.<br />
Background The Multi AXis Differential Optical<br />
Absorption Spectroscopy (MAX-DOAS) technique<br />
allows to separate the absorptions taken<br />
place at different altitudes in the atmosphere by<br />
50<br />
30<br />
10<br />
-10<br />
Sun elevation [°]<br />
observing scattered sun light from a variety of<br />
viewing directions. This is possible because for<br />
most measurement conditions, the observed light<br />
is scattered in the free troposphere. Thus air<br />
masses located close to the ground are traversed<br />
on a slant absorption path determined by the<br />
viewing direction; in contrast, stratospheric air<br />
masses are traversed on a slant absorption path<br />
determined by solar zenith angle. In addition to<br />
the partial columns of various trace gases (like<br />
NO2, BrO, HCHO, etc.) also information on the<br />
aerosol profile can be retrieved.<br />
Methods and results MAX-DOAS observations<br />
were carried out during an extended ship<br />
cruise from October 2005 to May 2007. MAX-<br />
DOAS observations were continuously performed<br />
using a mainly automated instrumentation. From<br />
the MAX-DOAS observations latitudinal cross<br />
sections of stratospheric O3 and NO2 were retrieved.<br />
The O3 data were compared to satellite<br />
observations from SCIAMACHY, and very good<br />
agreement was achieved. During Austral winter<br />
2006 enhanced tropospheric BrO concentrations<br />
were observed for several weeks when the ship was<br />
inside the belt of first year sae ice.<br />
Outlook/Future work The data analysis will<br />
be continued until the end of the cruise. It is foreseen<br />
to install the MAX-DOAS as a permanent<br />
instrument on board the Polarstern.<br />
Funding The MAX-DOAS observations were<br />
supported by the Alfred Wegener <strong>Institut</strong>e in Bremerhaven.<br />
Main publication Wagner et al. [2006c,d];<br />
Frins et al. [2006]
68 CHAPTER 2. ATMOSPHERE AND REMOTE SENSING<br />
2.4.10 Satellite monitoring of different vegetation types by differential optical<br />
absorption spectroscopy (DOAS) in the red spectral range<br />
Thomas Wagner<br />
Abstract A new method for the satellite remote sensing of different types of vegetation and ocean<br />
colour is presented, which is based weak narrow-band (few nm) spectral reflectance structures (i.e.<br />
’fingerprint’ structures) of vegetation in the red spectral range. The global maps of the results illustrate<br />
the seasonal cycles of different vegetation types.<br />
Figure 2.37: Global monthly mean results of the DOAS retrieved fitting coefficients for (the logarithms<br />
of the) different vegetation spectra (top: conifers, centre: deciduous, bottom: grass). The results for<br />
deciduous trees and grass are very similar; those for conifers show different spatial patterns. The effect<br />
of the seasonal cycle is clearly visible.<br />
Background Vegetation has a strong influence<br />
on the cycles of trace gases and other important<br />
properties of the earth system, in particular the<br />
earth’s energy budget. Vegetation modifies the<br />
ground albedo and thus has a strong impact on the<br />
amount of backscattered solar energy. Vegetation<br />
also strongly influences the water cycle through<br />
its influence on evaporation; the release of latent<br />
heat is important for the latitudinal energy distribution.<br />
Plants are also sources and/or sinks for<br />
many important trace gases, in particular greenhouse<br />
gases. Therefore, the precise knowledge<br />
of the spatio-temporal variation of the biological<br />
activity is an important prerequisite for the correct<br />
understanding and simulation of global trace<br />
gas budgets and of the earth’s climate. Of special<br />
importance is the monitoring of the humaninduced<br />
change of the global vegetation patterns,<br />
e.g. caused by biomass burning or climate change.<br />
Methods and results Our vegetation algorithm<br />
is based on Differential Optical Absorp-<br />
tion Spectroscopy (DOAS) performed in the wavelength<br />
interval 605-673 nm. In contrast to existing<br />
algorithms relying on the strong change of the<br />
reflectivity in the red and near infrared spectral<br />
region, our method analyses weak narrow-band<br />
(few nm) reflectance structures (i.e. ’fingerprint’<br />
structures) of vegetation in the red spectral range.<br />
Since the spectra of atmospheric absorption and<br />
vegetation reflectance are simultaneously included<br />
in the analysis, the effects of atmospheric absorptions<br />
are automatically corrected (in contrast to<br />
other algorithms). The inclusion of the vegetation<br />
spectra also significantly improves the results<br />
of the trace gas retrieval.<br />
Outlook/Future work The work will be continued<br />
by applying the method to new satellite<br />
instruments like SCIAMACHY and the GOME-<br />
2-series. It can be expected that the time series<br />
can be continued until 2020.<br />
Main publication Wagner et al. [2006e,j]
2.4. SATELLITE GROUP 69<br />
References<br />
Beirle, S., Volkamer, R., Wittrock, F., Richter, A., Burrows, J., Platt, U., & Wagner, T. 2006a.<br />
DOAS RETRIEVAL OF GLYOXAL FROM SPACE. Proceedings of the ESA Atmospheric Science<br />
Conference, 8-12 May 2006, ESA ESRIN, Frascati, Italy.<br />
Beirle, S., Spichtinger, N., Stohl, A., Cummins, K. L., Turner, T., Boccippio, D., Cooper, O. R., Wenig,<br />
M., Grzegorski, M., Platt, U., & Wagner, T. 2006b. ESTIMATING THE NOx PRODUCED BY<br />
LIGHTNING FROM GOME AND NLDN DATA: A CASE STUDY IN THE GULF OF MEXICO.<br />
Atmos. Chem. Phys., 6, 10751089.<br />
Bergamaschi, P., Frankenberg, C., Meirink, J. F., Kroll, M., Dentener, F., Wagner, T., Platt, U., Kaplan,<br />
J. O., Körner, S., Heimann, M., Dlugokencky, E. J., & Goede, A. 2006. SATELLITE CHAR-<br />
TOGRAPHY OF ATMOSPHERIC METHANE FROM SCIAMACHY ONBOARD ENVISAT: (II)<br />
EVALUATION BASED ON INVERSE MODEL SIMULATIONS. J. Geophys. Res., accepted.<br />
Bruns, M., Buehler, S. A., Burrows, J. P., Richter, A., Rozanov, A., Wang, P., Heue, K.-P., Platt, U.,<br />
Pundt, I., & Wagner, T. 2006. NO2 PROFILE RETRIEVAL USING AIRBORNE MULTI AXIS<br />
UV-VISIBLE SKYLIGHT ABSORPTION MEASUREMENTS OVER CENTRAL EUROPE. Atmos.<br />
Chem. Phys., 6, 3049–3058.<br />
Butz, A., Bösch, H., Camy-Peyret, C., Chipperfield, M., Dorf, M., Dufour, G., Grunow, K., Jeseck,<br />
P., Kühl, S., Payan, S., Pepin, I., Pukite, J., Rozanov, A., von Savigny, C., Sioris, C., Wagner,<br />
T., Weidner, F., & Pfeilsticker, K. 2006. INTER-COMPARISON OF STRATOSPHERIC O3 AND<br />
NO2 ABUNDANCES RETRIEVED FROM BALLOON BORNE DIRECT SUN OBSERVATIONS<br />
AND ENVISAT/SCIAMACHY LIMB MEASUREMENTS. Atmos. Chem. Phys., 6, 1293–1314.<br />
Deutschmann, T., & Wagner, T. 2006. TRACY-II Users Manual.<br />
Dils, B., De Maziere, M., Blumenstock, T., Buchwitz, M., de Beek, R., Demoulin, P., Duchatelet, P.,<br />
Fast, H., Frankenberg, C., Gloudemans, A., Griffith, D., Jones, N., Kerzenmacher, T., Kramer, I.,<br />
Mahieu, E., Mellqvist, J., Mittermeier, R. L., Notholt, J., Rinsland, C. P., Schrijver, H., Smale,<br />
D., Strandberg, A., Straume, A. G., Stremme, W., Strong, K., Sussmann, R., Taylor, J., van den<br />
Broek, M., Wagner, T., Warneke, T., Wiacek, A., & Wood, S. 2006. COMPARISONS BETWEEN<br />
SCIAMACHY AND GROUND-BASED FTIR DATA FOR TOTAL COLUMNS OF CO, CH4, CO2<br />
AND N2O. Atmos. Chem. Phys., 6, 1953–1976.<br />
Frankenberg, C., Meirink, J. F., Bergamaschi, P., Goede, A., Heiman, M., Körner, S., Platt, U., van<br />
Weele, M., & Wagner, T. 2006. SATELLITE CHARTOGRAPHY OF ATMOSPHERIC METHANE<br />
FROM SCIAMACHY ON BOARD ENVISAT: ANALYSIS OF THE YEARS 2003 AND 2004. J.<br />
Geophys. Res., 111, D07303, doi:10.1029/2005JD006235.<br />
Frie, F., Monks, P. S., Remedios, J. J., Rozanov, A., Sinreich, R., Wagner, T., & Platt, U. 2006.<br />
MAX-DOAS O4 MEASUREMENTS: A NEW TECHNIQUE TO DERIVE INFORMATION ON<br />
ATMOSPHERIC AEROSOLS. (II) MODELLING STUDIES. J. Geophys. Res., 111, D14203,<br />
doi:10.1029/2005JD006618.<br />
Frins, E., Bobrowski, N., Platt, U., & Wagner, T. 2006. TOMOGRAPHIC MAX-DOAS OBSERVA-<br />
TIONS OF SUN ILLUMINATED TARGETS: A NEW TECHNIQUE PROVIDING WELL DE-<br />
FINED ABSORPTION PATHS IN THE BOUNDARY LAYER. Applied Optics, 45, 6227–6240.<br />
Grzegorski, M., Wenig, M., Platt, U., Stammes, P., Fournier, N., & Wagner, T. 2006. THE HEIDEL-<br />
BERG ITERATIVE CLOUD RETRIEVAL UTILITIES (HICRU) AND ITS APPLICATION TO<br />
GOME DATA. Atmos. Chem. Phys., 6, 4461–4476.<br />
Hendrick, F., Van Roozendael, M., De Maziere, M., Richter, A., Rozanov, A., Sioris, C., Dorf, M.,<br />
Kühl, S., Pukite, J., Wagner, T., & Goutail, F. 2006. BrO PROFILING FROM GROUND-BASED<br />
DOAS OBSERVATIONS: NEW TOOL FOR THE ENVISAT/SCIAMACHY VALIDATION. proceedings<br />
of the ESA Atmospheric Science Conference, 8-12 May 2006, ESA ESRIN, Frascati, Italy.<br />
Khokhar, M. F. 2006. RETRIEVAL AND INTERPRETATION OF TROPOSPHERIC SO2 FROM<br />
UV-VIS SATELLITE INSTRUMENTS. PhD Thesis, University of Leipzig.<br />
Kühl, S., Pukite, J., Deutschmann, T., Platt, U., & Wagner, T. 2006a. SCIAMACHY Limb Measurements<br />
of NO2, BrO and OClO. Retrieval of vertical profiles: Algorithm, first results and validation.<br />
Adv. Space Res., in review.
70 CHAPTER 2. ATMOSPHERE AND REMOTE SENSING<br />
Kühl, S., Pukite, J., Deutschmann, T., Dorf, M., Hendrick, F., Platt, U., & Wagner, T. 2006b.<br />
STRATOSPHERIC OClO AND BrO PROFILES FROM SCIAMACHY LIMB MEASUREMENTS.<br />
Proceedings of the ACVE-3 Workshop, 4 7 December, Frascati, Italy, 2006.<br />
Loyola, D., Valks, P., Ruppert, T., Richter, A., Wagner, T., van der A, R., & Meisner, R. 2006.<br />
THE 1997 EL NIÑO IMPACT ON CLOUDS, WATER VAPOUR, AEROSOLS AND REACTIVE<br />
TRACE GASES IN THE TROPOSPHERE, AS MEASURED BY THE GLOBAL OZONE MON-<br />
ITORING EXPERIMENT. Advances in Geosciences, 6, 267 272.<br />
Marbach, T., Beirle, S., Platt, U., & Wagner, T. 2006a. IDENTIFICATION OF HCHO SOURCES<br />
DUE TO ISOPRENE OR/AND BIOMASS BURNING EMISSIONS USING COMBINED HCHO<br />
AND NO2 SATELLITE OBSERVATIONS. 36th COSPAR Scientific Assembly Abstracts, A1.1-<br />
0063.06.<br />
Marbach, T., Beirle, S., Platt, U., & Wagner, T. 2006b. ISOPRENE AND BIOMASS BURNING<br />
EMISSIONS FROM SATELLITE OBSERVATIONS: SYNERGISTIC USE OF HCHO AND NO2<br />
TRACE GAS MEASUREMENTS. ESA Atmospheric Science Conference abstract book.<br />
Marbach, T., Beirle, S., Platt, U., & Wagner, T. 2006c. ISOPRENE AND BIOMASS BURNING<br />
EMISSIONS FROM SATELLITE OBSERVATIONS: SYNERGISTIC USE OF HCHO AND NO2<br />
TRACE GAS MEASUREMENTS. Geophysical Research Abstracts, 8, 07665.<br />
Marbach, T., Beirle, S., Platt, U., & Wagner, T. 2006d. ISOPRENE AND BIOMASS BURNING<br />
EMISSIONS FROM SATELLITE OBSERVATIONS: SYNERGISTIC USE OF HCHO AND NO2<br />
TRACE GAS MEASUREMENTS. 3rd International DOAS Workshop abs. Vol.<br />
Pukite, J., Kühl, S., Deutschmann, T., Wilms-Grabe, W., Platt, U., & Wagner, T. 2006a. LIMB<br />
RETRIEVAL OF STRATOSPHERIC TRACE GASES FROM SCIAMACHY USING MONTE<br />
CARLO RADIATIVE TRANSFER MODELING. 3rd International DOAS Workshop abs. Vol.<br />
Pukite, J., Kühl, S., Deutschmann, T., Wilms-Grabe, W., Friedeburg, C., Platt, U., & Wagner,<br />
T. 2006b. RETRIEVAL OF STRATOSPHERIC TRACE GASES FROM SCIAMACHY LIMB<br />
MEASUREMENTS. Proceedings of the ESA Atmospheric Science Conference, 8-12 May 2006,<br />
ESA ESRIN, Frascati, Italy.<br />
Pukite, J., Kühl, S., Deutschmann, T., Wilms-Grabe, W., Friedeburg, C., Platt, U., & Wagner,<br />
T. 2006c. RETRIEVAL OF STRATOSPHERIC TRACE GASES FROM SCIAMACHY LIMB<br />
MEASUREMENTS. Geophysical Research Abstracts, 8, 08102.<br />
Sinreich, R., Volkamer, R., Filsinger, F., Frie, U., Kern, C., Platt, U., Sebastian, O., & Wagner, T.<br />
2006. MAX-DOAS DETECTION OF GLYOXAL DURING ICARTT 2004. Atmos. Chem. Phys.<br />
Discuss., 6, 9459–9481.<br />
Toenges-Schuller, N., Stein, O., Rohrer, F., Wahner, A., Richter, A., Burrows, J. P., Beirle, S.,<br />
Wagner, T., Platt, U., & Elvidge, C. D. 2006. GLOBAL DISTRIBUTION PATTERN OF AN-<br />
THROPOGENIC NITROGEN OXIDE EMISSIONS: CORRELATION ANALYSIS OF SATEL-<br />
LITE MEASUREMENTS AND MODEL CALCULATIONS. J. Geophys. Res., 111, D05312,<br />
doi:10.1029/2005JD006068.<br />
Wagner, T., Beirle, S., Deutschmann, T., Frankenberg, C., Grzegorski, M., Hollwedel, J., Khokhar,<br />
M. F., Kühl, S., Marbach, T., Platt, U., Pukite, J., Sanghavi, S., & Wilms-Grabe, W. 2006a. 10<br />
YEARS OF REMOTE SENSING WITH MODERN UV/VIS/NIR SATELLITE INSTRUMENTS:<br />
A NEW VIEW ON GLOBAL NEAR-SURFACE TRACE GAS DISTRIBUTIONS. presentation at<br />
the 36TH COSPAR SCIENTIFIC ASSEMBLY BEIJING, CHINA, 16 23 JULY 2006.<br />
Wagner, T., Beirle, S., Grzegorski, M., & Platt, U. 2006b. CHARACTERIZATION OF VEGETA-<br />
TION TYPE USING DOAS SATELLITE RETRIEVALS. poster presentation at the ESA Atmospheric<br />
Science Conference, 8-12 May 2006, ESA ESRIN, Frascati, Italy.<br />
Wagner, T., Burrows, J. P., Deutschmann, T., Dix, B., Hendrick, F., v.Friedeburg, C., Frie, U., Heue,<br />
K.-P., Irie, H., Iwabuchi, H., Kanaya, Y., Keller, J., McLinden, C. A., Oetjen, H., Palazzi, E.,<br />
Petritoli, A., Platt, U., Postylyakov, O., Pukite, J., Richter, A., van Roozendael, M., Rozanov,<br />
A., Rozanov, V., Sinreich, R., Sanghavi, S., & F., Wittrock. 2006c. COMPARISON OF BOX-<br />
AIR-MASS-FACTORS AND RADIANCES FOR MULTIPLE-AXIS DIFFERENTIAL OPTICAL
2.4. SATELLITE GROUP 71<br />
ABSORPTION SPECTROSCOPY (MAX-DOAS) GEOMETRIES CALCULATED FROM DIF-<br />
FERENT UV/VISIBLE RADIATIVE TRANSFER MODELS. J. Atmos. Chem. Phys. Discuss.,<br />
6, 9823–9876.<br />
Wagner, T., Ibrahim, O., Sinreich, R., Frie, U., & Platt. 2006d. ENHANCED TROPOSPHERIC BRO<br />
CONCENTRATIONS OVER THE ANTARCTIC SEA ICE BELT IN MID WINTER OBSERVED<br />
FROM MAX-DOAS OBSERVATIONS ON BOARD THE RESEARCH VESSEL POLARSTERN.<br />
Atmos. Phys. Chem., submitted.<br />
Wagner, T., Beirle, S., Grzegorski, M., & Platt. 2006e. GLOBAL TRENDS (1996 TO 2003)<br />
OF TOTAL COLUMN PRECIPITABLE WATER OBSERVED BY GOME ON ERS-2 AND<br />
THEIR RELATION TO SURFACE TEMPERATURE. J. Geophys. Res., 111, D12102,<br />
doi:10.1029/2005JD006523.<br />
Wagner, T., Beirle, S., Grzegorski, M., & Platt, U. 2006f. GLOBAL TRENDS OF CLOUD COVER<br />
AND CLOUD HEIGHT DERIVED FROM GOME SATELLITE OBSERVATIONS 1996-2003 AND<br />
THEIR RELATION TO SURFACE-NEAR TEMPERATURE. poster presentation at the 2006 Fall<br />
Meeting: 1115 December 2006, San Francisco, California.<br />
Wagner, T., Beirle, S., Grzegorski, M., & Platt, U. 2006g. INVESTIGATING THE EARTH’S HY-<br />
DROLOGICAL CYCLE USING H2O VCDS AND CLOUD RELATED PARAMETERS FROM<br />
GOME-II. Proceedings of the 1st EPS/MetOp RAO Workshop ESRIN, Frascati, Italy, 15-17 May<br />
2006.<br />
Wagner, T., Beirle, S., Deutschmann, T., Grzegorski, M., Sanghavi, S., & Platt, U. 2006h. PROBING<br />
INTERNAL CLOUD PROPERTIES FROM SPACE. presentation at the ESA Atmospheric Science<br />
Conference, 8-12 May 2006, ESA ESRIN, Frascati, Italy.<br />
Wagner, T., Beirle, S., Deutschmann, T., Grzegorski, M., Sanghavi, S., & Platt, U. 2006i. PROB-<br />
ING INTERNAL CLOUD PROPERTIES FROM SPACE. presentation at the 36TH COSPAR<br />
SCIENTIFIC ASSEMBLY BEIJING, CHINA, 16 23 JULY 2006.<br />
Wagner, T., Beirle, S., Deutschmann, T., Grzegorski, M., & Platt. 2006j. SATELLITE MONITOR-<br />
ING OF DIFFERENT VEGETATION TYPES BY DIFFERENTIAL OPTICAL ABSORPTION<br />
SPECTROSCOPY (DOAS) IN THE RED SPECTRAL RANGE. Atmos. Chem. Phys., accepted.<br />
Wang, P., Richter, A., Bruns, M., Burrows, J. P., Junkermann, W., Heue, K.-P., Wagner, T., Platt, U.,<br />
& Pundt, I. 2006. AIRBORNE MULTI-AXIS DOAS MEASUREMENTS OF TROPOSPHERIC<br />
SO2 PLUMES IN THE PO-VALLEY, ITALY. Atmos. Chem. Phys., 6, 329338.<br />
Wittrock, F., Richter, A., Oetjen, H., Burrows, J. P., Kanakidou, M., Myriokefalitakis, S., Volkamer,<br />
R., Beirle, S., Platt, U., & Wagner, T. 2006. Simultaneous global observations of glyoxal and<br />
formaldehyde from space. Geophys. Res. Lett., 33, doi:10.1029/2006GL026310.
2.5. MARHAL - MODELING OF MARINE AND HALOGEN CHEMISTRY 73<br />
2.5 MarHal - Modeling of marine and halogen chemistry<br />
MarHal is an independent Junior Research Group that is funded by the Deutsche Forschungsgemeinschaft<br />
within the Emmy-Noether program. The main research foci of our group are the investigation<br />
of photochemical and microphysical processes in the troposphere, especially in the marine boundary<br />
layer using numerical models.<br />
Group members<br />
Dr. Roland von Glasow, head of group<br />
Dr. Susanne Pechtl (b. Marquart), PostDoc, until 30.11.2006<br />
Matthias Piot, DEA in oceanography and meteorology, PhD student<br />
Dipl. Met. Linda Smoydzin, PhD student<br />
Thomas Kaschka, diploma student<br />
Scientific objectives<br />
Figure 2.38: Overview of the research topics of MarHal.<br />
Our main research topics are tropospheric photochemistry and chemistry-cloud-climate interactions.<br />
Specifically, we are studying the impact of halogen chemistry on ozone photochemical destruction<br />
(e.g. by catalytic reaction cycles of halogen oxides) and production (i.e. by changing the<br />
OH/HO2 and NO/NO2 ratios) in the polar boundary layer, the remote and coastal marine boundary<br />
layer (MBL), over salt lakes, and in the free troposphere. Our interest in chemistry-cloud-climate<br />
interactions focuses on new particle formation in the MBL involving iodine oxides and the sulfur cycle<br />
in the MBL and the relevance of halogen gas and aqueous phase reactions with dimethyl sulfide and<br />
its reaction products and the impact of sea salt aerosol particles on the sulfur cycle.<br />
Background<br />
Seventy percent of the Earth’s surface is covered by oceans. Particles and gases are released from<br />
the ocean and have an influence on atmospheric chemistry and climate via changes of the oxidation<br />
power of the atmosphere. Furthermore, feedbacks between chemistry and, for example, cloud microphysical<br />
properties occur, that change the albedo and therefore alter the energy budget of the Earth<br />
(e.g. sulfate and sea salt aerosol particles and their role as cloud condensation nuclei). Measurements
74 CHAPTER 2. ATMOSPHERE AND REMOTE SENSING<br />
in the marine troposphere and in seawater have shown that exchanges of climatically relevant gases<br />
like dimethyl sulfide (DMS) and non-methane hydrocarbons occur which can have a significant impact<br />
on regional and even global photochemistry and climate. Furthermore, sea salt aerosol particles<br />
are produced that contain chlorine and bromine. Numerous aerosol samples have shown that marine<br />
aerosol is depleted in bromine compared to sea water. Once released to the gas phase bromine participates<br />
in ozone destruction cycles and also oxidizes dimethyl sulfide (DMS). Iodine is being released via<br />
biological processes in dramatic amounts from several coastal regions but also from the open ocean.<br />
Iodine is very efficient in destroying ozone and if concentrations of iodine oxides are high enough, new<br />
particle formation can occur.<br />
The role of halogens in tropospheric chemistry is not restricted to the marine environment. Very<br />
high mixing ratios of the radical bromine oxide have been measured during strong surface Ozone<br />
Depletion Events in polar regions in springtime and over salt lakes. In the Arctic BrO has also been<br />
implicated in so-called Mercury Depletion Events with an increase in the deposition of bio-available,<br />
toxic mercury. Various measurements indicate that there is a significant background of the bromine<br />
oxide radical in the troposphere, most likely in the free troposphere, which would significantly impact<br />
the background photochemistry in this sensitive environment [see von Glasow et al. , 2004]. An<br />
overview of tropospheric halogen chemistry can be found in von Glasow & Crutzen [2006].<br />
Although the mentioned “halogen domains” appear to be very different they have striking similarities<br />
when halogen release and cycling are considered. This makes it feasible to address the associated<br />
research questions in one research group to benefit from synergies. Figure 2.38 shows schematically<br />
our research topics, making the interconnections more obvious.<br />
Main methods<br />
Our research tools are numerical models. The main model is the one-dimensional model of the<br />
marine boundary layer MISTRA [von Glasow et al. , 2002a,b; von Glasow & Crutzen, 2004] that treats<br />
chemical processes in the gas phase, in and on aerosol particles, and cloud droplets. The microphysical<br />
module includes the growth of particles due to water vapor and uptake of other gases and a two-way<br />
feedback with radiation. Aqueous phase chemistry is calculated in sulfate and sea salt aerosol and -<br />
if a cloud is present - in cloud droplets that grew on each type of aerosol. The chemical mechanism<br />
comprises about 170 reactions in the gas phase and 270 reactions in and on aqueous particles for<br />
each of the four chemical bins. For some applications the model is run in box model mode where the<br />
relevant meteorological parameters (temperature, relative humidity, particle radius and liquid water<br />
content) are adjusted to the problem under investigation.<br />
We are developing an improved microphysical/microchemical module that will allow us to make<br />
more detailed studies of the microphysical (mainly growth) and chemical interactions of a particle<br />
population.<br />
Furthermore we have been using the global three-dimensional model MATCH-MPIC [von Glasow<br />
et al. , 2004; Schofield et al. , 2006] for a first global assessment of tropospheric halogen chemistry.<br />
Main recent activities<br />
All group members actively take part in model development and application. Below we briefly<br />
outline the single projects which are explained in more detail in the following sections.<br />
Polar halogen chemistry is being investigated by Matthias Piot (see 2.5.2) focusing on the effects<br />
of various chemical and meteorological parameters for the development of ozone depletion events. The<br />
effects of organic surfactants on sea salt aerosol on particle growth and chemical processes like uptake<br />
or scavenging of gas phase compounds is the subject of Linda Smoydzin’s work (see 2.5.3). Susanne<br />
Pechtl (b. Marquart) has developed and applied a parameterization for the nucleation of new aerosol<br />
particle from iodine vapors [Pechtl et al. , 2006b] and key modules for our improved microphysical<br />
module. Another focus was the continuation of her work on iodine chemistry, esp. aqueous phase<br />
reactions (see 2.5.1). Effects of surface reactions on sea salt aerosol had been proposed in the literature<br />
to be of potentially great importance for the marine sulfur cycle, our model results showed, however,<br />
that the effects had been overestimated and are unlikely to be of importance (see 2.5.4). We continued<br />
our investigation of chemical processes in volcanic plumes in collaboration with Italian colleagues. One<br />
focus was sulfur chemistry in volcanic plumes [Aiuppa et al. , 2006]. Furthermore, Thomas Kaschka<br />
is developing an explicit model of the very-early plume chemical processes. We also contributed to<br />
the Scientific Assessment of Stratospheric Ozone by the World Meteorological Organization [WMO,<br />
2006].
2.5. MARHAL - MODELING OF MARINE AND HALOGEN CHEMISTRY 75<br />
Funding<br />
Deutsche Forschungsgemeinschaft, Emmy-Noether Junior Research Group MarHal GL 353/1-2<br />
Cooperation within the institute and with groups outside of the institute<br />
Tropospheric research group, IUP Heidelberg<br />
Alfred-Wegener-<strong>Institut</strong>, Bremerhaven<br />
Cape Grim Baseline Air Pollution Station, Tasmania, Australia<br />
Dipartimento CFTA, Università di Palermo, Italy<br />
INGV - Sezione di Palermo, Palermo, Italy<br />
Max-Planck-<strong>Institut</strong> <strong>für</strong> Chemie, Mainz (MPI-C)<br />
National <strong>Institut</strong>e of Water and Atmospheric Research (NIWA), New Zealand<br />
National Oceanic and Atmospheric Administration, NOAA, Boulder, USA<br />
Scripps Inst. of Ocanography, University of California, San Diego (SIO), USA<br />
<strong>Universität</strong> Bremen<br />
Universitée Libre de Bruxelles, Belgium<br />
University of California, Los Angeles (UCLA), USA<br />
University of New Hampshire, USA<br />
University of Virginia, USA<br />
Peer Reviewed Publications<br />
1. Bobrowski et al. [2006]<br />
2. Keene et al. [2006]<br />
3. Meyer et al. [2006]<br />
4. Pechtl et al. [2006b]<br />
5. Ponater et al. [2006]<br />
6. Schofield et al. [2006]<br />
7. von Glasow [2006b]<br />
8. von Glasow & Crutzen [2006]<br />
9. WMO [2006]<br />
Papers in online review<br />
1. Aiuppa et al. [2006]<br />
2. Pechtl et al. [2006a]<br />
3. Smoydzin & von Glasow [2006]<br />
Invited talk<br />
1. von Glasow [2006a]
76 CHAPTER 2. ATMOSPHERE AND REMOTE SENSING<br />
2.5.1 Modeling iodide – iodate speciation in atmospheric aerosol<br />
Susanne Pechtl, Guy Schmitz (Faculté des Sciences Appliquées, Universitée Libre de Bruxelles,<br />
Belgium), Roland von Glasow<br />
Abstract The speciation of iodine in atmospheric aerosol is currently poorly understood. Models<br />
predict negligible iodide concentrations, but accumulation of iodate in aerosol, both of which is not<br />
confirmed by recent measurements. An updated aqueous phase iodine chemistry scheme for use in<br />
atmospheric models was developed, which improves the agreement with measurements significantly.<br />
HIO 3<br />
IO<br />
ICl 2 -<br />
IClBr -<br />
ICl<br />
HOCl<br />
HOBr<br />
HOI<br />
Cl -<br />
H + Br -<br />
H +<br />
IBr 2 -<br />
HI<br />
HIO 2<br />
IBr<br />
I -<br />
H +<br />
H2O2 HOCl HOBr<br />
H +<br />
HIO2 H +<br />
HSO 3 -<br />
DOM?<br />
HOCl<br />
SO 3 -<br />
I 2<br />
HOBr<br />
H +<br />
O 3<br />
H<br />
HOI<br />
+ IBr<br />
ICl<br />
H +<br />
IO 3 -<br />
HSO 3 -<br />
I -<br />
aerosol<br />
gas phase<br />
Figure 2.39: Scheme of aqueous phase iodine chemistry as implemented in the marine boundary layer<br />
model MISTRA. Additional reactions compared to earlier schemes are highlighted in red.<br />
Background Although during recent years<br />
progress has been made regarding atmospheric<br />
iodine chemistry, several aspects are still poorly<br />
understood, one of which is the speciation of iodine<br />
in atmospheric aerosol. Current models of<br />
atmospheric chemistry predict that the aerosol iodide<br />
(I− ) concentration is negligible, while iodate<br />
(IO − 3<br />
) is believed to be inert and thus accumulate<br />
in particles. In contrast, observational data provide<br />
evidence for a non-negligible iodide content in<br />
aerosol samples. During two extended ship cruises<br />
in the Atlantic Ocean, highly variable I − /IO − 3 ratios<br />
were found.<br />
Methods and results An updated aqueous<br />
phase iodine chemistry scheme (Figure 2.39) was<br />
developed for the marine boundary layer model<br />
MISTRA, which includes chemistry in the gas<br />
and aerosol phase as well as aerosol microphysics.<br />
Model sensitivity studies show that iodate can be<br />
reduced in acidic aerosol by inorganic reactions,<br />
i.e., iodate does not necessarily accumulate in particles.<br />
Furthermore, the transformation of particulate<br />
iodide to volatile iodine species likely has<br />
been overestimated in previous model studies due<br />
to negligence of collision-induced upper limits for<br />
the reaction rates. However, inorganic reaction<br />
cycles still do not seem to be sufficient to reproduce<br />
the observed range of iodide-iodate speciation.<br />
Therefore, the effects of the recently suggested<br />
reaction of HOI with dissolved organic matter<br />
(DOM) to produce I − was also investigated. If<br />
this reaction is fast enough to compete with the<br />
inorganic mechanism, it would not only directly<br />
lead to enhanced iodide concentrations but, indirectly<br />
via speed-up of iodate reduction cycles,<br />
also to a decrease in iodate. Hence, organic iodine<br />
chemistry combined with inorganic reaction<br />
cycles seems to be able to reproduce observations.<br />
The presented chemistry is highly dependent on<br />
pH and thus offers an explanation for the large<br />
observed variability of the iodide-iodate speciation<br />
in atmospheric aerosol.<br />
Outlook/Future work The existence of organic<br />
forms of iodine has to be re-confirmed in<br />
further measurements and its consequences for iodine<br />
speciation has to be investigated.<br />
Funding DFG: Emmy Noether Junior Research<br />
Group MarHal GL 353/1-2<br />
Main publication Pechtl et al. [2006a]
2.5. MARHAL - MODELING OF MARINE AND HALOGEN CHEMISTRY 77<br />
2.5.2 The Potential Importance of Frost Flowers for Ozone Depletion Events<br />
- A Model Study<br />
Matthias Piot, Roland von Glasow<br />
Abstract For more than 20 years, events with almost complete loss of ozone have been observed<br />
in the Arctic in spring. We performed model studies with the one-dimensional model MISTRA to<br />
investigate the potential role of frost flowers (FF) in this depletion of tropospheric ozone.<br />
Figure 2.40: Left: Schematic depiction of the most important processes included in the Arctic version<br />
of MISTRA. The boundary layer is denoted as BL, open lead as OL, and the free troposphere as FT.<br />
Aerosol and gas phase chemistry are calculated in all layers. (1): Deposition process; (2): Br2/BrCl<br />
re-emission from the snowpack. Right: typical gas phase O3 during an ODE in the BL.<br />
Background Reactive halogens play a major<br />
role in polar ozone depletion events (ODE): the<br />
reaction of bromine atoms with ozone, followed<br />
by the self-reaction of bromine oxides (BrO) represents<br />
a catalytic loss mechanism for ozone in the<br />
polar boundary layer (PBL). However, the triggering<br />
of the so-called ”bromine explosion” remains<br />
unclear. We present a sensitivity study where meteorological<br />
as well as chemical parameters are<br />
assessed. This study helps us better understand<br />
the conditions favorable for the development of an<br />
Ozone Depletion Event (ODE).<br />
Methods and results We used MISTRA in<br />
a “Lagrangian mode” where a model column of<br />
2000 m height moves across a pre-defined sequence<br />
of surfaces: snow, FF, and open lead (see<br />
Fig. 2.40-left), with FF aerosols being produced<br />
during the FF section. We show that a major<br />
ozone depletion event can be satisfactorily reproduced<br />
if the recycling on snow of deposited halogens<br />
into gas phase Br2/BrCl is considered (see<br />
ozone mixing ratio in Fig. 2.40-right). This cycling<br />
maintains sufficiently high levels of bromine<br />
to deplete ozone down to few nmol mol −1 within<br />
four days. We also assessed the influence of different<br />
combinations of open lead/frost flowers on the<br />
chemistry of the moving column. Results showed<br />
noticeable modifications affecting the composition<br />
of aerosols and the deposition velocities due to<br />
variation of the humidity in the air. In addition,<br />
we studied the effects of modified temperature of<br />
either the frost flower field or the ambient airmass.<br />
A warmer FF field increases the relative<br />
humidity and the aerosol deposition rate. The<br />
deposition/re-emission process is larger, inducing<br />
more reactive bromine in the gas phase, and a<br />
stronger ozone depletion. A decrease of 1 K in<br />
airmass temperature shows that the aerosol uptake<br />
capacity substantially increases, leading to<br />
enhanced uptake of acids from the gas phase: the<br />
bromine explosion accelerates and O3 mixing ratios<br />
decreases. Recent studies have suggested the<br />
important role of the precipitation of calcium carbonate<br />
(CaCO3) out of the brine layer for the<br />
possible acidification of the liquid phase by acid<br />
uptake. Our investigation showed that this precipitation<br />
is a crucial process for the timing of<br />
the bromine explosion in aerosols. Finally, we investigated<br />
the release of Br2 potentially produced<br />
by heterogeneous reactions directly on frost flowers.<br />
In this case, we obtained unlikely results for<br />
aerosol compositions and deposition rates on snow<br />
compared to observations made in the Arctic.<br />
Funding DFG-Emmy Noether Junior Research<br />
group Marhal GL 353/1-2.
78 CHAPTER 2. ATMOSPHERE AND REMOTE SENSING<br />
2.5.3 Modeling organic surface films on Atmospheric Aerosol Particles and<br />
their Influence on Chemistry<br />
Linda Smoydzin, Roland von Glasow<br />
Abstract Organic material from the ocean’s surface can be incorporated into sea salt aerosol particles<br />
often producing a surface film on the aerosol. Such an organic coating can reduce the mass<br />
transfer between the gas phase and the aerosol phase influencing sea salt chemistry in the marine<br />
atmosphere.<br />
Figure 2.41: Time evolution of total bromine and chlorine gas phase mixing ratios and HOBr and<br />
HOCl aqueous phase concentrations at 50 m altitude for three days (midnight day 1 - midnight day 3).<br />
The different lines refer to different cases where the fractions of the organic constituents which react<br />
with ozone and OH are varied. The accommodation coefficient is reduced by one order of magnitude<br />
for all cases. Red: 50% OA, 50% ORG, green: 47% OA 52% ORG, blue: 45% OA, 55% ORG, black:<br />
base case without organic coatings.<br />
Background Recent field measurements have<br />
shown that the organic mass fraction in marine<br />
particles can be up to 60% especially in regions<br />
with high biological activity. However, it is not<br />
possible to determine which organic species are<br />
present on sea salt aerosols.<br />
Methods and results To investigate the importance<br />
of surfactants for atmospheric chemistry<br />
in the marine boundary layer (MBL) the onedimensional<br />
numerical model MISTRA is used.<br />
Uncertainties regarding the magnitude of uptake<br />
reduction, the concentrations of organic compounds<br />
in sea salt aerosols and the oxidation rate<br />
of the organics are considered to analyse the possible<br />
influence of organic surfactants on gas and<br />
liquid phase chemistry.<br />
Organic surface films can be destroyed by reaction<br />
with atmospheric oxidants like ozone or OH.<br />
As long as a complete coating on the sea salt particle<br />
is present the accommodation coefficient is<br />
reduced. By assuming destruction rates for the organic<br />
coating (which comprises of oleic acid (OA))<br />
based on laboratory measurements we saw a rapid<br />
destruction of the organic coatings within the first<br />
meters of the MBL. Larger organic initial concentrations<br />
lead to a longer lifetime of the coating<br />
but lead also to an unrealistically strong decrease<br />
of ozone concentrations as the organic film<br />
is destroyed by reaction with ozone. The lifetime<br />
of the film can be increased by either assuming<br />
smaller reactive uptake coefficients for ozone on<br />
oleic acid or by assuming that a part of the organic<br />
surfactants (ORG) react with OH. By variing<br />
the oleic acid/ORG fraction sensitivity studies<br />
were perfomed. It can be shown that gas phase<br />
halogen concentrations decrease. Chlorine concentrations<br />
decrease stronger than Bromine concentrations<br />
(∆Cl(tot):10-20%, ∆Br(tot):9%). For<br />
the aqueous phase we see an increase in bromine<br />
(∆HOBr:30%) and a decrease in chlorine concentrations<br />
(∆HOCl:40-50%). Overall aqueous phase<br />
chemistry is affected stronger than gas phase<br />
chemistry.<br />
Funding DFG-Emmy Noether Junior Research<br />
group Marhal GL 353/1-2<br />
Main publication Smoydzin & von Glasow<br />
[2006]
2.5. MARHAL - MODELING OF MARINE AND HALOGEN CHEMISTRY 79<br />
2.5.4 Importance of the surface reaction OH + Cl − on sea salt aerosol for<br />
the chemistry of the marine boundary layer - a model study<br />
Roland von Glasow<br />
Abstract The implications for the chemistry of the marine boundary layer (MBL) of the reaction<br />
of OH with Cl − on the surface of sea salt aerosol producing gas phase Cl2 and particulate OH − have<br />
been investigated with a numerical model. They were found to be very minor in contradiction to<br />
previous suggestions in the literature.<br />
Figure 2.42: Temporal evolution of the most important gas phase compounds for scenario “remote<br />
MBL”. The difference between the “cases” is how the reaction rate of the surface reaction is calculated<br />
as explained in paranthesis. Case 1 (no surface reaction) - black, solid line; case 2 (“best guess”) -<br />
red, dashed line; case 3 (no gas phase diffusion limitation) - blue, dotted line; case 4 (γ = 1, with<br />
gas phase diffusion limitation) - blue, solid line; case 5 (γ = 1, no gas phase diffusion limitation) -<br />
green, dash-dotted line. Note, that most lines except for Cl2 and Cl overlap. The abscissa is time<br />
since model start in minutes.<br />
Background The reaction OH + Cl − −→<br />
OH − + Cl2 had been suggested by Laskin et<br />
al. (2003) to play a major role in the sulfur<br />
cycle in the marine boundary layer. The aqueous<br />
phase oxidation of SO2 is strongly pH dependent,<br />
and relevant mainly in fresh, non-acidified<br />
sea salt aerosol particles. This pathway for sulfur<br />
oxidation would gain in importance if alkalinity<br />
would be produced in the particles as is the case<br />
in the aforementioned reaction. Furthermore, it<br />
was suggested that the gas phase product, Cl2,<br />
might be relevant for the photochemistry of the<br />
MBL.<br />
Methods and results Based on literature data<br />
a new “best estimate” for the rate coefficient of the<br />
surface reaction was deduced and applied in the<br />
box-model vesrion of MISTRA. Its importance for<br />
the chemistry of the MBL has been investigated<br />
under conditions typical for the pristine MBL of<br />
the Southern Ocean, the remote MBL, and marine<br />
regions influenced by polluted outflow from<br />
the continent.<br />
The results showed that the additional sulfate<br />
production by this reaction is less than 1%, therefore<br />
having only a minor impact on sulfate production.<br />
Even though the gas phase concentration<br />
of Cl2 increased strongly in the model (see Figure),<br />
the concentration of Cl radicals increased by<br />
less than 5% for the “best estimate” case and the<br />
impact on O3 and other compounds is negligible.<br />
Therefore it was concluded that - at least under<br />
the investigated conditions - this reactions is of<br />
minor importance for the chemistry of the MBL<br />
and the marine sulfur cycle.<br />
A very interesting feature of the acidification<br />
of large sea salt particles that was predicted with<br />
the model is a two-stage acidification of large fresh<br />
sea salt aerosol. This effect is caused by the rapid<br />
change in particle pH due to uptake of acids and<br />
production of acidity during the production of sulfate<br />
and the related change in pH-dependent reactions<br />
rates.<br />
Funding DFG: Emmy Noether Junior Research<br />
Group MarHal GL 353/1-2<br />
Main publication von Glasow [2006b]
80 CHAPTER 2. ATMOSPHERE AND REMOTE SENSING<br />
References<br />
Aiuppa, A., Franco, A., von Glasow, R., Allen, A. G., D’Alessandro, W., Mather, T. A., Pyle, D. M.,<br />
& Valenza, M. 2006. The tropospheric processing of acidic gases and hydrogen sulphide in volcanic<br />
gas plumes as inferred from field and model investigations. Atmos. Chem. Phys. Discuss., 6, 11653<br />
– 11680.<br />
Bobrowski, N., von Glasow, R., Aiuppa, A., Inguaggiato, S., Louban, I., Ibrahim, O. W., & Platt, U.<br />
2006. Halogen Chemistry in Volcanic Plumes. J. Geophys. Res., in press.<br />
Keene, W. C., Stutz, J., Pszenny, A. A. P., Maben, J. R., Fisher, E., Smith, A. M., von Glasow,<br />
R., Pechtl, S., Sive, B. C., & Varner, R. K. 2006. Inorganic chlorine and bromine in coastal New<br />
England air during summer. J. Geophys. Res., accepted.<br />
Meyer, R., Büll, R., Leiter, C., Mannstein, H., Pechtl, S., Oki, T., & Wendling, P. 2006. Contrail<br />
observations over Southern and Eastern Asia in NOAA/AVHRR data and intercomparison to contrail<br />
simulations in a GCM. Int. J. Remote Sensing, in press, Also available as Report No. 176,<br />
<strong>Institut</strong> <strong>für</strong> Physik der Atmosphäre, DLR Oberpfaffenhofen.<br />
Pechtl, S., Schmitz, G., & von Glasow, R. 2006a. Modeling iodide iodate speciation in atmospheric<br />
aerosol. Atmos. Chem. Phys. Discuss., 6, 10959 – 10989.<br />
Pechtl, S., Lovejoy, E. R., Burkholder, J. B., & von Glasow, R. 2006b. Modeling the possible role of<br />
iodine oxides in atmospheric new particle formation. Atmos. Chem. Phys., 6, 503 – 523.<br />
Ponater, M., Pechtl, S., Sausen, R., Schumann, U., & Hüttig, G. 2006. A state-of-the-art assessment<br />
of the potential of the cryoplane technology to reduce aircraft climate impact. Atmos. Environment,<br />
40, 6928 – 6944.<br />
Schofield, R., Johnston, P. V., Thomas, A., Kreher, K., Connor, B. J., Wood, S., Shooter, D., Chipperfield,<br />
M. P., Richter, A., von Glasow, R., & Rodgers, C. D. 2006. Tropospheric and stratospheric<br />
BrO columns over Arrival Heights, Antarctica during the spring polar vortex split, 2002. J. Geophys.<br />
Res., 111, D22310, doi:10.1029/2005JD007022.<br />
Smoydzin, L., & von Glasow, R. 2006. Do organic surface films on sea salt aerosols influence atmospheric<br />
chemistry? A model study. Atmos. Chem. Phys. Discuss., 6, 10373 – 10402.<br />
von Glasow, R. 2006a. Halogens in the marine boundary layer. Invited talk, UK SOLAS meeting,<br />
Manchester, 17. - 18. July 2006.<br />
von Glasow, R. 2006b. Importance of the surface reaction OH + Cl − on sea salt aerosol for the<br />
chemistry of the marine boundary layer - a model study. Atmos. Chem. Phys., 6, 3571 – 3581.<br />
von Glasow, R., & Crutzen, P. J. 2004. Model study of multiphase DMS oxidation with a focus on<br />
halogens. Atmos. Chem. Phys., 4, 589 – 608.<br />
von Glasow, R., & Crutzen, P. J. 2006. Tropospheric halogen chemistry. In: The Atmosphere (ed. R.<br />
F. Keeling), Vol. 4 Treatise on Geochemistry (eds. H. D. Holland and K. K. Turekian), in press.<br />
Elsevier-Pergamon, Oxford.<br />
von Glasow, R., Sander, R., Bott, A., & Crutzen, P. J. 2002a. Modeling halogen chemistry in the marine<br />
boundary layer. 1. Cloud-free MBL. J. Geophys. Res., 107, 4341, doi: 10.1029/2001JD000942.<br />
von Glasow, R., Sander, R., Bott, A., & Crutzen, P. J. 2002b. Modeling halogen chemistry in the<br />
marine boundary layer. 2. Interactions with sulfur and cloud-covered MBL. J. Geophys. Res., 107,<br />
4323, doi: 10.1029/2001JD000943.<br />
von Glasow, R., von Kuhlmann, R., Lawrence, M. G., Platt, U., & Crutzen, P. J. 2004. Impact of<br />
reactive bromine chemistry in the troposphere. Atmos. Chem. Phys., 4, 2481 – 2497.<br />
WMO (ed). 2006. Scientific Assessment of Ozone Depletion: 2006. World Meteorological Organization<br />
Global Ozone Research and Monitoring Project: Geneva.
2.6. CARBON CYCLE GROUP 81<br />
2.6 Carbon Cycle Group<br />
Ingeborg Levin<br />
Group members<br />
Samuel Hammer (PhD), Renate Heinz (Techn.), Ingeborg Levin (GL), Tobias Naegler (Post Doc),<br />
Michael Sabasch (Techn.), Sebastian Schmitt (Dipl.), Cordelia Veidt (PhD), Felix Vogel (PhD, since<br />
Nov. 2005)<br />
Abstract<br />
High precision greenhouse gases observations (CO2, CH4, N2O, H2O), together with their isotope<br />
ratios as well as related tracer (CO, H2, SF6, 222 Radon) measurements are performed on the global,<br />
continental and regional scale. These measurements are used in combination with regional and trajectory<br />
models to study respective source and sink processes and with global box models to investigate<br />
their global budgets.<br />
H 2 [ppb]<br />
550<br />
500<br />
450<br />
400<br />
Neumayer<br />
Alert<br />
01.01.2004 01.01.2005 01.01.2006 01.01.2007<br />
Date<br />
Figure 2.43: Measurements of atmospheric molecular Hydrogen on flask samples collected in high<br />
northern (Alert, Canadian Arctic) and high southern latitudes (Neumayer Station, Antarctica). Mixing<br />
ratios are generally higher in the southern hemisphere than in the north because one of the major<br />
sinks of atmospheric molecular hydrogen is uptake by soils (see Hammer and Levin, Section 2.6.1 and<br />
Schmitt and Hammer, Section 2.6.4 in this issue).<br />
Overarching topic<br />
Investigation of the regional and global biogeochemical cycles of CO2, CH4, H2 and N2O.<br />
Background<br />
Increasing greenhouse gases in the atmosphere are a major player in Earth climate change; quantitatively<br />
understanding the causes of this increase is an indispensable pre-requisite for future climate<br />
prognoses. The most reliable information on the bio-geochemical cycles of greenhouse gases come from<br />
long term atmospheric observations combined with modelling. The Heidelberg Carbon Cycle Group
82 CHAPTER 2. ATMOSPHERE AND REMOTE SENSING<br />
is significantly contributing to this international effort by providing unique (isotopic) measurements<br />
as well as validation tracer techniques and budget modelling.<br />
Main methods<br />
The Group is running a high-precision gas chromatography (GC) laboratory and is responsible<br />
for the stable isotope ratio mass spectrometry (IRMS) laboratory of the <strong>Institut</strong>e. A unique global<br />
network for quasi-continuous 14 CO2 observations is maintained in collaboration with the Radiocarbon<br />
Laboratory (Levin & Hesshaimer [2000], Levin & Kromer [2004], see also Kromer, Section ?? in this<br />
issue). Atmospheric transport tracers such as 222 Radon [Levin et al. , 2002] and SF6, analysed in<br />
collaboration with the Limnology group (Ilmberger, Section 4.2 in this issue) are measured at global<br />
and European sites for transport model validation and source estimates with the Radon-Tracer-Method<br />
[Levin et al. , 1999]. A global box model for CO2 and its isotopes was developed in the last years<br />
[Naegler, 2005] which is currently adapted for methane and its isotope ratios (Veidt et al., Section<br />
2.6.5 in this issue).<br />
Major activities of the year<br />
Important work of the last year concerns the investigation of combined 14 CO2 and CO observations<br />
to determine the regional fossil fuel CO2 (∆FFCO2) component over Europe. Gamnitzer et al. [2006]<br />
and Levin & Karstens [2006b] could show that the uncertainty to derive fossil fuel CO2 mixing ratios<br />
from bottom-up emissions inventories and atmospheric modelling is intolerably large with systematic<br />
biases introducing huge uncertainties (up to a factor of 2-3) in budgeting European carbon sources<br />
and sinks. Further correction/normalisation of the model results with measured CO mixing ratios can<br />
improve the FFCO2 estimates if the CO/FFCO2 ratio of underlying emissions is reliable [Gamnitzer<br />
et al. , 2006]. However, as this is generally not guaranteed, Levin & Karstens [2006a] investigated an<br />
improved method based on weekly integrated measured 14 C-based ∆FFCO2 and hourly CO observations.<br />
The uncertainty of this method was determined with regional model simulations of FFCO2 and<br />
CO and turned out to vary within 15-40% over Europe, depending on the absolute FFCO2 level at a<br />
particular site (see Levin and Karstens, Section 2.6.2 in this issue). It was validated at the Heidelberg<br />
site and will now be adopted at other European CO2 monitoring stations.<br />
A new research project on molecular Hydrogen funded by the EU - EuroHydros - which aims<br />
at investigating the atmospheric Hydrogen budget, i.e. its sources and sinks over Europe as well<br />
as globally, started in August 2006. In this project the IUP Carbon Cycle Group is responsible for<br />
continuous H2 observations in Heidelberg to investigate anthropogenic emissions from fossil fuels (e.g.<br />
car exhaust) as well as the regional soil sink (see Hammer and Levin, Section 2.6.1 in this issue).<br />
On the global and continental European scale, we analyse flask samples from Alert and Neumayer<br />
(see Figure 2.43) as well as from the Schauinsland station in the Black Forest. In addition, chamber<br />
measurements started on the experimental field at Grenzhof in collaboration with the Soil Phyiscs<br />
Group (see Roth, Section 3.1, this issue) to investigate the H2 soil uptake including the soil and<br />
meteorological parameters influencing this sink (see Schmitt and Hammer, Section 2.6.4 this issue).<br />
Our investigations of the global carbon cycle using the world-wide measurements of 14 CO2 will be<br />
continued thanks to extended funding by the DFG (see Naegler and Levin, Section 2.6.3 in this issue).<br />
How are single projects linked:<br />
Projects are linked by common measurement techniques and monitoring stations (i.e. Heidelberg,<br />
Schauinsland, Neumayer, Alert etc.). Data evaluation and interpretation on different scales is naturally<br />
linked through common source and sink distributions of the different greenhouse gases, such as<br />
biospheric, anthropogenic, and chemical oxidation. Common modelling techniques and using tracers<br />
such as 222 Radon or trajectories are applied in the different projects.<br />
Funding<br />
The scientific work of the group is mainly funded by research grants from the EU (CarboEurope-IP,<br />
EuroHydros) and DFG (Atmospheric Radiocarbon).<br />
Cooperations within the institute
2.6. CARBON CYCLE GROUP 83<br />
• Radiokohlenstoff-Labor (Dr. B. Kromer)<br />
• Bodenphysik (Prof. Kurt Roth, Dr. U. Wollschläger)<br />
• Aquatische Systeme (Prof. W. Aeschbach-Hertig, Dr. J. Ilmberger)<br />
External Collaborations:<br />
• MPI <strong>für</strong> Biogeochemie, Jena (Prof. Martin Heimann, Dr. Armin Jordan, Dr. Ute Karstens,<br />
Olaf Kolle, Prof. Detlef Schulze, Dr. Axel Steinhof)<br />
• Umweltbundesamt (Dr. <strong>Ruprecht</strong> Schleyer, Frank Meinhardt)<br />
• Forschungszentrum Jülich (Dr. Andreas Volz-Thomas)<br />
• Alfred Wegener <strong>Institut</strong> Bremerhaven (Dr. Rolf Weller)<br />
• <strong>Universität</strong> Frankfurt, <strong>Institut</strong> <strong>für</strong> Meteorologie (Dr. Andreas Engel)<br />
• LSCE, Gif-sur-Yvette , France, (Prof. Philippe Ciais, Dr. Martina Schmidt)<br />
• Royal Holloway, University of London, Egham, UK (Prof. Euan Nisbet)<br />
• Meteorological Service of Canada, Toronto (Douglas Worthy)<br />
• Krakow University, Poland (Prof. Kazimierz Rozanski)<br />
• and many others.<br />
Future Work<br />
CarboEurope-IP and EuroHydros will be running for the next two years and related research<br />
will be continued, including global modelling of atmospheric molecular hydrogen with GRACE. The<br />
global network of atmospheric 14 CO2 observations will be continued as long as DFG funding permits<br />
including continued global 14 CO2 model investigations.<br />
Peer Reviewed Publications<br />
1. Engel et al. [2006]<br />
2. Naegler & Levin [2006]<br />
3. Naegler et al. [2006a]<br />
4. Naegler et al. [2006b]<br />
5. Rohs et al. [2006]<br />
6. Gamnitzer et al. [2006]<br />
7. Levin & Karstens [2006a]<br />
Other Publications<br />
1. Levin & Karstens [2006b]<br />
Diploma Theses<br />
none<br />
PhD Theses<br />
none
84 CHAPTER 2. ATMOSPHERE AND REMOTE SENSING<br />
2.6.1 Top-down assessments of the regional H2 soil sink strength from<br />
continuous atmospheric observations<br />
Samuel Hammer (participating scientist: Ingeborg Levin)<br />
Abstract Continuous measurements of H2 and 222 Rn in Heidelberg provide new insight into the<br />
regional H2 budget. The radon tracer method was applied to estimate the soil sink strength for<br />
atmospheric molecular Hydrogen.<br />
H 2 [ppb]<br />
H 2 [ppb] corrected<br />
570<br />
540<br />
510<br />
480<br />
540<br />
510<br />
480<br />
450<br />
a<br />
b<br />
420<br />
17.07.2006 19.07.2006 21.07.2006 23.07.2006 25.07.2006<br />
Figure 2.44: a: Summer situation with pronounced diurnal cycles of H2 and CO. b: The H2 mixing<br />
ratio is corrected here for direct anthropogenic emissions by the means of ”excess” CO and displayed<br />
together with 222 Rn. The shaded areas mark stable nocturnal inversions, used to estimate the H2 soil<br />
sink strength.<br />
Background The recent atmospheric H2 budget<br />
is not well established quantitatively. Important<br />
sources are combustion processes as well as<br />
oxidation of CH4 and Non Methane HydroCarbons<br />
in the atmosphere. The global atmospheric<br />
H2 budget is closed by two major sinks: the oxidation<br />
of H2 initiated by the reaction with OH<br />
radicals and the uptake by soils. The latter is believed<br />
to be the dominating part leading to a total<br />
atmospheric lifetime of H2 of about two years.<br />
The present uncertainties in the budget are large.<br />
Especially the soil sink strength differs up to a factor<br />
of two between the different budget estimates.<br />
Here we report on a method to derive the H2 soil<br />
sink directly from atmospheric measurements.<br />
Methods and results A combined GC system<br />
is used for quasi-continuous parallel measurements<br />
of CO2, CH4, CO, H2, N2O and SF6 mixing<br />
ratios. The determined H2 calibration is linked to<br />
the CSIRO scale to within 1-2%, with a precision<br />
of the H2 measurements of generally better<br />
than 1% [Hammer et al., in preparation]. 222 Rn<br />
is monitored on a half hourly basis, via its daughter<br />
activity with the static filter method [Levin<br />
et al. , 2002]. Panel a in Figure 2.44 shows summer<br />
situations with pronounced diurnal cycles of<br />
H2 and CO. Panal b provides the H2 mixing ratio<br />
corrected for direct anthropogenic emissions,<br />
which occur mainly during morning rush hours,<br />
by means of ”excess” CO assuming an H2/CO ra-<br />
300<br />
200<br />
100<br />
12<br />
9<br />
6<br />
3<br />
0<br />
222 Rn [Bq/m³]<br />
CO [ppb]<br />
tio of 0.4. During strong night-time inversions the<br />
H2 soil sink decreases boundary layer H2 while<br />
222 Rn emitted by the soil increases at the same<br />
time. Both tracers recover in the early morning<br />
hours due to enhanced vertical mixing. The radon<br />
tracer method (Levin et al. [1999] and Schmidt<br />
et al. [2001]) can be used to parameterise vertical<br />
mixing during these inversion situations and calculate<br />
the H2 soil sink strength (shaded areas in<br />
Figure 2.44b). For the period shown we estimate<br />
H2 soil sink strengths between 3·10 −5 [g/(m 2 · h)]<br />
and 9 · 10 −5 [g/(m 2 · h)], with a mean value of<br />
5 · 10 −5 [g/(m 2 · h)]. The error of this estimate is<br />
in the order of 35% and dominated by the uncertainty<br />
of the 222 Rn flux. Our results agree reasonably<br />
well with the reported H2 soil sink strength<br />
derived from chamber measurements (see Schmitt<br />
et al., Section 2.6.4 in this issue). The advantage<br />
of using direct atmospheric measurements to<br />
estimate the H2 soil sink, in contrast to closed<br />
chamber techniques is that a much larger catchment<br />
area and thus many different soil types in<br />
the measurement area are considered.<br />
Outlook/Future work It is now planned to<br />
investigate the H2 budget, including the H2 isotopes,<br />
by means of the atmospheric box model<br />
GRACE [Naegler, 2005].<br />
Funding This PhD work is funded by the EU<br />
projects EuroHydros and CarboEurope - IP.
2.6. CARBON CYCLE GROUP 85<br />
2.6.2 Inferring high-resolution fossil fuel CO2 records at continental sites<br />
from combined 14 CO2 and CO observations<br />
Ingeborg Levin (participating scientist: Ute Karstens, MPI Biogeochemistry, Jena)<br />
Abstract An uncertainty estimate of a purely observational approach to derive hourly regional fossil<br />
fuel CO2 offsets (∆FFCO2) from weekly integrated 14 CO2 and hourly CO observations at continental<br />
CO2 monitoring sites is presented. Results are based on a regional modelling study over Europe, and<br />
are validated with high-resolution campaign measurements in Heidelberg.<br />
Figure 2.45: Left: Monthly mean ∆FFCO2 as simulated by REMO for February 2002 for the lowest<br />
model level at 30m above ground. Right: RMS difference of CO-based ∆FFCO2 estimates (from<br />
REMO results according to Equation 2.4) and the original estimates displayed in the left panel.<br />
Background The CO2 budget over Europe and<br />
other highly populated regions in the world is<br />
largely influenced by anthropogenic emissions (see<br />
Figure 2.45). Separating the fossil fuel from the<br />
natural biogenic signal in the atmosphere is, therefore,<br />
a crucial task when CO2 exchange fluxes<br />
of the continental biosphere shall be determined<br />
from atmospheric observations and inverse modelling.<br />
Levin et al. [2003] showed that fossil<br />
fuel CO2 can be ”measured” in the atmosphere<br />
via 14 CO2 observations, however, not routinely at<br />
high temporal resolution. Therefore other fossil<br />
fuel tracers, in particular CO, were used for this<br />
purpose (e.g. Gamnitzer et al. [2006]). CO is,<br />
however, not a conservative tracer in the atmosphere<br />
and needs ongoing calibration if it shall be<br />
applied for quantitative estimates of the fossil fuel<br />
CO2 component.<br />
Methods and results We propose to estimate<br />
hourly ∆FFCO2 mixing ratios at a polluted site<br />
from weekly integrated 14 CO2 measurements and<br />
hourly CO observations according to<br />
(∆F F CO2) hourly = (2.3)<br />
∆CO meas<br />
14C−based<br />
(∆F F CO2) weekly<br />
hourly · �<br />
∆COmeas �<br />
hourly<br />
weekly<br />
The uncertainty of this method can be tested<br />
using REgional MOdel (REMO, Chevillard et al.<br />
[2002]) simulations of hourly time series of CO<br />
and fossil fuel CO2, based on emissions inventories<br />
of these trace gases. From these we can directly<br />
determine the Root Mean Square (RMS) deviation<br />
between a CO-based estimate of re-calculated<br />
hourly ∆FFCO2 (in analogy to Equation 2.3)<br />
(∆F F CO2) re−calculated<br />
hourly = (2.4)<br />
∆CO model<br />
�<br />
(∆F F CO2)<br />
hourly ·<br />
model<br />
�<br />
hourly<br />
weekly<br />
�<br />
∆COmodel �<br />
hourly<br />
weekly<br />
and the original model-estimated hourly<br />
∆FFCO2. These RMS deviations range from<br />
about 15% up to 40% for continental Europe, with<br />
larger errors in areas with little ∆FFCO2 (see<br />
Figure 2.45). These uncertainties are, however,<br />
still much smaller than any model- and emissions<br />
inventory-based approach and could be confirmed<br />
by high-resolution campaign data of 14 CO2 and<br />
CO in Heidelberg published by Gamnitzer et al.<br />
[2006].<br />
Outlook/Future work The proposed method<br />
will now be applied at other CarboEurope monitoring<br />
stations.<br />
Main publications: Levin & Karstens [2006a],<br />
Levin & Karstens [2006b]<br />
Funding EU-Project CarboEurope-IP
86 CHAPTER 2. ATMOSPHERE AND REMOTE SENSING<br />
2.6.3 Carbon cycle constraints derived from the interhemispheric ∆ 14 C<br />
difference<br />
Tobias Naegler (participating scientist: Ingeborg Levin)<br />
Abstract With the help of the two-dimensional global (radio-)carbon cycle model GRACE, we<br />
estimated the components driving the observed interhemispheric gradient in ∆ 14 C and its implications<br />
for carbon cycle dynamics on the hemispheric scale.<br />
Background The observed interhemispheric<br />
gradient in ∆ 14 CO2 is driven by the imbalance of<br />
14 C sources and sinks between both hemispheres.<br />
Consequently, the model-based analysis of the observations<br />
allows to constrain carbon cycle dynamics<br />
on the hemispherical scale.<br />
∆ 14 C N−S difference in %o<br />
6<br />
4<br />
2<br />
0<br />
−2<br />
−4<br />
−6<br />
−8<br />
Observed and simulated NS−gradient<br />
−10<br />
−12 observed N−S difference<br />
−14<br />
simulated N−S difference<br />
observed difference minus 7.5%o<br />
−16<br />
1980 1984 1988 1992 1996 2000 2004<br />
Figure 2.46: Observed and simulated interhemispheric<br />
∆ 14 C North-South difference.<br />
Methods and results With the help of the<br />
GRACE model [Naegler, 2005], we simulated an<br />
interhemispheric ∆ 14 C different between northern<br />
mid- and southern polar latitudes which is on average<br />
about 7.5� smaller than the observed difference<br />
between Jungfraujoch and Neumayer station<br />
(Fig. 2.46). However, both the model and the observations<br />
show a similar decreasing trend in the<br />
N-S difference of about 3� per decade.<br />
Components of tropospheric ∆ 14 C gradient<br />
1976 1980 1984 1988 1992 1996 2000 2004 −20<br />
high NH ∆<br />
10<br />
5<br />
0<br />
−5<br />
−10<br />
−15<br />
14 C ↔ low SH ∆ 14 C SH<br />
low NH ∆ 14 C ↔ high SH ∆ 14 strato<br />
bio<br />
ocean<br />
natural<br />
bomb<br />
industry<br />
fossil<br />
interh<br />
C<br />
Figure 2.47: Components driving the simulated<br />
interhemispheric ∆ 14 C N-S difference.<br />
In the model, the interhemispheric ∆ 14 C difference<br />
since the 1980s is mainly driven by three<br />
components (Figure 2.47): Predominant release<br />
of 14 C-free fossil fuel CO2 in the northern hemisphere<br />
is decreasing ∆ 14 C in the north. As an<br />
opposing effect, due to lower sea surface ∆ 14 C<br />
and higher wind speeds, the oceanic 14 C uptake<br />
in the southern hemisphere is stronger than the<br />
uptake in the north, causing a ∆ 14 C depletion in<br />
15<br />
%o⋅ yr −1<br />
the south relative to the north. Third, interhemispheric<br />
transport is partly levelling off any ∆ 14 C<br />
difference arising from an imbalance in (radio-<br />
)carbon sources and sinks between both hemispheres<br />
(Figure 2.47). Other possible components<br />
of an interhemispheric ∆ 14 C difference in<br />
the model are small compared to these three main<br />
drivers of the difference. The model results also<br />
illustrate that the decreasing trend in the interhemispheric<br />
difference is caused by the decreasing<br />
hemispherical imbalance of oceanic 14 C uptake,<br />
whereas the fossil fuel component of the interhemispheric<br />
gradient has remained rather constant.<br />
The (temporally rather constant) underestimation<br />
of the observed north-south ∆ 14 C difference<br />
in the model can in principle be caused by<br />
a constant underestimation of the contribution of<br />
any of the components driving the difference. As<br />
demonstrated by Naegler & Levin [2006], the integrated<br />
hemispheric oceanic 14 C uptake in the<br />
model is in good agreement with the observed excess<br />
14 C inventories in the ocean. Also, fossil fuel<br />
CO2 emissions are known with only little uncertainty<br />
and the interhemispheric exchange time in<br />
GRACE is rather well constrained by SF6 observations.<br />
Therefore we conclude that ocean 14 C<br />
exchange, fossil fuel fluxes as well as the interhemispheric<br />
air mass exchange in GRACE contribute<br />
only little to the data-model mismatch.<br />
Consequently, it is probably the simulated terrestrial<br />
biosphere which is to be held responsible<br />
for the underestimation of the ∆ 14 C difference.<br />
As the biosphere module in GRACE has<br />
no representation of the finite lifetime of carbon<br />
in living biomass and the parameters of the biosphere<br />
module (such as turnover times, pool sizes,<br />
and respiration) are subject to large uncertainties,<br />
it is quite plausible to assume that biosphereatmosphere<br />
(radio-)carbon exchange is not yet<br />
well represented in the model.<br />
Outlook/Future work As a consequence of<br />
these results, we will focus on the improvement<br />
of the biosphere module in GRACE and analyse<br />
the biospheric excess 14 C inventory constraints on<br />
biosphere dynamics.<br />
Main publications: Naegler & Levin [2006],<br />
Naegler et al. [2006a,b]<br />
Funding This work is funded by the DFG.
2.6. CARBON CYCLE GROUP 87<br />
2.6.4 Investigating the soil sink of molecular Hydrogen (H2)<br />
Sebastian Schmitt (participating scientist: Samuel Hammer)<br />
Abstract Aiming at a better understanding of the environmental cycle of different trace gases a<br />
setup is established to quantify the atmosphere-soil exchange of H2, CH4, N2O, CO2 and CO. With<br />
a main focus on the parmeters which determine the H2 soil sink the setup and additional devices for<br />
measuring soil moisture, temperature, 222 Rn efflux and soil gas profiles are applied and tested at the<br />
Grenzhof site near Heidelberg.<br />
Figure 2.48: The setup for measuring the H2 flux to the soil as it is installed at the Grenzhof near<br />
Heidelberg. The chamber is made of a clear material for disturbing biological activity at a minimum.<br />
The diagramm shows a strong dependence of the flux on soil moisture. Measured uptake rates range<br />
−6 g<br />
from (7.1 ± 0.7) · 10 h·m2 −5 g<br />
to (4.9 ± 0.5) · 10 h·m2 Background Following an expanding use of the<br />
fuel cell technology the concentration of molecular<br />
Hydrogen in the troposphere could rise significantly<br />
due to leakages in H2 production and<br />
transport. As in the troposphere molecular Hydrogen<br />
is oxidized by OH radicals it acts as an indirect<br />
greenhouse gas consuming tropospheric OH<br />
which is also an important oxidant of CH4. It is<br />
therfore necessary to better understand the mechanisms<br />
in the environmental H2 cycle in which the<br />
soil is known as the most important, but not yet<br />
properly quantified sink [Conrad, 1996].<br />
Methods and results The fluxes of the trace<br />
gases between the atmosphere and the soil are<br />
determined with the closed chamber technique.<br />
From the chamber samples for gas chromatographic<br />
analysis are taken to monitor the time dependent<br />
variations of the trace gases inside. Measurements<br />
of samples and the associated analysis<br />
of other environmental parameters show that<br />
the H2 soil sink is highly dependent on tempera-<br />
ture and soil moisture. The fluxes measured range<br />
−6 g<br />
from (7.1±0.7)·10 h·m2 −5 g<br />
to (4.9±0.5)·10 h·m2 ,<br />
results that could be confirmed by estimates made<br />
on the basis of the continuous H2 measurements<br />
performed by our group on top of the IUP building<br />
(see Hammer & Levin, Section 2.6.1 in this<br />
issue).<br />
Outlook/Future work Additional measurements<br />
( 222 Rn efflux, soil gas profile studies, isotopic<br />
signature of the uptake) will be made at the<br />
Grenzhof site to further investigate the fundamental<br />
processes responsible for the H2 soil uptake,<br />
which at present is thought to be due to encymatic<br />
oxidation. Moreover, possible correlations<br />
between the different trace gas fluxes are investigated<br />
because they could provide valuable information<br />
about underlying chemical and biochemical<br />
processes.<br />
Funding This Diploma work is funded by the<br />
EU-project EuroHydros.
88 CHAPTER 2. ATMOSPHERE AND REMOTE SENSING<br />
2.6.5 Observation of δ 13 C and δD in atmospheric methane and implementation<br />
of a methane module to the GRACE model<br />
Cordela Veidt (participating scientists: Tobias Naegler, Renate Heinz, Ingeborg Levin)<br />
Abstract The isotopic composition of methane from different clean air sampling sites is measured.<br />
Long-term trends and seasonal cycles inherit information about the development of methane sources<br />
and sinks. The sources and sinks and the concentration and composition of atmospheric methane will<br />
be simulated with the 28-box model GRACE and evaluated with available measured datasets.<br />
Figure 2.49: Methane mixing ratios and growth<br />
rates in high northern and high southern latitudes.<br />
Alert: N82 ◦ 25 ′ W62 ◦ 52 ′ ; Neumayer station:<br />
S70 ◦ 39 ′ W8 ◦ 15 ′ . Tanks: high-volume biweekly<br />
integrated (Alert) and spot (Neumayer)<br />
samples. Flasks: small-volume biweekly spot<br />
samples.<br />
Background The different sources of methane,<br />
both natural and anthropogenic, show a different<br />
isotopic composition and all sink processes are<br />
fractionating methane isotopes to a different extent.<br />
Therefore, relative changes in CH4 sources<br />
also cause changes in the isotopic composition of<br />
atmospheric CH4. The isotopic signature of the<br />
atmospheric methane does not only correspond to<br />
shifts in the sources, but also depends on the total<br />
amount of atmospheric methane into which the<br />
methane of the sources is being diluted. Therefore<br />
and in contrast to total methane, isotopic ratios<br />
in global atmospheric methane adjust only slowly<br />
to a new equilibrium state. To identify source alterations<br />
which occured during the past decades,<br />
model simulations of the atmospheric response,<br />
therfore need to be applied.<br />
Methods and results High volume air samples<br />
from Neumayer station (Antarctica), Alert<br />
(Nunavut, Canada) and Izaña (Tenerife, Spain)<br />
with temporal resolution of about a fortnight are<br />
shipped to Heidelberg and methane mixing ratios<br />
are measured here by gas chromatography. To<br />
determine the isotopic composition the methane<br />
from about 500l of air has to be quantitatively<br />
extracted. δD of about 2/3 of the obtained CH4<br />
is measured with a tunable diode laser absorption<br />
spectometer (TDLAS) because of its small standard<br />
deviation of 1.0� for the whole process. The<br />
remaining part of the sample is catalytically combusted<br />
to CO2 and H2O, the H2O is reduced to<br />
H2 and δ 13 C and δD are measured by mass spectrometry.<br />
The standard deviation for the whole<br />
process is σ δ 13 C = 0.07� and σδD = 2.0�. Data<br />
evaluation of the set of CH4 samples displayed<br />
in Figure 2.49 is not yet completed, the following<br />
results, especially δD, should thus be taken<br />
as preliminary. Linear trend in δ 13 C: 1988-1992<br />
Neumayer +0.01 to +0.04�/yr. 1992-1999 Alert<br />
+0.01 to +0.04�/yr, Izaña 0 to +0.05�/yr,<br />
Neumayer +0.03 to +0.06�/yr. From 1999-2004<br />
there is no trend observed for Alert while Neumayer<br />
shows a small maximum in 1999/2000 with<br />
a succeeding negative trend till 2004 of about -<br />
0.01 to -0.04�/yr. Linear trend in δD: 1992-1997<br />
Alert +2 to +3�/yr, Izaña +1.5 to +2.8�/yr,<br />
Neumayer +1.2 to +3.5�/yr. For the period<br />
1997 to 2004 and 2005, respectively, there is no<br />
trend observed at Alert and Neumayer. A peakto-peak<br />
amplitude of the seasonal cycle of δ 13 C<br />
at Alert is 0.25 to 0.6�, and at Neumayer 0.15 to<br />
0.3�. For δD we observe at Alert 6 to 10�, and<br />
at Neumayer 4 to 7�.<br />
To simulate the atmospheric methane trends under<br />
changing methane source configurations a<br />
methane source module has been added to the<br />
28-box model GRACE [Naegler, 2005]. Its atmosphere<br />
consists of a planetary boundary layer, a<br />
free troposphere, and three stratospheric layers.<br />
The layers of each hemisphere are segmented into<br />
three latitudinal boxes.<br />
Outlook / Future work All established<br />
methane sink processes will be included in the atmosphere<br />
of the GRACE model. After evaluation<br />
of our and all other published source and atmospheric<br />
data, the atmospheric constitution during<br />
the last three centuries will be simulated according<br />
to different source and sink scenarios. Comparison<br />
of measured and modelled data should expose<br />
improved information about the development<br />
of methane sources during the past decades.
2.6. CARBON CYCLE GROUP 89<br />
References<br />
Chevillard, A., Karstens, U., Ciais, P., Lafont, S., & Heimann, M. 2002. Simulation of atmsopheric<br />
CO2 over Europe and western Siberia using the regional scale model REMO. Tellus, 54B, 872–894.<br />
Conrad, Ralf. 1996. Soil Microorganisms as Controllers of Atmospheric Tracer Gases (H2, CO, CH4,<br />
OCS, N2O, and NO). Microbiol. Reviews, 60(4), 609–640.<br />
Engel, A., Möbius, T., Haase, H.-P., Bönisch, H., Wetter, T., Schmidt, U., Levin, I., Reddmann, T.,<br />
Oelhaf, H., Wetzel, G., Grunow, K., Huret, N., & Pirre, M. 2006. Observation of mesospheric air<br />
inside the arctic stratospheric polar vortex in early 2006. Atmos. Chem. Phys., 6, 267–282.<br />
Gamnitzer, U., Karstens, U., Kromer, B., Neubert, R. E M., Meijer, H. A. J., Schroeder, H., & Levin,<br />
I. 2006. Carbon monoxide: A quantitative tracer for fossil fuel CO2? J. Geophys. Res., 111,<br />
D22302, doi:10.1029/2005JD006966.<br />
Levin, I., & Hesshaimer, V. 2000. Radiocarbon - a unique tracer of global carbon cycle dynamics.<br />
Radiocarbon, 42(1), 69–80.<br />
Levin, I., & Karstens, U. 2006a. Inferring high-resolution fossil fuel CO2 records at continental sites<br />
from combined 14 CO2 and CO observations. accepted for publication in Tellus B.<br />
Levin, I., & Karstens, U. 2006b. Quantifying fossil fuel CO2 over Europe. In: Dolman, A. J.,<br />
Freibauer, A., & Valentini, R. (eds), Observing the Continental Scale Greenhouse Gas Balance of<br />
Europe. Heidelberg, Germany: Springer-Verlag, Ecological Studies Series.<br />
Levin, I., & Kromer, B. 2004. The tropospheric 14 CO2 level in mid-latitudes of the Northern Hemisphere<br />
(1959-2003). Radiocarbon, 46(3), 1 261–1 272.<br />
Levin, I., Glatzel-Mattheier, H., Marik, T., Cuntz, M., Schmidt, M., & Worthy, D.E. 1999. Verification<br />
of German methane emission inventories and their recent changes based on atmospheric<br />
observations. J. Geophys. Res., 104(D3), 3447–3456.<br />
Levin, I., Born, M., Cuntz, M., Langendörfer, U., Mantsch, S., Naegler, T., Schmidt, M., Varlagin,<br />
A., Verclas, S., & Wagenbach, D. 2002. Observations of atmospheric variability and soil exhalation<br />
rate of radon-222 at a Russian forest site. Technical approach and deployment for boundary layer<br />
studies. Tellus B, 54(5), 462–475.<br />
Levin, I., Kromer, B., Schmidt, M., & Sartorius, H. 2003. A novel approach for independent budgeting<br />
of fossil fuel CO2 over Europe by 14 CO2 observations. Geophys. Res. Letters, 30(23),<br />
doi:10.1029/2003GL018477.<br />
Naegler, T. 2005. Simulating Bomb Radiocarbon: Consequences for the Global Carbon Cycle. PhD<br />
thesis, University of Heidelberg, Heidelberg, Germany.<br />
Naegler, T., & Levin, I. 2006. Closing the Global Radiocarbon Budget 1945-2005. J. Geophys. Res.,<br />
111, D12311, doi:10.1029/2005JD006758.<br />
Naegler, T., Ciais, P., Rodgers, K., & Levin, I. 2006a. Excess radiocarbon constraints on airsea<br />
gas exchange and the uptake of CO2 by the oceans. Geophys. Res. Letters, 33, L11802,<br />
doi:10.1029/2005GL025408.<br />
Naegler, T., Ciais, P., Orr, J. C., Aumont, O., & Rödenbeck, C. 2006b. On evaluating ocean models<br />
with atmospheric potential oxygen. TELLUS, (in press).<br />
Rohs, S., Schiller, C., Riese, M., Engel, A., Schmidt, U., Wetter, T., Levin, I., Nakazawa, T., & Aoki,<br />
S. 2006. Long-term changes of methane and hydrogen in the stratosphere in the period 1978-2003.<br />
J. Geophys. Res., 111, D14315, doi:10.1029/2005JD006877.<br />
Schmidt, M., Glatzel-Mattheier, H., Sartorius, H., Worthy, D. E., & Levin, I. 2001. Western European<br />
N2O emissions: A top-down approach based on atmospheric observations. J. Geophys. Res., 106,<br />
5507–5516.
Terrestrial Systems<br />
3.1 Soil Physics . . . . . . . . . . . . . . . . . . . . . . . . . . . . . . . . . . . . 94<br />
3.2 Ice and Climate . . . . . . . . . . . . . . . . . . . . . . . . . . . . . . . . . 105<br />
91
Overview<br />
We study the whole range of physical processes in near-surface land systems, including the land<br />
cryosphere, at spatial scales ranging from sub-millimeter to hundreds of kilometers. These processes<br />
are relevant for a spectrum of hot environmental issues including water resources in arid and semi-arid<br />
regions, contamination of groundwater by agrochemicals and waste disposal site, as well as past and<br />
present climate changes. Current main research fields are<br />
1. fundamentals of transport processes in soils and groundwater<br />
2. geophysical near-surface exploration and monitoring<br />
3. thermal and hydraulic dynamics of permafrost in a changing environment<br />
4. climate and environmental archives in glaciers and ice shields<br />
The group is organized in two major subgroups: “Soil Physics” covering research fields 1. . . 3 and “Ice<br />
and Climate” covering research field 4. An overview of their current research activities is given on<br />
pages 94ff and 105ff, respectively.<br />
Future Work<br />
Important perspectives for the next reporting period include<br />
1. development of the Grenzhof test site to include (i) long lines of ground-penetrating radar (GPR)<br />
measurements, (ii) time-series of electrical resistivity tomography (ERT) sections, and (iii) fluxes<br />
of gaseous emissions from the soil (group of I. Levin),<br />
2. identify and develop a new test site specifically for GPR with a highly heterogeneous subsurface<br />
architecture,<br />
3. investigation of reflection and scattering properties of soil surfaces for electromagnetic waves in<br />
the frequency range between 300 MHz and 3 GHz,<br />
4. explore the permafrost distribution in Western Tibet (Aksai Chin region) and set up two monitoring<br />
stations to study the dynamics of permafrost in high, dry, and cold environments and,<br />
eventually, the impact of a warming climate,<br />
5. new Alpine ice core drillings to bedrock at Piz Murtel and at the underground of the Eisriesenwelt<br />
6. re-designing of the Air Chemistry Observatory at the Antarctic Neumayer Station III<br />
More details are again given in the respective summaries.<br />
93
94 CHAPTER 3. TERRESTRIAL SYSTEMS<br />
3.1 Soil Physics<br />
Group members<br />
Prof Dr. Kurt Roth, head of group<br />
Angelika Gassama, Staff<br />
Dipl. Phys. Holger Gerhards, PhD student<br />
Moritz Mie, diploma student<br />
Dipl. Phys. Fereidoun Rezanezhad, PhD student<br />
Dipl. Geol. Philip Schiwek, PhD student<br />
Dipl. Phys. Klaus Schneider, PhD student<br />
Carolin Ulbrich, diploma student<br />
Dr. Hans-Jrg Vogel, Post Doc, on leave<br />
Dr. Ute Wollschlger, Post Doc<br />
Abstract<br />
We (i) experimentally study transport processes in soils and groundwater – water, solutes, heat – from<br />
the lab- to the field-scale, (ii) develop and apply methods for near-surface geophysical exploration and<br />
monitoring, and (iii) explore the thermal and hydraulic dynamics of permafrost on the Tibetan plateau<br />
with a focus on climate warming.<br />
Scientific Objectives<br />
1. Qualitatively understand flow processes beyond the classical Richards-regime, specifically gravitydriven<br />
flow instabilities and the dynamics of the capillary fringe.<br />
2. Quantify effective hydraulic material properties for a very wide range of hydraulic states.<br />
3. Develop ground-penetrating radar (GPR) for directly measuring soil water content and electrical<br />
resistivity tomography (ERT) for quantitative monitoring of solute transport.<br />
4. Monitor and qualitatively understand the dynamics of the permafrost in the wet and comparatively<br />
warm region of the Eastern Tibetan plateau.<br />
Overarching topic<br />
To contribute to the fundamental understanding of transport processes in terrestrial systems, mostly<br />
soils. These may be characterized as strongly and stochastically forced processes with a highly nonlinear<br />
dynamics in a multi-scale architecture.<br />
Background<br />
Transport of water, dissolved chemicals, and heat are intimately linked in soils and they are an<br />
important, often crucial aspect of many environmental issues like quantity and quality of groundwater,<br />
irrigation and soil salinization, coupling of soil and atmosphere, and stability of permafrost soils.<br />
Despite their acknowledged significance, these processes are hardly ever represented accurately and<br />
with sufficient detail in models of environmental systems. The fundamental reason for this is that<br />
their is a huge disparity between the scale at which the underlying physics is understood, typically<br />
much less than one meter, and the scale at which a process representation is required for modeling<br />
the environment, typically hundreds of meters to tens of kilometers. The same is true for other<br />
environmental compartments like the atmosphere or the oceans. There, however, appropriate scaling<br />
laws facilitate the closing of the gap for many processes. In terrestrial systems, this is prevented by<br />
the multi-scale architecture of the medium.<br />
A further challenge of terrestrial systems is the inherent and extreme nonlinearity. For instance,<br />
the hydraulic conductivity depends strongly on water content and can easily vary by some 10 orders of<br />
magnitude in a coarse-textured soil. Depending on the external forcing, such a range may be covered<br />
within weeks or months during the summer dry-out or it is swept within minutes during a heavy<br />
rainfall or flooding event.<br />
With our research, we target both major issues: the local processes themselves and the efficient<br />
and accurate determination of the multi-scale architecture.
3.1. SOIL PHYSICS 95<br />
Main methods<br />
Multi-Step Outflow Measurement Hydraulic material properties are estimated from experiments<br />
where the boundary condition is changed in discrete steps, the resulting outflow is measured,<br />
and the whole setup is inverted numerically.<br />
Hele-Shaw Cell A quasi-twodimensional porous medium is constructed by filling the 3. . . 6 mm gap<br />
between two glass plates with sand. Transmitted light is a good proxy for volumetric water<br />
content and dye tracers facilitated the measurement of flow fields. Such Hele-Shaw cells allow<br />
monitoring of flow and transport processes with very high spatial and temporal resolutions.<br />
Ground-Penetrating Radar (GPR) Propagation of electromagnetic energy through porous media<br />
depends strongly on their dielectric properties which in turn, at frequencies between some<br />
50 MHz and 2 GHz, depends strongly on liquid water content. This in turn depends on soil<br />
texture which often changes discontinuously in natural porous media, thereby leading to strong<br />
reflectors. We have demonstrated that multi-channel GPR-measurements yield both the depth<br />
of the reflectors and the average water content between them. In the meantime, we use this<br />
method operationally in simple settings and work on improving it for more complicated ones.<br />
Electrical Resistivity Tomography (ERT) The electrical potential at the soil surface that results<br />
from injecting a very-low frequency, mHz to Hz, electrical current into the subsurface reflects the<br />
spatial distribution of the electrical conductivity. Combining the results from a large number<br />
of injection points leads to an estimate of that distribution which in turn is determined by soil<br />
texture, soil water content, and solute concentration.<br />
Soil-Weather Monitoring Station Automatic logging of profiles of soil temperature and liquid<br />
water content together with atmospheric variables (temperature, precipitation, wind velocity,<br />
humidity, net radiation or even its components, pressure, snow height) allow the microclimatic<br />
characterization of a particular site. We operate such a station at the Grenzhof test site and<br />
several of them on the Tibetan plateau.<br />
Grenzhof Test Site This site near Heidelberg is our testbed for developing and demonstrating measuring<br />
and monitoring techniques as well as for exploring the emerging field of hydrogeophysical<br />
approaches where hydraulic experiments and and geophysical observations are inverted jointly<br />
in order to arrive at more robust estimates of large-scale material properties.<br />
Main activities<br />
1. study flow instabilities and the dynamics of the capillary fringe in Hele-Shaw cells<br />
2. improve multi-step outflow methods, in particular the evaporation methods we developed<br />
3. develop and implement improved analysis tools for multi-channel GPR<br />
4. monitor and analyze thermal and hydraulic dynamics at three permafrost sites on the Tibetan<br />
plateau<br />
5. explore synthetic aperture radar (SAR) satellite images from estimating soil surface water contents<br />
Funding<br />
1. DFG RO 1080/8 “Vorhersage einfacher Transportphnomene in Bden auf der Feldskala”<br />
2. DFG RO 1080/9 “Hochauflsende experimentelle Untersuchung von Fluss und Transport in<br />
porsen Medien”<br />
3. DFG RO 1080/10 “Dynamics of Active Layer on Qinghai-Xizang Plateau”
96 CHAPTER 3. TERRESTRIAL SYSTEMS<br />
Cooperation within the institute and with groups outside of the institute<br />
1. Dr. Julia Boike, HGF Young Research Group SPARC, Alfred Wegener <strong>Institut</strong>e, Potsdam<br />
2. Prof. Dr. Peter Bastian and Dr. Olaf Ippisch, <strong>Institut</strong>e of Parallel and Distributed Systems,<br />
University of Stuttgart<br />
3. Prof. Dr. Qihao Yu and Prof. Dr. Huijun Jin, <strong>Institut</strong>e for Cold and Arid Regions Environmental<br />
& Engineering Research (CAREERI), Chinese Academy of Sciences, Lanzhou, China<br />
4. Dr. Frank Brner, Dresdner Grundwasserforschungszentrum (DGFZ), Dresden<br />
5. Dr. Benedikt Oswald, Paul Scherrer <strong>Institut</strong>e (PSI), Villigen, Schweiz<br />
Future Work<br />
see Overview<br />
Peer Reviewed Publications<br />
1. Leidenberger et al. [2006]<br />
2. Schneider et al. [2006]<br />
Diploma Theses<br />
1. Schneider [2005]<br />
PhD Theses<br />
1. Braun [2006]
3.1. SOIL PHYSICS 97<br />
3.1.1 Unstable Gravity-driven Fingering Flow in Unsaturated Porous Media<br />
Fereidoun Rezanezhad<br />
Abstract Wetting front instability, or unstable gravity-driven fingering, can occur during vertical<br />
infiltration through initially dry sand. With the aim of studying the physical process concerning of<br />
the fingering phenomena in two dimensions, experiments of water infiltration through a Hele-Shaw<br />
cell of multi-layered sand were carried out in the laboratory. Using imaging technique, we study the<br />
dynamics of water saturation in fingering flow for different flow conditions.<br />
depth [m]<br />
depth [m]<br />
0<br />
0.2<br />
0.4<br />
width [m]<br />
0 0.2 0.4<br />
0.6<br />
0.8<br />
1.0<br />
1.2<br />
1.4<br />
time:15 min<br />
a<br />
0<br />
0.1<br />
0.2<br />
0.3<br />
0.4<br />
0.5<br />
width [m]<br />
0 0.2 0.4<br />
0<br />
0.2<br />
0.4<br />
width [m]<br />
0 0.2 0.4<br />
0.6<br />
0.8<br />
1.0<br />
1.2<br />
1.4<br />
time:30 min<br />
depth [m]<br />
0<br />
0.1<br />
0.2<br />
0.3<br />
0.4<br />
0.5<br />
0<br />
0.2<br />
0.4<br />
width [m]<br />
0 0.2 0.4<br />
0.6<br />
0.8<br />
1.0<br />
1.2<br />
1.4<br />
time:75 min<br />
width [m]<br />
0 0.2 0.4<br />
0<br />
0.2<br />
0.4<br />
width [m]<br />
0 0.2 0.4<br />
0.6<br />
0.8<br />
1.0<br />
1.2<br />
1.4<br />
time:125 min<br />
depth [m]<br />
0<br />
0.1<br />
0.2<br />
0.3<br />
0.4<br />
0.5<br />
0<br />
0.2<br />
0.4<br />
width [m]<br />
0 0.2 0.4<br />
width [m]<br />
0 0.2 0.4<br />
0.6<br />
0.8<br />
1.0<br />
1.2<br />
1.4<br />
time:200 min<br />
original image<br />
normalized image deconvoluted image<br />
b c d<br />
1.00<br />
0.88<br />
0.75<br />
0.62<br />
0.50<br />
0.38<br />
0.25<br />
0.12<br />
0<br />
depth [m]<br />
0<br />
0.1<br />
0.2<br />
0.3<br />
0.4<br />
0.5<br />
width [m]<br />
0 0.2 0.4<br />
depth [m]<br />
0<br />
0.1<br />
0.2<br />
0.3<br />
0.4<br />
0.5<br />
width [m]<br />
0 0.2 0.4<br />
mobile core<br />
immobile fringe<br />
Figure 3.1: Left: a) Fingering patterns observed by Light Transmission Method (LTM) during water<br />
and dye infiltration into the multi-layered medium. b) Original observed image. c) Normalized image<br />
to visualize the water saturation. d) Deconvoluted image using the Point Spread Function (PSF).<br />
Right: The separation of the water phase into a mobile component (core) and an immobile one<br />
(fringe) observed using dye tracer infiltration.<br />
Background and Observations The fluid<br />
flow through preferential paths or fingers is important<br />
in the hydrological processes of infiltration<br />
through the soil profile. Fingered flow in porous<br />
media was studied, both in the petroleum industry<br />
to better understand oil recovery and in the environmental<br />
sciences as an instance of preferential<br />
flow of water through soil. Fingered flow occurs<br />
in homogeneous coarse grained materials when the<br />
infiltration rate is below the saturated hydraulic<br />
conductivity (Ks) and gravitational influences on<br />
the imbibing solution dominate the forces of capillary.<br />
We established such conditions in a Hele-<br />
Shaw cell where a layer of fine sand was placed on<br />
top of a coarse sand. Flow instability is induced at<br />
the transition from the fine-textured sand to the<br />
coarse-textured sand. The fingers are disturbed<br />
within the heterogenous middle-layer and reappear<br />
in the uniform layer below (Fig.1).<br />
Funding DFG project RO 1080/9-1&2, 2005-<br />
2006<br />
Methods and results We improved the Light<br />
Transmission Method (LTM) to measure the dy-<br />
namics of water saturation within flow fingers in<br />
great detail with high spatial and temporal resolution.<br />
This was achieved by adding a deconvolution<br />
procedure using the Point Spread Function<br />
(PSF) to correct the measurements for multiple<br />
light scattering in observed image. The method<br />
was calibrated using X-ray absorption. Additionally,<br />
after stabilization of the fingered flow pattern,<br />
we applied a dye tracer to visualize the velocity<br />
field within flow fingers. We analyzed the<br />
dynamics of water within the finger tips, along the<br />
finger core behind the tip, and within the fringe of<br />
the fingers during lateral growth. Our results confirm<br />
previous findings of saturation overshoot in<br />
the finger tips and revealed a saturation minimum<br />
behind the tip as a new feature. The finger development<br />
was characterized by a gradual increase<br />
in water content within the core of the finger behind<br />
this minimum and a gradual widening of the<br />
fingers to a quasi-stable state. In this state, a<br />
sharp separation into a core with fast convective<br />
flow and a fringe with exceedingly slow flow was<br />
detected.<br />
Main Publication [Rezanezhad et al. , 2006]
98 CHAPTER 3. TERRESTRIAL SYSTEMS<br />
3.1.2 Novel Evaporation Experiment to Determine Soil Hydraulic Properties<br />
Klaus Schneider<br />
Abstract A new method to determine soil hydraulic properties in the dry and very dry range is<br />
developed and analysed. The data are inverted under the assumption that the coupling between the<br />
soil and the well-mixed atmosphere can be modelled by a boundary layer with a constant transfer<br />
resistance.<br />
Background An important issue in soil physics<br />
is the determination of the hydraulic parameters<br />
of soils. If the soil water characteristic θ(ψm)<br />
and the conductivity function K(θ) of a soil are<br />
known, its hydraulic dynamics can be simulated<br />
using Richards’ equation.<br />
Several methods exist to determine the hydraulic<br />
properties in the laboratory. For the wet<br />
range of potentials the multistep-outflow (MSO)<br />
method is well established. However this method<br />
is fundamentally limited by the ambient air pressure.<br />
Unlimited potentials are theoretically possible<br />
with evaporation experiments. However traditional<br />
evaporation experiments, due to the useage<br />
of tensiometers, are again limited by the air entry<br />
point of the tensiometer, or the vapour pressure<br />
of water, whichever is higher.<br />
To obtain valid hydraulic properties also for<br />
the dry range, a new evaporation method and a<br />
numerical model to determine soil hydraulic properties<br />
by inversion was developed and tested.<br />
Methods and results The bottom of the soil<br />
sample is closed, its top is closed by a 30 mm high<br />
gas-tight head space. A constant flow of air is established<br />
through the head space to remove the<br />
water vapour and thereby set the potential. The<br />
difference of water vapour content before and after<br />
the evaporation chamber (measured accurately<br />
by infrared absorption spectroscopy) and the air<br />
flow through the chamber quantify the water flux<br />
at the upper boundary of the soil sample, while<br />
the relative humidity and the temperature in the<br />
evaporation chamber define the equivalent matric<br />
potential of the air. The latter is set by an air<br />
conditioner.<br />
Hydraulic parameters are estimated from the<br />
evaporation measurements using inverse modelling.<br />
The forward model integrates Richards’<br />
equation with an effective conductivity which accounts<br />
for water vapour movement. The soilatmosphere<br />
boundary layer at the upper boundary<br />
is explicitely modelled as a diffusive layer of<br />
constant thickness rb. This is a nonlinear boundary<br />
condition and was implemented in the forward<br />
model.<br />
Since inverse methods are not straightforward<br />
well coded standard procedures, validating steps<br />
are important, e.g. sensitivity and parameter identification<br />
analyses. These are currently done.<br />
water vapour partial pressure / kPa<br />
flux / (mm/h)<br />
deviation / %<br />
2<br />
1.8<br />
1.6<br />
1.4<br />
1.2<br />
1<br />
0.8<br />
0.6<br />
0.4<br />
0.2<br />
0.35<br />
0.3<br />
0.25<br />
0.2<br />
0.15<br />
0.1<br />
0.05<br />
0<br />
40<br />
20<br />
0<br />
−20<br />
−40<br />
−60<br />
water vapour partial pressue<br />
temperature<br />
potential<br />
measured flux<br />
simulated flux<br />
deviation<br />
−80<br />
0 100 200 300<br />
time / h<br />
400 500 600<br />
Figure 3.2: Results of an evaporation experiment<br />
with an undisturbed soil sample. Measured quantities<br />
pw and T (upper frame), matric potential<br />
at the upper boundary calculated from pw<br />
and T and measured and simulated outflux (middle<br />
frame). Notice that the latter two practically<br />
overlap after t > 30 h. The discrepancy at<br />
early times is attributed to thermal processes not<br />
considered in the model. The relative deviation<br />
(j w exp − j w model )/jw exp is shown in the bottom frame<br />
together with the 1σ measuring uncertainty (gray<br />
band).<br />
Outlook/Future work The experiment will be<br />
extended to allow a wider range of boundary conditions.<br />
Main publications [Schneider et al. , 2006]<br />
300<br />
299<br />
298<br />
297<br />
296<br />
295<br />
294<br />
293<br />
292<br />
291<br />
0<br />
−50<br />
−100<br />
−150<br />
−200<br />
−250<br />
−300<br />
temperature / K<br />
matric potential / MPa
3.1. SOIL PHYSICS 99<br />
3.1.3 Physical processes in the capillary fringe<br />
Moritz Mie<br />
Abstract In order to understand the impact of different factors on size and shape of the capillary<br />
fringe, we use high-resolution measurements of the water saturation obtained from imaging techniques.<br />
The most important part of this work is to explain the nonlinear behavior of the capillary fringe by<br />
changing the water table. Moreover we try to understand the connection between this non-linear<br />
behavior and the hysteresis of the soil-water characteristic.<br />
motor control Hele−Shaw cell<br />
digital camera<br />
Figure 3.3: Sketch of the experimental setup: A transparent sand-filled Hele-Shaw cell is placed<br />
between a diffusive light source and a digital camera. The water table in the cell is controlled by a<br />
motor connected to a computer<br />
Background In the last century most of the<br />
research efforts by soil scientists and hydrologists<br />
have focused on the vadose zone and on the<br />
groundwater region, respectively. Mostly the impact<br />
of the transition zone, the capillary fringe,<br />
has been ignored. The thickness of this zone depends<br />
on the properties of the respective soil, particularly<br />
on the pore space and on the surface<br />
roughness of the sand grains. With this experiment<br />
we investigate the influence of a periodically<br />
changing water table on size and shape of the capillary<br />
fringe.<br />
Methods and results To measure the water<br />
content that is needed to determine the height of<br />
the capillary fringe we use a Hele-Shaw cell that<br />
consists of two parallel 50 × 30 cm 2 glass plates<br />
with a 3 mm gap filled with homogeneous sand.<br />
At the bottom, the cell is connected to a movable<br />
water reservoir. We use the Light Transmission<br />
Method (LTM) that is based on the fact that<br />
the intensity of transmitted light can be used as a<br />
proxy of water content. The calibration of LTM<br />
with respect to water saturation is done by simultaneous<br />
measurements of X-ray and light transmission.<br />
A digital camera takes interval photos<br />
during the whole experiment. By subtracting the<br />
dry sand image from all images we get a normalized<br />
image time series which represents the water<br />
content in our sand column. In the first experimental<br />
series we measure the dynamics of water<br />
saturation for different water table. We chose different<br />
amplitudes and frequencies for the water table<br />
change. By analysing the first experiments we<br />
found that in the experiments with high frequencies<br />
(period of one hour) the system never reaches<br />
equilibrium. In experiments with lower frequencies<br />
(period of 24 hours) the state of equilibrium<br />
during the first imbibition process is reached after<br />
some hours. Subsequent cycles show a much<br />
faster equilibration.<br />
Outlook Interpreting the results of this experiment<br />
is one part of the future work. This encompasses<br />
the study of limiting cycles as well as the<br />
nonlinear damping characteristics of the capillary<br />
fringe. Moreover we are going to do some similar<br />
experiments with changing parameters. For instance<br />
we will use different velocities of the water<br />
table change by slow or fast drainage and imbibition.<br />
Another parameter to change is the surface<br />
roughness of the sand grains. Different kinds of<br />
sand might have different impact on the shape of<br />
the capillary fringe.
100 CHAPTER 3. TERRESTRIAL SYSTEMS<br />
3.1.4 Extension of the Grenzhof test site for conducting hydrogeophysical<br />
investigations of water flow and solute transport at the field scale<br />
Ute Wollschläger<br />
Abstract At the Grenzhof test site hydrogeophysical methods are applied in combination with<br />
classical soil physical techniques to estimate field-scale water flow and solute transport processes.<br />
Recently the test site was extended to a 10 m × 300 m sized area to apply ground-penetrating radar<br />
and electrical resistivity measurements at a scale of several hundreds of meters.<br />
[ ns]<br />
time<br />
l<br />
e<br />
trav<br />
0<br />
10<br />
20<br />
30<br />
40<br />
50<br />
distance [m]<br />
0 50 100 150 200<br />
0 50 100 150 200<br />
Figure 3.4: Test site Grenzhof (left), electrical resistivity profile (upper right), and radargram (lower<br />
right). Note that the measurements were not conducted along the same survey line.<br />
.<br />
Background A quantitative estimation of water<br />
flow and solute transport at the field scale<br />
is still a challenge. The heterogeneous structure<br />
of most soils usually requires excavation of soil<br />
profiles and intensive sampling of water content<br />
and/or solute concentrations that cannot easily<br />
be done at scales larger than a few meters. Hydrogeophysical<br />
methods like ground-penetrating<br />
radar (GPR), time-domain reflectometry (TDR)<br />
and electrical resistivity tomography (ERT) are<br />
non-invasive methods that provide measurements<br />
of the dielectric and electric structure of soils.<br />
These can be used as proxy variables to estimate<br />
profiles of water content and solute concentrations,<br />
respectively. These methods have the potential<br />
to provide a data basis that allows quantitative<br />
investigation and modeling of water flow<br />
and solute transport over larger areas (i.e. a few<br />
hundreds of meters) than those covered by classical<br />
methods.<br />
Funding Land Baden–Württemberg<br />
Methods and results So far, water flow and<br />
solute transport processes were investigated at the<br />
Grenzhof test site from time series of TDR and<br />
GPR measurements at a 10 m × 25 m sized area.<br />
Particularly GPR measurements showed that the<br />
method is well suited to measure and monitor<br />
the dynamics of soil water content, whereas monitoring<br />
of a salt tracer only provided information<br />
about the position of the ”backend” of the tracer<br />
pulse due to attenuation of the GPR signal caused<br />
by high electrical conductivity of the tracer.<br />
Recently, the site was extended to 10 m × 300 m.<br />
In addition to the conventional GPR investigations,<br />
multi-channel GPR surveys are conducted<br />
that provide two-point common-midpoint measurements<br />
and therefore allow simultaneous profiling<br />
of reflector depth and water content over large<br />
areas. As a new method ERT is applied that allows<br />
monitoring of a salt tracer under conditions<br />
where GPR signals are attenuated.<br />
Outlook/Future work Time series of GPR–<br />
and ERT–measurements will be taken to noninvasively<br />
measure and monitor the dynamics of<br />
soil water content and the movement of conservative<br />
salt tracers. The joint application of these<br />
complementary methods is expected to allow the<br />
investigation of tracer movement even at conditions<br />
where GPR fails due to high electrical conductivity<br />
of the tracer solution. The data will<br />
be used as basis to model water flow and solute<br />
transport processes at the field scale.
3.1. SOIL PHYSICS 101<br />
3.1.5 Installation of three soil and weather monitoring stations in permafrost<br />
soils on the Qinghai–Tibet Plateau<br />
Philip Schiwek<br />
Abstract The high altitude permafrost on the Qinghai–Tibet Plateau exists under climatic conditions<br />
that are quite different from those of permafrost in the arctic (strong radiation, pronounced<br />
daily temperature cycles). The stations were installed to explore the thermal dynamics of the Plateau<br />
permafrost. For this purpose the station measure meteorological data, soil temperature and soil water<br />
content.<br />
Background Under the current warming climate<br />
permafrost is retreating almost worldwide.<br />
On the Qinghai–Tibet Plateau the degeneration<br />
of permafrost in the last decades caused desertification.<br />
Lakes disappeared and the runoff of<br />
catchments for rivers, that have their source on<br />
the plateau, decreased. This is of course important<br />
for the Tibetan people, who live as farmers<br />
in this area. But it is also a major problem<br />
for the water supply for the rest of China. Another<br />
problem is, that through desertification on<br />
the Plateau more dust storms could develop. The<br />
degeneration of permafrost changes the mechanical<br />
stability of the ground and thawing of massive<br />
ice layers and lenses lead to vertical movement of<br />
the soil. Those are major problems concerning the<br />
construction of roads and railways on the Plateau.<br />
Except of the very high mountain ranges, permafrost<br />
in the Qinghai–Tibet area is classified as<br />
a warm permafrost. So the assumption can be<br />
made, that it reacts fast on climate changes. It<br />
is hopped that this is monitored by the stations,<br />
that should operate over several years.<br />
With the analyses of the thermal and hydraulic<br />
dynamics and with their quantification, more insight<br />
could be achieved how the heat energy exchange<br />
between the atmosphere and the soil develops<br />
under changing climate conditions. For<br />
instance could a higher precipitation in summer<br />
bring more energy through the warm water into<br />
the ground. It could change the albedo of the<br />
ground and energy is removed from the ground<br />
due to higher evaporation. In such cases it is not<br />
easy to estimate, what the dominating factors are.<br />
Funding DFG project: Ro 1080/10-2<br />
Figure 3.5: Each of the soil–weather stations<br />
measures meteorological data, soil temperature<br />
and liquid soil water content of the active layer<br />
in several depth down to the permafrost table.<br />
Methods and results To study the thermal<br />
dynamics of the Qinghai–Tibet Plateau permafrost<br />
three soil– and weather–monitoring stations<br />
were built in Qinghai province. The stations<br />
measure air temperature, wind speed and wind<br />
direction, precipitation, snow hight, net radiation<br />
and air pressure. Those are the parameters, that<br />
control the system from the surface. Also the soil<br />
temperature and the liquid water content of the<br />
active layer are measured in several depth. The<br />
Sensors were installed in the ground down to the<br />
depth of the permafrost table. Liquid water content<br />
is measured with TDR. Ice content or vapour<br />
could not be measured. The data are measured<br />
and stored every hour. At two stations temperature<br />
of the deeper permafrost can be derived from<br />
nearby boreholes.<br />
At the site Cumarhe (35 ◦ 10.72’N 93 ◦ 57.21’E<br />
4443 m) permafrost lies at a depth of 2.4 m,<br />
groundwater at 1.3 m depth. The site is located on<br />
an alluvial fan, the soil consists of rather coarse<br />
sediments. At Qumahe (34 ◦ 54.23’N 94 ◦ 47.42’E<br />
4447 m) the station is built on a peat soil with<br />
high organic content and fine sediments and a permafrost<br />
table at 1.36 m depth. The vegetation<br />
here is very strong. At Zuimatan (35 ◦ 21.47’N<br />
99 ◦ 08.37’E 4187 m) sediments are again coarser<br />
and vegetation is weak. The permafrost table lies<br />
at 2.65 m depth, groundwater at 2.05 m. The site<br />
is characterised by a high salinity of the groundwater.<br />
At two stations measurements with Ground<br />
Penetrating Radar were made.<br />
Outlook/Future work The data will be read<br />
out every three month. With this data analysis for<br />
thermal and hydraulics dynamics will be made.
102 CHAPTER 3. TERRESTRIAL SYSTEMS<br />
3.1.6 Investigation on the applicability of remote sensing in surface moisture<br />
studies<br />
Carolin Ulbrich<br />
Abstract There is no doubt about the importance of surface soil moisture determination. However<br />
due to its variation within a few meters one has to carefully watch the scale of measurement. We want<br />
to bridge the gap between the scale of the common measurements of up to a few meters and the large<br />
scale of the planned SMOS-mission that will be 30 km. Therefor we perform a preliminary study on<br />
satellite-born radar data with a 30 m resolution aimed at determining the applicability of such data<br />
in surface soil moisture studies.<br />
Mannheim<br />
Ludwigshafen<br />
Heidelberg<br />
GPR<br />
1 m<br />
30 km 10 m<br />
Background The scale of measurement is crucial<br />
to soil moisture determination (see Figure<br />
3.6).<br />
To investigate preferential flow, contaminants and<br />
ground water quality small in-situ probes can be<br />
used. Convenient are for example TDR probes or<br />
capacitance measurements for volumes of about<br />
1 dm 3 . These measurements are exact but not applicable<br />
on larger scales. Data from such moisture<br />
probes can lead to essential errors when trying to<br />
extract field information from them because they<br />
cannot be installed in an arbitrary quantity (work<br />
intensive, expensive, time scale). However there<br />
are soils that have a variability in soil moisture<br />
reaching from dry to saturated within a few meters.<br />
Arctic tundra is an example.<br />
Ground penetrating radar (GPR) provides a tool<br />
that may be used to perform measurements on<br />
the field-scale. The velocity of the emitted electromagnetic<br />
wave is affected by soil moisture. A<br />
resolution of about 1 m for surface moisture can<br />
be obtained on a scale of hundreds of meters.<br />
At the largest scales, air and space born radar<br />
can be used to determine surface soil moisture.<br />
In active measurements the backscattered radar<br />
pulse is recorded, passive measurements address<br />
brightness temperature. The area information is<br />
needed for example in coupled land-atmosphere<br />
models and meteorology. Resolution ranges from<br />
a few meters for airplane measurements and 30 m<br />
for the active radar satellites ERS2 and Envisat to<br />
30 km for the upcoming passive radar instrument<br />
SMOS.<br />
Funding Land Baden-Württemberg, data provided<br />
by the European Space Agency<br />
Figure 3.6: The resolution of the available surface<br />
moisture measurement tools varies between<br />
less then 1 m, typical for ground radar (GPR),<br />
at least 10 m for active radar satellites and over<br />
30 km for the passive radar satellite SMOS.<br />
Methods and results In this preliminary<br />
study data from the satellite Envisat were analyzed.<br />
The test areas include the Grenzhof site,<br />
near Heidelberg, as well as some sites in China.<br />
Due to the low spatial resolution of about 30 m<br />
and the heterogenous vegetation of the fields at<br />
the Grenzhof we will probably not apply the<br />
method to this test site. An air plane active or<br />
passive radar time series would be ideal to investigate<br />
the up-scaling of soil moisture data that are<br />
measured with GPR on the 1 m-scale to the satellite<br />
scale in such heterogeneous regions.<br />
Some test sites in China are characterized by large<br />
and homogenous bare soil planes which makes the<br />
interpretation of soil moisture satellite data much<br />
more reliable. Unfortunately it will not be possible<br />
to obtain a dense GPR time series of these<br />
regions.<br />
The interpretation of backscatter radar data requires<br />
detailed auxiliary information about the<br />
soil surface on a km-scale. This could be avoided<br />
in a long time series making use of interferometry.<br />
A great opportunity to determine surface soil<br />
moisture that requires no detailed knowledge of<br />
the surface is provided by the Japanese satellite<br />
ALOS. Its radar device is capable of measuring<br />
radar data multipolarized. Soil moisture can then<br />
be extracted directly from the data. Two acquisitions<br />
in this mode are planned in 2007. The<br />
Canadian Radarsat2 will offer similar opportunities<br />
(launch planned for 2007).<br />
Outlook/Future work From the ALOS data<br />
surface information can be extracted and used to<br />
interpret the available ESA data. We hope to be<br />
able to draw a line from the operating satellites to<br />
the SMOS satellite that is planned to be launched<br />
in 2007 and will compare these data sets to ground<br />
measurements.
3.1. SOIL PHYSICS 103<br />
3.1.7 Simulation of Ground Penetrating Radar Measurements over Multi-<br />
Layered Materials using a Plane Wave Approach<br />
Holger Gerhards<br />
Abstract A plane wave approach adapted from optical applications for graded index models is used<br />
for predicting ground penetrating radar measurements over smoothly changing dielectric properties,<br />
which are used as proxies for soil water content and salt concentration.<br />
(a) (b)<br />
amplitude (scaled) [-]<br />
-0.3 -0.2 -0.1 0 0.1 0.2 0.3<br />
rel. diel. permittivity<br />
0 10 20<br />
0<br />
Figure 3.7: (a) Modeled radiation of the GPR system. (b) Permittivity profile and reflected electromagnetic<br />
signal from a discrete permittivity jump and a capillary fringe in a coarse (grey line) and a<br />
fine textured (black line) soil.<br />
Background Ground penetrating radar (GPR)<br />
is a widely used method for qualitative and quantitative<br />
studies for non-invasive investigations of<br />
different materials and for the remote detection of<br />
buried objects. The significant difference between<br />
the dielectric permittivity of soil and water make<br />
GPR also attractive for applications in hydrological<br />
sciences. These applications are confronted<br />
with smooth transitions in dielectric properties,<br />
caused by gradual textural changes, by capillary<br />
fringes above water tables, or by solute pulses.<br />
Because of all these effects the evaluation of measured<br />
GPR data is nontrivial. Although tools of<br />
numerical forward modeling or recent inversion<br />
techniques are available, a lot of evaluation procedures<br />
are based on ray approach estimations extracted<br />
from the phase information of the measured<br />
signals. The reason for this is the very high<br />
computational cost of the numerical methods.<br />
Funding DFG project: Ro 1080 / 10-2<br />
Methods and results A plane wave approach<br />
for an arbitrary horizontal layered medium,<br />
adapted from optical theory, was set up. It<br />
uses the propagation of the electric and magnetic<br />
field components within a homogeneous medium,<br />
which are continuous at boundaries. This propagation<br />
can be represented mathematically by matrices,<br />
which can be multiplied iteratively. The<br />
time [ns]<br />
0<br />
20<br />
40<br />
60<br />
x10<br />
general reflection coefficient is a function of the<br />
components of the global transition (propagation)<br />
matrix. With this approach GPR signals can be<br />
predicted by applying an adequate frequency and<br />
angle spectrum to simulate the radiation of the<br />
emitted GPR pulse (Fig. 3.7).<br />
It was demonstrate that smooth transitions<br />
lead to reflections with low amplitude but with<br />
a specific signature (Fig. 3.7). Apparently, transitions<br />
from lower to higher permittivities (water<br />
contents) act as low-pass filters and lead to<br />
a broadening of the reflected wavelet.<br />
Furthermore, our simulations show, that the<br />
travel time of the largest wavelet extremum leads<br />
to a good matching depth for the upper end of the<br />
capillary fringe or the maximum of a conductivity<br />
pulse.<br />
Outlook/Future work Simple experiments<br />
will be conducted to analyze GPR reflected data<br />
from gradual changes of water content and conductivity.<br />
They will be compared with the simulations.<br />
This allows to assess the contribution of<br />
near field effects which are not accounted for in<br />
the plane wave approach.<br />
Main publications H.Gerhards, F.Lederer,<br />
K.Roth: Simulations of Ground Penetrating<br />
Radar Reflections from Gradual Changes of Dielectric<br />
Properties, Geophysics, submitted<br />
depth [m]<br />
0.5<br />
1.0<br />
1.5<br />
2.0<br />
2.5<br />
3.0
104 CHAPTER 3. TERRESTRIAL SYSTEMS<br />
References<br />
Braun, H. 2006. A new hypothesis for the 1470-year cycle of abrupt warming events in the last ice-age.<br />
PhD Thesis, <strong>Universität</strong> Heidelberg.<br />
Leidenberger, P., Oswald, B., & Roth, K. 2006. Efficient reconstruction of dispersive dielectric profiles<br />
using time domain reflectrometry (TDR). Hydrol. Earth Syst. Sci., 10, 209–232.<br />
Rezanezhad, F, Vogel, H.-J., & Roth, K. 2006. Experimental study of fingered flow through initially<br />
dry sand. Hydrol. Earth Syst. Sci. Discuss., 3, 2595–2620.<br />
Schneider, Klaus. 2005. Novel evaporation experiment to determine soil hydraulic properties. diploma<br />
thesis, <strong>Universität</strong> Heidelberg.<br />
Schneider, Klaus, Ippisch, Olaf, & Roth, Kurt. 2006. Novel evaporation experiment to determine soil<br />
hydraulic properties. 10, 817–827.
3.2. ICE AND CLIMATE 105<br />
3.2 Ice and Climate<br />
Dietmar Wagenbach<br />
Group members<br />
Thomas Gölzhäuser, diploma student<br />
Felix Jahn, diploma student<br />
Dipl. Phys. C. Offermann<br />
Dipl. Phys. B. May, PhD student<br />
Dipl. Phys. M. Pettinger, PhD student<br />
Dipl. Phys. M. Schock, PhD student<br />
D. Wagenbach, head of group<br />
Figure 3.8: Drilling camp at Colle Gnifetti (Monte Rosa 4500 m a.s.l.). From left to right: drill shelter,<br />
Zumsteinspitze and Dufour Spitze (4634 m a.s.l.). Picture: Olaf Eisen<br />
Main methods and specific objectives Among all paleo-archives, only non-temperated glaciers<br />
basically allow the reconstruction of climate as well as of environmental records. Appropriate ice core<br />
studies may thus allow to tackle the crucial problem about the mutual relationships between changes<br />
of climate and bio-geochemical cycles through a retrospective approach. In this context, the ’Ice and<br />
Climate’ group concentrates on ice core investigations by deploying the following species, backed up<br />
by standard physical ice properties:<br />
• water-isotopomeres δ 18 O-δD (thermometry)<br />
• various particulate key species as mineral dust, major ions, organic carbon (bio-geochemical<br />
cycles),<br />
• natural radionuclides as terrestrial 210 Pb, cosmogenic 10 Be, 3 H, 36 Cl (solar variability) and on<br />
3 He, 4 He isotopes (basal layer dynamics).<br />
Apart from joint activities within polar ice core studies [EPICA Community Members, 2006], emphasis<br />
is thereby on the selfcontained exploration of non-temperated Alpine glaciers. Such small scale drill<br />
sites are unique in supplementing high latitude ice core findings, though reliable atmospheric signals<br />
would be much more difficult to elucidate here [Preunkert et al. , 2000]. In addition to ice core<br />
analyses, deserving application of novel techniques [Preunkert & Wagenbach, 1998] and species [Ruth<br />
et al. , 2003], also process-oriented field studies are regularly performed. These activities are aimed at<br />
understanding the transfer of the atmospheric signals into the glacier archive as well as at constraining<br />
their basic glaciological embedding conditions (as e.g. controlled by the near surface and near bed-rock<br />
glacier dynamics). Based on external collaborations, dedicated atmospheric observations are deployed<br />
here at various Alpine and Antarctic sites [Wagenbach et al. [1998], Piel et al. [2006]], which also<br />
include isotopic fingerprints of aerosol samples ( 15 N, 14 C, 10 Be). Within the glaciological issue, joint<br />
efforts range from ground penetrating radar soundings of the internal stratigraphy in Alpine glaciers
106 CHAPTER 3. TERRESTRIAL SYSTEMS<br />
[Eisen et al. , 2003] and related glacio-meterological and glacio-chemical surveys, to the prospection<br />
of novel ice core species ( 3 He/ 4 He [Friedrich, 2003]) and dating techniques as 14 C in organic matter<br />
or 26 Al/ 10 Be).<br />
Overview on principal activities and achievements<br />
Alpine research<br />
a) EU ALP-IMP related: Regular ice core analyses started on the new KCI core (Colle Gnifetti, Monte<br />
Rosa), which was drilled to bed rock in collaboration with KUP (University Bern) and the Geographical<br />
<strong>Institut</strong>e of University Zürich. Thereby, the basic stratigraphy (dust, total ion content, ice conductivity)<br />
could be investigated at sub-cm depth resolution via continuous flow analyses over 50 %<br />
of the total depth. Additional profilings down to bedrock were finished for stable water isotopes in<br />
coarse resolution and, in collaboration with AWI, for high resolution scanning of the core density<br />
and optical transparency. From these analyses it became evident, that the core: (1) indeed offers an<br />
uniquely low accumulation rate (comparable to the lowest one in North Greenland), which, different<br />
to all other cores shows increase in the up stream area; (2) did not reach the very ice rock interface<br />
due to a blocking boulder. Nevertheless we may expect from the bottom part of the KCI core records<br />
with a higher time resolution, than hitherto obtained from other Alpine cores.<br />
b) EU CARBOSOL related: Evaluation of the IUP contribution demonstrated the invaluable potential<br />
of the radioisotopes 210 Pb and radiocarbon in the interpretation of the spatio-temporal changes<br />
observed in the CARBOSOL aerosol network. Here, 210 Pb was shown to help in distinguishing transport<br />
from source related variations [Hammer et al. , submitted]. Radiocarbon allowed to quantify the<br />
fossil fraction of the organic aerosol over different clean air and polluted areas, as forming the base for<br />
estimating the source apportionment of secondary organic aerosol. Also related to the anthropogenic<br />
impact on the European clean air aerosol, first DOC records from Alpine ice core were used to infer<br />
the long term change of the organic aerosol load [Legrand et al. , submitted].<br />
Antarctica<br />
a) ESF EPICA related: Sampling dedicated to He-isotope analyses of the bottom Antartic EDML<br />
core could be accomplished at at the deep drilling site, though the very basal layer could not be<br />
sampled due to the surprising occurrence of liquid water at the ice bedrock interface. Mass spectrometric<br />
analyses of these samples and the Antarctic EPICA Dome C He-Profile could be almost<br />
finished by the IUP ’Groundwater and Paleoclimate’ group. They show a significant abundance of<br />
crustal He till some 100 m above bedrock, which is not understood yet, but already seen in our former<br />
He-measurements from the deep Greenland (GRIP) ice core. Ongoing He-analyses will complete the<br />
available profil from the Greenland NGRIP core, thus providing a further profil close to bedrock.<br />
Aimed at the investigation of the air firn transfer of atmospheric aerosol species in Antarctica [Weller<br />
& Wagenbach, submitted] the first comprehensive atmospheric aerosol records could be obtained year<br />
round from an central Antarctic position (in collaboration with AWI). These observation from the<br />
EDM drill site (completing the ongoing recordings at the coastal overwintering station Neumayer)<br />
may now constitute the base for dedicated investigations into the air/firn transfer at the EDML drill<br />
site.<br />
Activities envisaged in the following year<br />
• Englacial temperature profiling of the KCI borehole (jointly with University Zürich)<br />
• Laboratory experiments, simulating the He (Ne) outgassing prosses of glacier ice at various<br />
texture properties.<br />
• Investigation of cave ice in the ’Eisriesenwelt’ aimed at estimating its age and mass balance<br />
• Drilling through Piz Murtel (Engadine) postponed to winter 2006 (jointly with University Zürich<br />
and KUP University Bern)<br />
• Investigation of the dielectric properties of glacier ice with Soil Physics Group and AWI (O.<br />
Eisen)<br />
• Ongoing re-designing of the Air Chemistry Observatory at the Antarctic Neumayer Station III<br />
(with AWI and the Carbon Cycle Group)
3.2. ICE AND CLIMATE 107<br />
Funding<br />
• EU ALP-IMP (Multi-centennial climate variability in the Alps based on instrumental data,<br />
model simulations and proxy data)<br />
• AWI-Cooperation contract (Investigation of ice cores and aerosol of polar regions)<br />
• Austrian Research Fund project of VERA ( 26 Al- 10 Be investigations)<br />
• Austrian Academie project (AUSTRO*ICE*CAVE*2100) jointly with the <strong>Institut</strong> <strong>für</strong> Geologie<br />
und Paläontologie, University of Innsbruck<br />
Important logistical support was obtained from the ESF-EU core project EPICA (European Ice<br />
Drilling in Antarctica)<br />
Major cooperations<br />
• Alfred Wegener <strong>Institut</strong>e for Polar and Marine Research (AWI) (various polar investigations)<br />
• Laboratoire de Glaciologique et Geophisique-CRNS, Grenoble (LGGE) (Alpine ice cores and<br />
Lake Vostok)<br />
• Geographical <strong>Institut</strong>e of the University Zürich (Alpine glaciology and glacio-meteorology)<br />
• Klima und <strong>Umweltphysik</strong>, University Bern (ice core drilling and analyses)<br />
• VERA-laboratory, <strong>Institut</strong> <strong>für</strong> Isotopenforschung und Kernphysik der <strong>Universität</strong> Wien (VERA)<br />
(AMS-analyses)<br />
• <strong>Institut</strong>e for Zoology and Limnology, University Innsbruck (ice biology and high Alpine lake<br />
sediments)<br />
• <strong>Institut</strong> <strong>für</strong> Geologie und Paläontologie, University of Innsbruck (cave ice research)<br />
• ZentralAnstalt <strong>für</strong> Meteorologie und Geodynamik, Vienna (Alpine climatology) (ZAMG)<br />
• British Antarctic Survey, Cambridge (Berkner Island Project)<br />
• <strong>Institut</strong>e for Environmental Geochemistry, University Heidelberg (trace element analyses)<br />
Internal collaborations concern, mainly the Neumayer Observatory, 14 C and radon investigations<br />
(Carbon Cycle Group), noble gas and tritium analyses (Groundwater and Paleoclimate Group), long<br />
term marine 10 Be sediment records (Heidelberger Academy of Sciences) and newly established the<br />
investigation of the dielectric glacier ice properties (Soil Physics Group).<br />
Peer Reviewed Publications<br />
1. Bigler et al. [2006]<br />
2. EPICA Community Members [2006]<br />
3. Piel et al. [2006]<br />
4. Steier et al. [2006]<br />
5. Wolff et al. [2006]<br />
6. Auer et al. [in pressb]<br />
Other Publications<br />
Pettinger et al. [2006]<br />
Diploma Theses<br />
Jahn [2006]
108 CHAPTER 3. TERRESTRIAL SYSTEMS<br />
3.2.1 Radiocarbon measurement in ice<br />
Barbara May (participating scientists: Dietmar Wagenbach and Peter Steier (VERA))<br />
Abstract A sample preparation line for 14 C analysis of organic matter in ice by AMS is under<br />
construction. Preliminary investigations show, that the blank mass should be lower than 10 µgC.<br />
First analyses revealed DOC concentrations in ice of 140 to 560 µgC/kg and POC concentrations in<br />
snow as low as (64 ± 18) µgC/kg.<br />
Figure 3.9: Relative error of the measured 14 C concentration (in pmC) for a sample mass of 100 µgC<br />
and for three different procedure blank masses. Also shown are the corresponding sample ages and<br />
age errors in ka (note the non linear relationship with pmC).<br />
Background While polar glaciers and ice<br />
sheets can be basically dated into the last glacial<br />
by annual layer counting and reference horizons,<br />
these standard dating tools are not applicable to<br />
’exotic’ ice archives, like small mountain glaciers,<br />
cave ice or ice wedges. Thus, to extend the domain<br />
of long term ice records to non-polar regions<br />
and to explore other promising ice archives, 14 Canalysis<br />
of organic matter is expected to be the<br />
only reliable dating tool, provided that the organic<br />
carbon entrapped in glacier bodies is representative<br />
for the deposition age. However the small<br />
and variable carbon mass and the distinction between<br />
different carbon fractions (POC and DOC)<br />
make thorough experimental efforts necessary to<br />
achieve reliable 14 C results.<br />
Method The organic carbon fractions can be<br />
divided into POC (particulate organic carbon)<br />
and DOC (dissolved organic carbon). For the extraction<br />
of these carbon fractions, two set-ups will<br />
be designed:<br />
1. a POC filtration system allowing for an efficient<br />
extraction of large as well as very small<br />
amounts of organic matter from various ice<br />
samples<br />
2. a DOC extraction system, where dissolved<br />
organic matter is converted to CO2 by UVoxidation,<br />
which is then extracted by degassing<br />
Large POC samples will then be combusted in the<br />
CARMEN system in an oxygen stream, smaller<br />
ones in quartz-glass vials with CuO. Designated<br />
analyses have shown, that the CARMEN system<br />
blank for stream combustion can be reduced to<br />
less than (35 ± 10) µgC. All CO2 samples will be<br />
cleaned and quantified in the extraction part of<br />
the CARMEN system, which has a blank of only<br />
a few µgC.<br />
The dating of small ice samples with little carbon<br />
content needs a small blank-to-sample-mass ratio.<br />
As the sample mass is limited and should be kept<br />
as low as possible to obtain a reasonable time resolution,<br />
the procedure blank has to be strongly<br />
minimized to allow reliable radiocarbon dating.<br />
As seen in Figure 3.9 the blank mass should be<br />
less than 10 µgC.<br />
Pilot studies Steier et al. [2006] reports preindustrial<br />
POC concentrations from the ’Grenzgletscher’<br />
between 24 and 370 µgC/kg. Analyses<br />
of two miniature ice caps in the Swiss Alps (Piz<br />
Murtel and Lischana) for DOC and POC revealed,<br />
that DOC concentrations ranged here between<br />
140 µgC/kg for ’clean’ ice and 560 µgC/kg for<br />
strong dust layers. The POC content of the samples<br />
is not determined yet, but a first estimate<br />
gives concentrations for strong dust layers of up<br />
to at least 20 mgC per kg ice. An analysis of snow<br />
from the high Alpine Colle Gnifetti gives a POC<br />
content of less than (64 ± 18) µgC per kg snow.
3.2. ICE AND CLIMATE 109<br />
3.2.2 Climate significance of stable water isotope records from Alpine ice<br />
cores.<br />
Markus Pettinger (participating scientists: Dietmar Wagenbach, Felix Jahn, Susanne Preunkert<br />
(LGGE) and Reinhard Böhm (ZAMG))<br />
Abstract We report on the isotope record obtained from a new ice core drilled in the Monte Rosa region,<br />
backed up by investigations related to the upstream effect. Recent warming trends are addressed<br />
in view of the apparent isotope temperature relationship.<br />
T [°C]<br />
δ 18 O [‰]<br />
δ 18 O [‰]<br />
-11<br />
-12<br />
-13<br />
-14<br />
-15 -8<br />
-10<br />
-12<br />
-14<br />
-16<br />
-8<br />
-10<br />
-12<br />
-14<br />
-16<br />
Annual precipitation Temperatures<br />
KCI ice core<br />
Monte Rosa stacked<br />
2000 1980 1960 1940 1920 1900<br />
Year A.D.<br />
Figure 3.10: δ 18 O - records of the new Monte Rosa<br />
ice core (KCI) compared to a stacked data of three<br />
ice cores from the western flow line and to instrumental<br />
annual time series precipitation weighted<br />
temperature compilations.<br />
Background Isotope δ 18 O and δD records from<br />
high Alpine cold glaciers provide complementary<br />
records to polar cores, including the unique possibility<br />
to extend the 250 years instrumental climate<br />
time series only available for the Greater Alpine<br />
Region [Auer et al. , in pressa]. To minimize the<br />
influence of glaciological ’noise’ on the interpretation<br />
of the isotopic record in terms of temperature<br />
changes there, a multicore study was set up. Also<br />
the evaluation of upstream and local meteorological<br />
effects on the isotope record is mandatory.<br />
Methods and results In autumn 2005 a new<br />
ice core (KCI) from Colle Gnifetti (Monte Rosa<br />
summit region) completing the existing array of<br />
down to bedrock ice cores was recovered and<br />
analysed for its coarse isotope stratigraphy. The<br />
drilling position was carefully determined using<br />
a grid of GPR (Ground Penetrating Radar) mea-<br />
surements [Böhlert, 2005] with respect to minimal<br />
accumulation rate, flat bedrock and well defined<br />
catchment area. The expectedly low accumulation<br />
was confirmed to 14.8 m w.e./a by the tritium<br />
bomb peak horizon, dating of the core was<br />
confirmed according to [Jahn, 2006].<br />
Investigation of the δ 18 O upstream effects along<br />
the KCI - flow line revealed a twofold upstream<br />
increase of the accumulation rate associated with<br />
a systematic isotope shift. This effect is expected<br />
to influence the KCI core section below 20 m w.e.<br />
(i.e. before 1800 A.D.).<br />
In the KCI core, the overall δ 18 O trend in the 20 th<br />
century exhibits a rise of 2.3 � corresponding to a<br />
change in temperature of 1.2 ◦ C. This suggests an<br />
apparent isotope sensitivity of 1.8 �/ ◦ C, much<br />
higher as commonly expected. Also the recent<br />
warming trend from the 80ies to 2004 is recorded<br />
and yields by 2.5 � and 1.4 ◦ C, respectively.<br />
Seasonal isotope data from fresh snow samples<br />
collected at high Alpine locations (Signalkuppe,<br />
Klein Matterhorn and Sonnblick) reveal no peculiarities<br />
in the δ 18 O/δT - relation with respect to<br />
the values found for low level stations of the GNIP<br />
database (about 0.6 �/ ◦ C).<br />
Within the multicore approach the KCI ice core<br />
record appears to be well suited to complement<br />
the instrumental temperature time series regarding<br />
long term climate changes.<br />
Outlook/Future work Improved dating of the<br />
new Monte Rosa ice core (along with a Dôme du<br />
Goûter core from Mont Blanc) over the instrumental<br />
period.<br />
Funding EU-project ALP-IMP (Multicentennial<br />
climate variability in the Alps based on<br />
Instrumental data, Model simulations and Proxy<br />
data)<br />
Main publications [Pettinger et al. , 2006]
110 CHAPTER 3. TERRESTRIAL SYSTEMS<br />
3.2.3 Dissolved organic carbon (DOC) in glaciers: recent temporal changes<br />
and natural levels<br />
Martin Schock (participating scientists: Patrik Heiler, Dietmar Wagenbach, Michel Legrand (LGGE),<br />
Susanne Preunkert (LGGE), Jean-Robert Petit (LGGE))<br />
Abstract Deploying a highly sensitive DOC analysis method on high Alpine ice cores, the recent<br />
changes in the organic aerosol load was investigated.<br />
Figure 3.11: DOC in two Mont Blanc ice cores at sub-seasonal and multi-year time resolution. No data,<br />
except from snow pits, are available from very recent times due to the impossibility to decontaminate<br />
porous firn cores<br />
Background The bulk quantity DOC constitutes<br />
an important part of the impurity content<br />
of non-temperated glaciers. Related retrospective<br />
studies would be highly relevant therefore in terms<br />
of radiative forcing, past atmospheric carbon cycles<br />
and englacial microbial activity. However, no<br />
systematic ice core analyses of DOC were available,<br />
yet, due to unsolved contamination problems<br />
and the insufficient sensitivity of conventional<br />
analysers.<br />
Methods and results Based on UV induced<br />
DOC oxidation, a continuous, sub-seasonal DOC<br />
ice core record could be established from Col du<br />
Dome back into the pre-industrial era, and supplemented<br />
by results of various organic species (obtained<br />
within CARBOSOL) from proximate and<br />
distal Alpine cores. Thereby the 2-4 fold overall<br />
increase of DOC is found to be much lower<br />
than those of black carbon or sulphate. Also different<br />
to these species is the DOC change, which<br />
is not entirely related to radiatively active particles<br />
and cannot not exclusively attributed to anthropogenic<br />
emissions. However, comparison with<br />
other carbonaceous components (carboxylic acids,<br />
HULIS, etc.) suggest that ice core DOC may be<br />
eventually used as proxy for the secondary organic<br />
aerosol load. This fraction produced from, mainly<br />
biogenic, gaseous precursors may have been indirectly<br />
increased through anthropogenic change of<br />
the atmospheric oxidative capacity.<br />
In addition, ongoing DOC analyses of accreted ice<br />
from Lake Vostok (Antarctica) confirmed previous<br />
results, suggesting a DOC level in the range<br />
of some ng/g, which would strongly limit viable<br />
micro biological activities within the lake. To corroborate<br />
this finding, the efficiencies of UV versus<br />
high temperature based DOC oxidation methods<br />
were thoroughly compared using high Alpine<br />
lake ice, providing, however, conflicting results of<br />
higher UV based yields.<br />
Outlook/Future work Quantification of the<br />
UV oxidation yield and recent DOC trends in<br />
Greenland ice cores.<br />
Funding EU CARBOSOL project: ’Present<br />
and Retrospective State of Organic versus Inorganic<br />
Aerosol over Europe : Implications for Climate’<br />
Main publications Legrand et al. [submitted]
3.2. ICE AND CLIMATE 111<br />
3.2.4 Progress in developing novel tools for Antarctic ice core research<br />
Dietmar Wagenbach (participating scientists: Rolf Weller (AWI) and Matthias Auer (VERA))<br />
Abstract Progress achieved in automatic central Antarctica aerosol sampling and in the prospecting<br />
of the 26 Al/ 10 Be dating tool are reported and assessed.<br />
Figure 3.12: Seasonal cycle of total nitrate in central Antarctica obtained by automatic aerosol samplings<br />
(left), overall changes of mean 26 Al/ 10 Be ratios seen in Antarctic (Neumayer), alpine (Sonnblick)<br />
and upper troposphere aerosol as well as in Antarctic snow from Dome C (right).<br />
Background See also Annual IUP Report 2005.<br />
a) Automatic sampling: Interpretation of Antarctic<br />
ice core records of aerosol species needs considering<br />
year round atmospheric records, which<br />
were not available however from inland positions.<br />
Therefore IUP developed an autonomous aerosol<br />
sampling device (ROBERTA) to be deployed year<br />
round at the EPICA-DML drill site in the Atlantic<br />
sector of east Antarctica.<br />
b) 26 Al: Also the essentially unknown age and<br />
stratigraphical feature of the basal core sections<br />
challenge experimental dating tools to be deployed<br />
here. In close collaboration with the University<br />
of Vienna the dating deficit of very old ice<br />
samples has been tackled therefore by exploring<br />
the feasibility of the 26 Al/ 10 Be ratio (apparent<br />
T 1/2 = 1.310 −6 a) as a radiometric chronometer.<br />
Progress report<br />
a) Deploying an improved sampler version, year<br />
round, unattended running of the aerosol sampling<br />
system at the EDML drill site could be successfully<br />
maintained in 2005, indicating, that the<br />
polar night energy problem became almost settled.<br />
Evaluation of the first comprehensive observations<br />
on the seasonal change of major ion<br />
revealed, relative to coastal records: important<br />
phase shifts of species with marine sources, but<br />
a close agreement of nitrate cycles [Weller & Wagenbach,<br />
submitted]. This surprising coherence<br />
may need revisiting the open question of the major<br />
Antarctic nitrate source.<br />
b) In extending our former 26 Al/ 10 Be analyses<br />
to Antarctic surface snow and high tropospheric<br />
samples and in gaining first 53 Mn results from<br />
Antarctic aerosol we got following evidences for<br />
the 26 Al dating potential: (1) the overall (short<br />
term) 26 Al / 10 Be variability in various recent<br />
snow aerosol samples is less than 6 %. This figure<br />
would translate into a dating uncertainty of<br />
around 100 ky, indicating as well a negligible influence<br />
of terrestical 26 Al. (2) interplanetary dust<br />
(IPD) appears to contribute to the atmospheric<br />
26 Al budget of Antarctica by some % only. This<br />
results is, however, still to be confirmed by respective<br />
firn analyses, needing to process some 100kg<br />
of surface snow.<br />
Future work<br />
a) Adding results from ongoing 2006 samplings,<br />
glacio-meteorological and snow pit data, the<br />
source pattern and governing air/firn deposition<br />
processes will be elucidated for the DML drill site<br />
realm.<br />
b) Backed up by surface snow 53 Mn first<br />
26 Al/ 10 Be analyses are envisaged for the basal section<br />
of Antarctic ice cores, perhaps including some<br />
Ma old ground ice from the Dry Valleys.<br />
Funding<br />
a) AWI-Cooperation Contract<br />
b) joint Austrian Research Fund (FWF) project<br />
among VERA and IUP<br />
Main publications a) [Weller & Wagenbach,<br />
submitted], b) [Auer et al. , in pressb]
112 CHAPTER 3. TERRESTRIAL SYSTEMS<br />
References<br />
Auer, I., Böhm, R., Jurkovic, A., Lipa, W., Orlik, A., Potzmann, R., Schöner, W., Ungersböck, M.,<br />
Matulla, C., Brunetti, M., Nanni, T., Maugeri, M., Mercalli, L., Briffa, K., Jones, P., Efthymiadis,<br />
D., Mestre, O., Moisselin, J.M., Begert, M., Müller-Westermeier, G., Kveton, V., Bochnicek, O.,<br />
Stastny, P., Lapin, M., Nieplova, E., Cegnar, T., Dolinar, M., Gajic-Capka, M., Zaninovic, K., Majstorovic,<br />
Z., Szalai, S., & Szentimrey, T. in pressa. HISTALP Historical instrumental climatological<br />
surface time series of the Greater Alpine Region. International Journal of Climatology.<br />
Auer, M., Kutschera, W., Priller, A., Wagenbach, D., Wallner, A., & Wild, E. M. in pressb. Atmospheric<br />
26 Al and 10 Be as a dating tool for climate archives. Nuclear Instruments and Methods<br />
B.<br />
Bigler, M., Rthlisberger, R., Lambert, F., Stocker, T.F., & Wagenbach, D. 2006. Aerosol deposited<br />
in East Antarctica over the last glacial cycle: Detailed apportionment of continental and sea-salt<br />
contributions. Journal of Geophysical Research, 111, (8)(D08205).<br />
Böhlert, R. 2005. Diplomarbeit, <strong>Institut</strong> <strong>für</strong> Geographie, <strong>Universität</strong> Zürich.<br />
Eisen, O., Nixdorf, U., Keck, L., & Wagenbach, D. 2003. Alpine Ice Cores and Ground Penetrating<br />
Radar: Combined Investigations for Glaciological and Climatic Interpretations of a Cold Alpine Ice<br />
Body. Tellus, 55B (5), 1007–1017.<br />
EPICA Community Members. 2006. One-to-one coupling of glacial climate variability in Greenland<br />
and Antarctica. Nature, 444(195).<br />
Friedrich, R. 2003. Helium in polaren Eisschilden. Diplomarbeit, Instiut <strong>für</strong> <strong>Umweltphysik</strong>, <strong>Universität</strong><br />
Heidelberg.<br />
Hammer, S., Wagenbach, D., Preunkert, S., Pio, C., Schlosser, C., & Meinhardt, F. submitted. 210 Pb<br />
observations within CARBOSOL: a diagnostic tool for assessing the spatio-temporal variability of<br />
related chemical aerosol species. Journal of Geophysical Research.<br />
Jahn, F. 2006. Einsatz der Continous Flow Analysis zur vorläufigen Datierung eines alpinen Eiskerns.<br />
diploma thesis, <strong>Universität</strong> Heidelberg.<br />
Legrand, M., Preunkert, S., Schock, M., Cerqueira, M., Kasper-Giebl, A., Alfonso, J., Pio, C., Gelencser,<br />
A., Etchevers, I., & Simpson, D. submitted. Major 20th century changes of organic aerosol<br />
components (BC, WinOC, DOC, HULIS, mono and dicarboxylic acids and cellulose) derived from<br />
Alpine ice cores. Journal of Geophysical Research.<br />
Pettinger, M., Jahn, F., Wagenbach, D., Bhlert, R., Hoelzle, M., & Preunkert, S. 2006. Climate<br />
significance of stable water isotope records from Alpine ice cores. Geophysical Research Abstracts,<br />
Vol. 8, 09854. Poster.<br />
Piel, C., Weller, R., M.Huke, & Wagenbach, D. 2006. Atmospheric methane sulfonate and non-sea<br />
salt sulfate records at the EPICA deep-drilling site in Dronning Maud Land. Journal of Geophysical<br />
Research.<br />
Preunkert, S., & Wagenbach, D. 1998. An automatic recorder for air/firn transfer studies of chemical<br />
aerosol species at remote glacier sites. Atmospheric Environment, 23, 4021–4030(10).<br />
Preunkert, S., Wagenbach, D., Legrand, M., & Vincent, C. 2000. Col du Dome (Mont Blanc Massif,<br />
French Alps) suitability for ice core studies in relation with past atmospheric chemistry over Europe.<br />
Tellus, 52B (3), 993–1012.<br />
Ruth, U., Wagenbach, D., Steffensen, J.P., & Bigler, M. 2003. Continuous record of microparticle<br />
concentration and size distribution in the central Greenland NGRIP ice core during the last glacial<br />
period. Journal of Geophysical Research, 108 (D3)(10.1029/2002JD002376).<br />
Steier, P., Drosg, R., Fedi, M., Kutschera, W., Schock, M., Wagenbach, D., & Wild, E.M. 2006.<br />
Radiocarbon determination of particulated organic carbon in non-temperated, alpine glacier ice.<br />
Radiocarbon, 48(1), 69–82.<br />
Wagenbach, D., Ducroz, F., Mulvaney, R., Keck, L., Minikin, A., Legrand, M., Hall, J. S., & Wolff,<br />
E. W. 1998. Sea-salt aerosol in coastal Antarctic regions. Journal of Geophysical Research, 103<br />
(D9)(10.1029/97JD01804), 10961–10974.
3.2. ICE AND CLIMATE 113<br />
Weller, R., & Wagenbach, D. submitted. Year round chemical aerosol records in continental Antarctica<br />
obtained by automatic samplings. Tellus.<br />
Wolff, E.W., Fischer, H., Fundel, F., Ruth, U., Twarloh, B., Littot, G.C., Mulvaney, R., Röthlisberger,<br />
R., De Angelis, M., Boutron, C.F., Hansson, M., Jonsell, U., Hutterli, M.A., Lambert, F., Kaufmann,<br />
P., Stauffer, B., Stocker, T.F., Steffensen, J.P., Bigler, M., Siggaard-Andersen, M.L., Udisti,<br />
R., Becagli, S., Castellano, E., Severi, M., Wagenbach, D., Barbante, C., Gabrielli, P., & Gaspari,<br />
V. 2006. Southern Ocean sea-ice extent, productivity and iron flux over the past eight glacial cycles.<br />
Nature, 440(7083), 491–496.
Aquatic Systems<br />
4.1 Groundwater and Paleoclimate . . . . . . . . . . . . . . . . . . . . . . . . 118<br />
4.2 Lake Research (Limnophysics) . . . . . . . . . . . . . . . . . . . . . . . . 131<br />
115
Overview<br />
Werner Aeschbach-Hertig<br />
Summary<br />
Research on aquatic systems at the IUP focusses mainly on freshwater environments, such as lakes and<br />
groundwater, but also includes some special topics of marine systems, for example the geochemistry<br />
of the deep brines in the Red Sea. A major motivation to investigate freshwater systems stems from<br />
their fundamental importance as water resources, an issue that gains increasing importance in view of<br />
the ever larger stress that human exploitation and interference exerts on these vital reserves. Another<br />
increasingly important issue is the impact of climate change on the quantity, quality, and distribution<br />
of water resources. These problems are particularly crucial for the arid and semi-arid parts of the<br />
world, where we are therefore especially active.<br />
Groundwaters also constitute an archive of past climate conditions, which we exploit by application of<br />
the noble gas thermometer, stable isotopes, and radiocarbon dating. We also aim at extending these<br />
methods of paleoclimate reconstruction from stored meteoric water of the past to new archives, in<br />
particular the microscopic water inclusions in speleothems. In the most important archive of old water<br />
- the polar ice sheets - the noble gas thermometer cannot be used, but noble gases in air inclusions in<br />
the ice provide a potential source of information that hardly has been tapped so far.<br />
The research in the aquatic systems division of the IUP may thus be divided in two main areas:<br />
Physics of freshwater systems and paleoclimate reconstruction. The fundamental goal of the research<br />
on aquatic systems is to obtain a better understanding of the physical processes that transport water,<br />
energy, and dissolved substances within and between these systems. To this end we employ direct<br />
measurements of physical parameters as wells as tracer and isotope methods. Examples of studied<br />
processes are vertical turbulent mixing in stratified lakes, groundwater - lake exchange, and recharge<br />
and flow rates in aquifers. The final goal of the paleoclimatic work is to obtain a quantitative knowledge<br />
of the size and timing of past temperature change, in order to compare with recent trends and<br />
help improving predictions for the future. At present we focus on the refinement of the noble gas<br />
thermometer by improving our understanding of gas partitioning in groundwater and on the extension<br />
of the method to new archives. Further details on this research can be found below in the reports of<br />
the research groups in aquatic systems: ”Groundwater and Paleoclimate” and ”Limnophysics”.<br />
Future work<br />
After a first period of establishing itself, the aquatic systems division of the IUP is now expanding in<br />
a variety of new ventures. Having established a modern noble gas lab, new applications are currently<br />
starting up. Furthermore, new collaborations within the institute and the physics faculty in Heidelberg<br />
are being pursued. In addition to the ongoing projects described in the individual reports below, the<br />
most important perspectives for future projects are the following:<br />
1. The potential of radon for studying groundwater-lake exchange is to be investigated more comprehensively<br />
(DFG-proposal submitted).<br />
2. A new groundwater project in India in collaboration with Dr. S.K. Gupta, Phyiscal Research<br />
Laboratory, Ahmedabad is planned. A DFG-proposal will soon be submitted.<br />
3. ATTA (atom trap trace analysis), a new method for ultra-sensitive detection of rare radioisotopes,<br />
is being developped in collaboration with M. Oberthaler, KIP, Heidelberg<br />
4. He and other noble gases in ice are investigated in collaboration with the ice group, IUP.<br />
117
118 CHAPTER 4. AQUATIC SYSTEMS<br />
4.1 Groundwater and Paleoclimate<br />
Werner Aeschbach-Hertig<br />
Names of group members<br />
Prof. Werner Aeschbach-Hertig, head of group<br />
Dr. Reinhold Bayer, administration<br />
Dr. Laszlo Palcsu, postdoc<br />
Dipl. Ing. Gerhard Zimmek, technician<br />
Dipl. Phys. Ronny Friedrich, PhD-student<br />
Dipl. Phys. Andreas Kreuzer, PhD-student<br />
Dipl. Phys. Tobias Kluge, PhD-student<br />
Martin Wieser, diploma student<br />
Matthias Kopf, diploma student<br />
Esther Beyersdorff, diploma student<br />
Abstract<br />
The research group ”Groundwater and Paleoclimate” employs a variety of environmental tracers, in<br />
particular noble gases, in order to study physical processes in groundwater and other environmental<br />
systems (e.g. lakes, ocean, and ice) as well as to reconstruct paleoclimate conditions recorded in old<br />
groundwater and other archives (e.g. speleothems).<br />
recharge<br />
equilibration<br />
excess air formation<br />
3 H decay<br />
climate information<br />
2 H, 18 O<br />
noble gases<br />
222 Rn ingrowth<br />
flow<br />
equilibration<br />
exchange<br />
dispersion<br />
mixing<br />
14 C decay<br />
He flux<br />
time information<br />
CFCs, SF 6 , 3 H<br />
degassing<br />
sampling<br />
Figure 4.1: Schematic representation of the various tracers and processes studied in groundwater<br />
Background<br />
Climate change and the limited availability of water resources are interrelated issues of central scientific<br />
and societal importance. Isotopic studies of groundwaters can address both issues by providing<br />
information on i) past climatic conditions such as temperature or aridity and ii) physical parameters<br />
such as residence time or recharge rate. Isotope and tracer techniques have played a central role in<br />
the development of environmental physics, as methods from nuclear physics came to be applied to<br />
problems of Earth and environmental science. Methods such as the use of stable isotopes in water as<br />
climate proxies or the use of tritium and radiocarbon for dating of groundwater are now well established.<br />
In addition to these methods, we employ dissolved noble gases in groundwater, which proved<br />
to constitute a reliable paleotemperature proxy. Furthermore, He isotopes and other transient gas<br />
tracers are important tools in groundwater dating. Yet, our interest is not limited to the application
4.1. GROUNDWATER AND PALEOCLIMATE 119<br />
of these established methods, but includes the development of new analytical techniques to broaden<br />
the range of tracers and archives in which they can be applied.<br />
Main methods<br />
The central facility of the group is a new mass spectrometric system for the analysis of noble gases<br />
from water and gas samples. The system is used for measurements of all stable noble gases from<br />
groundwater samples for studies of excess air and noble gas paleotemperatures. The system also<br />
allows the analysis of He isotopes for 3 H- 3 He dating. Moreover, experimental procedures for the<br />
extraction and analysis of noble gases from much smaller samples of fluid inclusions in speleothems<br />
have been established successfully. This shows that the system is capable of handling samples with<br />
noble gas contents varying over many orders of magnitude. The noble gas facility is complemented<br />
by a radiometric 3 H lab. A mobile device for 222 Rn detection and a gas chromatographic system for<br />
SF6 analyses are operated together with the limnophysics group. In addition we collaborate with the<br />
stable isotope and 14 C laboratories of the institute for the respective analyses on water samples.<br />
Projects and their links<br />
Projects of the group are related either to questions of water resources or paleoclimate, or both.<br />
Some projects are mainly applications of established methods, whereas others intend to develop new<br />
methods and approaches. The DFG-funded project ”Groundwater China” is now in its final year. The<br />
main goal to derive a noble gas paleotemperature record for East Asia has been achieved, although<br />
the interpretation of the noble gas, stable isotope, and radiocarbon data remains complex (see report<br />
of A. Kreuzer, section 4.1.1). Preliminary results of this study have been published in the framework<br />
of the IAEA isotope hydrology series (Kreuzer et al., 2006).<br />
The second aspect of the China project was to use the dating tools for young groundwater in order<br />
to determine groundwater fluxes in the recharge area. An understanding of groundwater recharge is<br />
of vital importance in the North China Plain, where piezometric levels have dramatically declined<br />
in the past decades due to abstraction for irrigation. Our results show that 3 H- 3 He ages provide a<br />
reasonable estimate of recharge rates, indicating ehanced recharge by irrigation return flow, whereas<br />
the SF6 method is hampered by a not yet fully explained but apparently natural background (see<br />
report of C. von Rohden, section 4.1.2). The determination of recharge and mixing rates is also<br />
central to the project ”Groundwater Odenwald”, funded by the German State of Hessia, which also is<br />
in its final phase. As in China, the 3 H- 3 He method works well and enables identification of zones of<br />
young, old, and mixed groundwater, whereas the SF6 method is severly affected by natural sources.<br />
Intriguing correlations of the SF6 background with the lithologies of the study area and with 4 He and<br />
222 Rn contents of the groundwater have been found (see report of R. Friedrich, section 4.1.3).<br />
In the framework of the new DFG research unit ”daphne” (see also section 6.1, Heidelberger Akademie<br />
der Wissenschaften), a project has been started that investigates the possibility to derive paleotemperature<br />
information from noble gases dissolved in microscopic water inclusions in speleothems. The<br />
first achievements of this project are the establishment of precise methods for the determination of the<br />
extracted water amounts and the analysis of the extracted noble gases. Results from the test samples<br />
analysed so far have clearly shown that a reduction of the air-derived noble gas component will be<br />
crucial for the success of the method (see report of T. Kluge, section 4.1.4).<br />
Several current projects deal with issues related to gas partitioning between groundwater and entrapped<br />
gas, including the observed phenomena of excess air and degassing. A comparatively comprehensive<br />
theoretical description of these phenomena and their effects on the dissolved noble gases<br />
in groundwater has recently been developed (see report of W. Aeschbach-Hertig, section 4.1.5).<br />
A more detailed and quantitative understanding of the formation of excess air in groundwater is a<br />
major goal of the EU-funded project ”‘ADNOGAPALIN”’, conducted by the Marie Curie fellow L.<br />
Palcsu. Major steps towards a quantitative analysis of the factors that influence excess air amount<br />
and composition have been taken by a recent field experiment and by the initiation of laboratory<br />
experiments using sand columns (see report of L. Palcsu, section 4.1.6).<br />
The field experiment on excess air formation took place at an artifical recharge site near Basel, where<br />
parts of an alluvial plain are periodically flooded by Rhine water to replenish the groundwater. The<br />
combined application of several tracers (noble gases, stable isotopes, radon) and monitoring of physical<br />
parameters (water level, temperature, conductivity) enabled us to trace the infiltration of the surface<br />
water and its mixing with the regional groundwater, as well as the rapid increase of the excess air<br />
component during this process (see report of M. Kopf, section 4.1.7).<br />
High levels of excess air or other dissolved gases can lead to degassing of groundwater during sampling.<br />
The traditional way of sampling with copper tubes may be inadequate in such cases. We have adapted<br />
and tested an alternative sampling technique with passive diffusion samplers, i.e. small gas volumes
120 CHAPTER 4. AQUATIC SYSTEMS<br />
in a silicon tube that are equilibrated with groundwater in situ before being sealed and analysed. It<br />
could be shown that results obtained by this method agree with copper tube samples under normal<br />
conditions. A variety of aspects of the method, such as the equilibration time for different noble gases<br />
and silicon tubes, have been investigated (see report of M. Wieser, section 4.1.8).<br />
External Collaborations<br />
<strong>Institut</strong>e of Hydrogeology and Environmental Geology, Chinese academy of geological sciences, Zhengding,<br />
China, Prof. Z. Chen (IHEG).<br />
Physical Research Laboratory, Ahmedabad, India, Dr. S.K. Gupta (PRL).<br />
Oxford Centre for Water Research, Oxford University, United Kindom, Prof. M. Edmunds (OCWR).<br />
Hessisches Landesamt <strong>für</strong> Umwelt und Geologie, Wiesbaden, Germany, Dr. B. Leßmann (HLUG).<br />
<strong>Institut</strong>e of Isotope geochemistry and mineral resources, ETH Zürich, Switzerland, Prof. R. Wieler,<br />
Dr. R. Kipfer (IGMR).<br />
AMS Radiocarbon Dating Lab, ETH Zürich, Switzerland, Dr. I. Hajdas (AMS).<br />
Climate and Environmental Physics, University of Bern, Switzerland, Dr. Roland Purtschert (KUP).<br />
Applied and Environmental Geology, University of Basel, Switzerland, Dr. E. Zechner, Prof. P.<br />
Huggenberger (UBA)<br />
UFZ Leipzig-Halle, Isotope Hydrology, Dr. Stefan Weise, Dr. Karsten Osenbrück (UFZ).<br />
Matter Wave Optics, Kirchhoff <strong>Institut</strong>e for Physics, Prof. Markus Oberthaler (KIP).<br />
Funding<br />
The China project and the speleothem project are funded by the DFG, the Odenwald project is<br />
funded by a contract with the Hessian authorities. Laszlo Palcsu is funded by the EU (Marie Curie<br />
fellowship).<br />
Publications<br />
Peer reviewed<br />
1. Aeschbach-Hertig et al. [2007]<br />
2. Edmunds et al. [2006]<br />
3. Aeschbach-Hertig [2006e]<br />
Other publications<br />
1. Kreuzer et al. [2006]<br />
Diploma theses<br />
1. Wieser [2006]<br />
Invited talks<br />
1. Aeschbach-Hertig [2006a]<br />
2. Aeschbach-Hertig [2006d]<br />
3. Aeschbach-Hertig [2006c]<br />
4. Aeschbach-Hertig [2006f]<br />
5. Aeschbach-Hertig [2006b]
4.1. GROUNDWATER AND PALEOCLIMATE 121<br />
4.1.1 A tracer study of paleoclimate and groundwater recharge in the<br />
North China Plain<br />
Andreas M. Kreuzer (participating scientists: Christoph von Rohden, Werner Aeschbach-Hertig,<br />
Chen Zongyu (IHEG), Rolf Kipfer (IGMR), Irka Hajdas (AMS))<br />
Abstract Noble gas temperatures (NGTs), stable isotope ratios and 14 C-ages from old groundwater<br />
in the North China Plain (NCP) are used to reconstruct a paleoclimate record. This is the first NGT<br />
record from East Asia. Preliminary results indicate a glacial cooling of about 5 ◦ C .<br />
19<br />
18<br />
17<br />
16<br />
15<br />
14<br />
13<br />
12<br />
11<br />
10<br />
9<br />
8<br />
7<br />
53<br />
32<br />
33<br />
31<br />
44 52<br />
43<br />
39<br />
48 49<br />
50<br />
40<br />
45<br />
10<br />
41<br />
46<br />
36<br />
10 20 30 40 50 10000 20000 30000 40000<br />
47<br />
15<br />
11<br />
12<br />
19 14<br />
37<br />
38<br />
9<br />
20<br />
18<br />
17<br />
Age (yrs)<br />
Figure 4.2: The figure shows the noble gas temperatures for the samples from 2004 and 2005. The<br />
warm temperatures of about 14 ◦ C in the modern samples correspond to the local annual air temperatures,<br />
while there are still some outliers. The coldest late pleistocene samples have a temperature of<br />
about 9 ◦ C which would indicate a 5 K cooling for the NCP during last glacial. Dating was done with<br />
3 H- 3 He for modern samples and with 14 C for paleosamples.<br />
Background Noble Gas concentrations in water<br />
vary with temperature as the solubilities are<br />
temperature dependent. Measurements of noble<br />
gases in paleo-groundwater can therefore be used<br />
to calculate paleo recharge temperatures. The importance<br />
of this method lies in reliable determination<br />
of glacial-interglacial temperature differences.<br />
The age of the groundwater in the NCP reaches<br />
from very young water to 35 kyr old water in the<br />
deeper parts of the aquifers.<br />
The goal of this study is to complement isotope<br />
data from this aquifer system with NGTs in order<br />
to quantify the climatic signal of the transition<br />
from the last glacial maximum (LGM) to the<br />
holocene.<br />
Methods and results Data from two sampling<br />
campaigns reflect a clear temperature signal between<br />
the modern- and the paleosamples as shown<br />
in the figure. In the modern group, a few outliers<br />
are thought to be due to local effects of groundwa-<br />
ter recharge, while the outliers in the paleogroup<br />
are mainly referred to mixing processes and different<br />
groundwater flow regimes.<br />
The observed difference in temperature is used to<br />
calibrate the δ 18 O-thermometer. The new value<br />
for the long-term slope between temperature and<br />
δ 18 O from modern to paleogroundwater is calculated<br />
to be 0.6 ±0.15�/ ◦ C .<br />
Outlook/Future work The main interpretation<br />
is finished by the end of this year and will be<br />
published in a PhD-thesis. It is planned to present<br />
the results at international conferences and publications<br />
are in preparation.<br />
Funding This work is financially supported by<br />
the DFG (DFG grant AE 93/1) and by the<br />
National Natural Science Foundation of China<br />
(NSFC grant No. 40472125)<br />
Main publication Kreuzer et al. [2006]
122 CHAPTER 4. AQUATIC SYSTEMS<br />
4.1.2 Dating young groundwater in the North China Plain<br />
Christoph von Rohden (participating scientists: Andreas Kreuzer, Werner Aeschbach-Hertig, Chen<br />
Zongyu (IHEG), Rolf Kipfer (IGMR))<br />
Abstract A large aquifer system in the alluvial North China Plain was sampled for groundwater<br />
along a transect. One of the sampling campaigns was intended to extract information about the<br />
recharge and the residence times of young groundwaters. The SF6– and 3 H- 3 He dating techniques<br />
were used, and the applicability of SF6 as dating tool was investigated.<br />
SF 6 -conc [fmol/l]<br />
3 H-conc. [TU]<br />
3.0<br />
2.5 (12°C)<br />
2.0<br />
1.5<br />
1.0<br />
0.5<br />
25<br />
20<br />
15<br />
10<br />
5<br />
0<br />
0 10 20 30 40 50 60 70 80 90 100 110<br />
distance [km]<br />
20<br />
15<br />
10<br />
5<br />
SF 6 -age [yr]<br />
equality<br />
0<br />
0 5 10 15 20 25 30 35<br />
3 3<br />
H- He-age [yr]<br />
Figure 4.3: Left panel: SF6-concentrations along sampling transect. The dashed grey line indicates<br />
the equilibrium concentration with recent atmosphere at 12 ◦ C (top). Bottom: 3 H-concentrations. A<br />
clear transition from young post-bomb to older waters can be identified. Red symbols denote samples,<br />
which should not contain SF6 due to the lack of 3 H (≥50 y). The large scatter and the level<br />
SF6-concentrations, particularly in 3 H-free samples, imply natural (terrigenic) sources of SF6. Right<br />
panel: Comparison of calculated apparent 3 H- 3 He– and SF6-ages. SF6-ages are clearly underestimated,<br />
strongly limiting the use of SF6 as dating method.<br />
Background Groundwater is the dominant water<br />
source for municipal, urban and agricultural<br />
use in the densely populated region (≈200 Mio<br />
people) of the North China Plain (NCP). Concerning<br />
a sustainable management, the growing<br />
water demand in this semiarid region becomes<br />
more and more problematic. Quantitative age information<br />
of young groundwater in the recharge<br />
area is crucial in this context.<br />
Methods and results Besides the well established<br />
3 H- 3 He-method, that in general gives reliable<br />
results, we tested the use of SF6 as dating<br />
tool. Both methods draw on the variable atmospheric<br />
input to the hydrosphere within the last<br />
≈40 years. The sampling took place from the Taihang<br />
mountains in the west near Shijiazhuang to<br />
the centre of the NCP.<br />
The results suggest that the unconfined (upper)<br />
aquifer is — at least in parts — recently<br />
recharged. However, the model ages calculated<br />
from the SF6-measurements are to a large extent<br />
not consistent with the 3 H- 3 He ages. Many SF6samples<br />
have a distinct excess, most prominently<br />
in samples without tritium. Natural sources of<br />
SF6 must be discussed as explanation, which is<br />
uncommon for fluvial or alluvial deposits. The<br />
applicability of SF6 as — at least exclusive — dating<br />
tool for young groundwater in this region must<br />
therefore be put into question.<br />
Based on the reliable 3 H- 3 He data we interpret the<br />
distribution of the apparent tracer ages against<br />
the background of extensive irrigation to be a result<br />
of the recharge possibly influenced by strong<br />
groundwater use (depression cones) in the urban<br />
area of Shijiazhuang.<br />
Funding The work was supported by the German<br />
Research Foundation (DFG).<br />
Main publication The study was presented at<br />
the IAH conference in Beijing (von Rohden et al.<br />
[2006]) and is in preparation for publication.
4.1. GROUNDWATER AND PALEOCLIMATE 123<br />
4.1.3 A multi tracer study to investigate the groundwater in the Odenwald<br />
region<br />
Ronny Friedrich (participating scientists: Werner Aeschbach-Hertig, Bernhard Leßmann (HLUG),<br />
Guido Vero (HLUG), Rolf Kipfer (IGMR))<br />
Abstract Three sampling campaigns where performed during 2003, 2004 and 2005 in the Odenwald<br />
region (Germany). This multi tracer study (noble gases, 3 H, δ 18 O, δ 2 H, SF6, 222 Rn) investigates the<br />
age structure, mixing ratios and recharge areas of the groundwater in this region.<br />
S F 6 a g e [y r b . 2 0 0 5 ]<br />
4 0<br />
3 5<br />
3 0<br />
2 5<br />
2 0<br />
1 5<br />
1 0<br />
5<br />
0<br />
0 5 1 0 1 5 2 0 2 5 3 0 3 5 4 0<br />
3 H / 3 H e a g e [y r b . 2 0 0 5 ]<br />
c ry s t.<br />
re e d<br />
s a n d s t.<br />
H S d e p r.<br />
Figure 4.4: Comparison of ages obtained by SF6 and 3 H- 3 He of samples from 2005. Different symbols<br />
reflect geological origin (⊙ = crystalline rocktype, ⋄ = Hessian reed, ∆ = sandstone rocktype, ∇ =<br />
Hanau-Seeligenstaedter depression). Arrows indicate ages older than 40 years. Samples above the<br />
1:1 line indicate mixing between old (tracer free) and young (tracer bearing) groundwater. Samples<br />
below 1:1 line could be influenced by natural SF6. Especially samples from the crystalline part are<br />
influenced.<br />
Background The mountainous Odenwald region<br />
in the federal state of Hessia (Germany) is<br />
one of the main local recharge areas for groundwater<br />
of the surrounding depressions, where substantial<br />
extraction for public water supply takes<br />
place. Therefore we investigate the groundwater<br />
in the Odenwald to study residence times and mixing<br />
ratios, define regions of groundwater recharge<br />
and understand the groundwater inflow from the<br />
Odenwald to the surrounding areas.<br />
Methods and results This study includes different<br />
stable and radioactive gas and isotope tracers<br />
such as 2 H, 18 O, 3 H, noble gases, 222 Rn and<br />
SF6 . Based on the stable isotope data it is possible<br />
to distinguish between groundwater from different<br />
areas of the Odenwald. This will help us to<br />
define source regions for the groundwater in the<br />
surrounding areas. Additionally the isotopic signatures<br />
show that the groundwater was formed<br />
by ”annual” precipitation and not only in winteror<br />
summertime. Noble gases (He, Ne, Ar, Kr,<br />
Xe) can be used in principle to calculate recharge<br />
temperatures or the infiltration altitudes (above<br />
sea level) of recharge areas. Furthermore noble<br />
gases give important information to correct other<br />
gas tracers for so called ”excess air” that oversaturates<br />
gases in groundwater (see Kipfer et al.<br />
[2002] for a review of the methods). Comparing<br />
the results of the two independent dating methods<br />
- SF6 and 3 H- 3 He - we found that dating with<br />
SF6 is not possible in the crystalline region of the<br />
Odenwald. The results indicate that SF6 is influenced<br />
by a natural source in the subsurface that<br />
varies with lithology (see Busenberg & Plummer<br />
[2000]). 222 Rn and radiogenic 4 He data from part<br />
of the wells seem to be related to the natural SF6,<br />
consistent with the idea of radiochemical SF6 production<br />
in rocks supported by radiochemical reactions.<br />
Data from the 3 H- 3 He method give robust<br />
groundwater ages in the range of some years to<br />
values higher than 40 years. Furthermore, regions<br />
where mixing of old and young groundwater occurred<br />
can be distinguished.<br />
Outlook/Future work Data analysis is still in<br />
progress. Comparing tracer results with hydrogeological<br />
and hydrochemical data should lead to a<br />
better system description.<br />
Funding This work is done in cooperation with<br />
the ”Hessisches Landesamt <strong>für</strong> Umwelt und Geologie”<br />
Wiesbaden.<br />
Main publication Friedrich et al. [2006]
124 CHAPTER 4. AQUATIC SYSTEMS<br />
4.1.4 Noble gas measurements on fluid inclusions in speleothems<br />
Tobias Kluge (participating scientists: Werner Aeschbach-Hertig)<br />
Abstract Dissolved atmospheric noble gases in groundwater constitute a reliable paleothermometer,<br />
based on their precisely known temperature-dependent solubilities. This archive is limited due to the<br />
dispersive mixing and dating problems. In contrast, speleothems can be well dated using uraniumthorium<br />
dating. However there is no paleothermometer comparable to the noble gas thermometer so<br />
far. The idea of this project is to combine the advantages of both archives.<br />
Xe (ccSTP/g)<br />
1.2x10 -7<br />
8.0x10 -8<br />
4.0x10 -8<br />
aew<br />
0.0 1.0x10 -5<br />
0.0<br />
2.0x10 -5<br />
Ne (ccSTP/g)<br />
Kr (ccSTP/g)<br />
3.0x10 -5<br />
1.6x10 -6<br />
1.2x10 -6<br />
8.0x10 -7<br />
4.0x10 -7<br />
aew<br />
0.0 4.0x10 -3<br />
0.0<br />
8.0x10 -3<br />
Ar (ccsTP/g)<br />
Figure 4.5: Noble gas concentrations for the elements Ne, Ar, Kr and Xe, calculated for stalagmite<br />
samples in a first measurement series. The points in the blue circle are values of air-equilibrated water<br />
at temperatures between 0 o C and 30 o C. The black lines indicate addition of ”excess-air” (upper<br />
line: water at 0 o C, lower line: water at 30 o C). Most of the samples show ratios in the expected<br />
area, i.e. they are situated on the mixing line of equilibrated water with unfractionated air. However<br />
the uncertainties are quite large and typically in the range of 10%. Only the best sample has an<br />
uncertainty of 2-3%.<br />
Background Noble gases in groundwaters can<br />
be used to reconstruct paleotemperature due to<br />
the temperature-dependent solubility. Additionally,<br />
the noble gas concentrations in groundwater<br />
are affected by dissolution of trapped air bubbles.<br />
The effect of this so-called excess-air can be corrected.<br />
If noble gases are extracted from fluid inclusions<br />
in stalagmites, similar patterns can be detected<br />
(see figure). Compared to groundwater, stalagmite<br />
samples have much less water (4 orders of<br />
magnitude), but a 100 times higher excess-air to<br />
water ratio. Therefore the calculation of noble gas<br />
temperatures becomes difficult.<br />
Methods and results Noble gases have been<br />
exctraced from the stalagmites by crushing, respectively<br />
heating the sample in evacuated copper<br />
tubes. In the next step the amount of released water<br />
was determined using the water vapour pressure.<br />
The extracted water amount is strongly dependent<br />
on the stalagmite (H12 (Oman) 0.25 wt%,<br />
MA1 and MA2 (Chile) 0.01 wt%, OBI 5 (Austria)<br />
0.004 wt%) and on the techniques (crushing,<br />
heating, microwave treatment).<br />
The noble gas measurements are performed by<br />
1.2x10 -2<br />
mass spectrometry . For the calculation of absolute<br />
noble gas amounts a diluted air standard<br />
is used. The reproducibility of standard measurement<br />
is in the range of 1–2%. Sample uncertainties<br />
have been much higher, because of a high<br />
and variable background and additionaly in some<br />
cases low noble gas signals. Nevertheless the background<br />
corrected Xe-Ne and Ar-Kr plot are indicating<br />
that the values are not far away from the<br />
expected mixing between noble gases from water<br />
filled inclusions and some unfractionated ”excessair”.<br />
Calculation of noble gas temperatures in case of<br />
the best samples (from a cave with a recent cave<br />
temperature of 26 o C) leads to 26, respectively<br />
30 o C (although with very large uncertainties) using<br />
the inverse modelling technique of Aeschbach-<br />
Hertig et al. [1999]. This may be a hint that<br />
noble gases from fluid inclusions can be used to<br />
determine noble gas temperatures if the problems<br />
(high uncertainties, high water/air volume ratios)<br />
can be managed.<br />
Funding This work is financially supported by<br />
the DFG (grant AE 93/3) as part of the DFG-<br />
Forschergruppe DAPHNE.
4.1. GROUNDWATER AND PALEOCLIMATE 125<br />
4.1.5 Gas partitioning in groundwater<br />
Werner Aeschbach-Hertig<br />
Abstract Using dissolved gas concentrations in groundwater to derive residence times and recharge<br />
temperatures requires an adequate understanding of observed excesses and sometimes deficits of atmospheric<br />
gases. A comprehensive theory has been developed that explains both excess air and degassing<br />
with a single model equation describing equilibrium gas partitioning.<br />
concentration relative to equilibrium<br />
1<br />
0.8<br />
0.6<br />
0.4<br />
0.2<br />
LPA17<br />
LPA20<br />
LPA22<br />
LPA23<br />
LPA23b<br />
Ne Ar Kr Xe<br />
Noble Gas<br />
LPA32<br />
LPA32b<br />
LPA33<br />
LPA38<br />
LPA39<br />
Figure 4.6: Measured (symbols) and modeled (lines) concentrations of the atmospheric noble gases<br />
relative to solubility equilibrium in 10 degassed samples from the Ledo-Paniselian Aquifer in Belgium<br />
(unpublished data). The generalised CE-model describes most samples reasonably well, even strongly<br />
degassed ones.<br />
Background The partitioning of gases between<br />
groundwater and soil air is important for a variety<br />
of issues, such as the availability of oxygen,<br />
the fate of volatile contaminants, and the distribution<br />
of gaseous tracers. Several widely used environmental<br />
tracer methods are based on gases,<br />
e.g. CFCs, SF6, He isotopes, or radon. The atmospheric<br />
noble gases are usually used to derive<br />
recharge temperatures, but are also powerful tools<br />
to trace and study gas partitioning.<br />
Methods and results Many noble gas studies<br />
have clearly shown the widespread presence<br />
of a gas excess above atmospheric solubility equilibrium<br />
(so-called ”excess air”) in groundwater.<br />
An increasing number of studies, however, also<br />
reports undersaturations, which are attributed<br />
to degassing. A quantitative understanding of<br />
the patterns of dissolved noble gases in groundwater<br />
is required for a reliable determination of<br />
noble gas recharge temperatures and gas tracer<br />
ages. Models assuming a diffusion-controlled degassing<br />
process can often be ruled out because of<br />
the absence of an indicative isotope fractionation.<br />
Instead, both excesses and deficits of dissolved<br />
gases in groundwater can be explained by equilibrium<br />
partitioning of gases between the water<br />
and trapped gas bubbles. The concept of closed-<br />
system equilibration (CE-model) proved very successful<br />
in modeling excess air [Aeschbach-Hertig<br />
et al. , 2000]. It can also be used to model the<br />
loss of dissolved gases that occurs if gas bubbles<br />
form in the subsurface. Excess air appears to<br />
be closely related to water table fluctuations and<br />
related pressure variations in the recharge zone.<br />
Degassing could be due to the accumulation of<br />
geogenic or biogenic gases and/or a pressure decrease<br />
in the groundwater discharge area. Currently<br />
only few complete noble gas data sets of degassed<br />
groundwaters exist, which could be used to<br />
test the applicability of the generalised CE-model<br />
to describe degassing. In the available cases, the<br />
model performs reasonably well.<br />
Outlook/Future work Simple laboratory experiments<br />
are currently performed to verify the<br />
model concept. Further field data sets are required<br />
in order to test the model’s usefulness in<br />
deriving recharge temperatures and tracer ages<br />
from degassed samples<br />
Main publication A paper describing the recent<br />
advancements in model formulation is in<br />
preparation, an invited conference presentation<br />
has been given [Aeschbach-Hertig, 2006d].
126 CHAPTER 4. AQUATIC SYSTEMS<br />
4.1.6 Laboratory and field experiments on the formation of excess air in<br />
groundwater<br />
Laszlo Palcsu (participating scientists: Werner Aeschbach-Hertig)<br />
Abstract Excess air is a contribution to the gases dissolved in groundwater in addition to the<br />
solubility equilibrium component, formed by partial or total dissolution of air trapped during water<br />
level rises in the unsaturated zone. The amount of excess air can be quite large, mainly if the water<br />
level increase is significant, for example in case of recharge from ephemeral streams in semi-arid<br />
regions or artificial recharge. One of the main goals of this project is to investigate the mechanisms<br />
that control the excess air formation.<br />
Figure 4.7: a. Study site at Danube River b. Plexiglas columns for laboratory experiments<br />
Background We examine the formation of excess<br />
air under field and laboratory conditions using<br />
all five noble gases. In laboratory experiments<br />
with plexiglas columns filled with different types<br />
of sand, we investigate how the excess air amount<br />
and composition depend on the hydrostatic pressure<br />
as well as the size distribution of the sand and<br />
the entrapped air bubbles. In field experiments<br />
we study the relationship between excess air and<br />
water level fluctuations. Two study sites were selected<br />
where the groundwater level increased due<br />
to artificial recharge (Basel, Switzerland) and due<br />
to river floods (Danube River, Hungary).<br />
Methods and results In the mass spectrometric<br />
measurements of noble gases dissolved in water<br />
we could achieve a quite good reproducibility (0.6<br />
% for helium, 0.6 % for neon, 0.3 % for argon,<br />
0.8 % for krypton, and 1.0 % for xenon), however<br />
we still have a few-percent systematic difference<br />
between the obtained and the expected values.<br />
Presently, test are conducted to identify the<br />
source of these deviations.<br />
Besides the technical improvements, preparation<br />
and sampling have been done in the laboratory<br />
column experiments as well as in the field work.<br />
All-plastic columns have been built to perform<br />
excess air experiments under well known conditions<br />
(see Figure 1.b). We filled two columns with<br />
sand particles, one with fine, the other with coarse<br />
sand. In the first experiments we would like to<br />
find correlations, among others, of the excess air<br />
amount and fractionation with hydrostatic pres-<br />
sure, entrapped air abundance and bubble size distribution.<br />
A few sampling campaigns have been<br />
already carried out, the samples will be measured<br />
soon.<br />
To examine the excess air formation under natural<br />
conditions, we have chosen a field site along<br />
the Danube River, Hungary. Five sampling tubes<br />
have been built into the wall of a dug-well (see<br />
Figure 1.a). During a flood in the Danube River,<br />
the groundwater surface will be increasing, thus<br />
entrapped soil gases can produce excess air in the<br />
area of the dug-well. From the sampling tubes,<br />
one can take water samples which represent always<br />
a defined depth. After wintertime, the flood<br />
in the Danube River can exceed 4-5 m, which<br />
seems to be an excellent possibility to find in-situ<br />
produced excess air in the groundwater depending<br />
on the water level increase.<br />
Outlook/Future work Having the measured<br />
noble gas concentrations we can describe the<br />
formed noble gas pattern using different dissolution<br />
models such as the closed-system equilibration<br />
model [Aeschbach-Hertig et al. , 2000]. In<br />
the excess air pattern, the bubble size distribution<br />
might play a role, therefore we intend to investigate<br />
the entrapped air amount and distribution<br />
within the sand in the column experiments using<br />
X-ray tomography.<br />
Funding This project is supported by the Marie<br />
Curie Intra-European Fellowships program (reference<br />
number: 009562).
4.1. GROUNDWATER AND PALEOCLIMATE 127<br />
4.1.7 Excess air formation at an artificial recharge site<br />
Matthias Kopf (participating scientists: Laszlo Palscu, Werner Aeschbach-Hertig, Eric Zechner<br />
(UBA))<br />
Abstract Correlations between excess air and environmental conditions during groundwater recharge<br />
are examined. A field experiment at an artificial recharge site as well as laboratory column experiments<br />
are conducted in order to determine in detail how different parameters influence the formation<br />
of excess air.<br />
���<br />
��<br />
��<br />
��<br />
��<br />
��<br />
�<br />
�������������������<br />
������������������<br />
�<br />
� �� �� �� �� ��� ���<br />
���������������� ��������� �<br />
Figure 4.8: Ne excess ∆Ne versus distance from the infiltration area in the test field Stellimatten<br />
near Basel. A significant increase of ∆Ne takes place between surface water and the freshly infiltrated<br />
water in the infiltration area followed by mixing with background groundwater.<br />
Background Surface water infiltrating the<br />
ground is equilibrated with the atmosphere, its<br />
dissolved noble gas concentrations reflecting the<br />
soil temperature because of the temperature dependence<br />
of the Henry coefficients. However, as<br />
the groundwater level increases as a result of the<br />
infiltration, bubbles of air are entrapped in the<br />
groundwater, adding an excess component to the<br />
dissolved gases (the so-called excess air). In order<br />
to determine paleo recharge temperatures from<br />
the equilibrium component, the accumulation of<br />
excess air has to be understood. Column tests<br />
with sand of different granulation and field experiments<br />
in areas with well-known recharge conditions<br />
are performed to study the correlation of<br />
excess air with parameters such as pressure variation<br />
during groundwater level changes.<br />
Methods and results A field experiment has<br />
been conducted at an artificial recharge site (Stellimatten)<br />
operated by the water works of the city<br />
of Basel. The sequence of alluvial deposits at<br />
this site ranges from silty clay to coarse-grained<br />
gravel with hydraulic conductivity values between<br />
9 · 10 −7 m/s and 2 · 10 −3 m/s. The study area lies<br />
in a steady groundwater stream, to which periodically<br />
every 30 days Rhine water is added by<br />
flood irrigation. This infiltration lasts 10 days,<br />
afterwards the flooded area is allowed to regenerate<br />
for 20 days. During such a cycle, samples for<br />
radon, dissolved noble gases, stable isotopes and<br />
SF6 were taken. Groundwater level changes, temperature,<br />
and conductivity were monitored.<br />
Very well visible is the accumulation of radon in<br />
the infiltrated Rhine water and the mixing with<br />
the existing groundwater. At the surface, the<br />
infiltrating Rhine water has an activity of < 6<br />
Bq/l, increasing to < 20 Bq/l as it reaches the<br />
aquifer. At the end of the test field the water<br />
has an activity of < 70 Bq/l, comparable to the<br />
steady groundwater stream (A ≈ 80 Bq/l), indicating<br />
mixing with the groundwater. The stable<br />
isotopes show a clear separation of the groundwater<br />
stream ( δ 2 H≈-68�) from the Rhine water<br />
( δ 2 H ≈-77�), mixing with increasing distance<br />
from the infiltration point. In addition, an accumulation<br />
of the relative Ne excess ∆Ne (a measure<br />
of excess air) along the flow path is noticed, starting<br />
at nearly zero ∆Ne in the infiltrating Rhine<br />
water. Immediately after infiltration the ∆Ne increases,<br />
indicating formation of excess air. In the<br />
flow path, mixing between groundwater and infiltrated<br />
Rhine water takes place, seen in the dispersion<br />
of ∆Ne (see figure). The groundwater level<br />
changes show a correlation with ∆Ne and therefore<br />
excess air.<br />
Outlook/Future work In the data obtained<br />
from Stellimatten we look for further correlations<br />
of excess air with parameters naturally influencing<br />
its formation (e.g. geology, biology). The lab<br />
experiments will allow us to explore such correlations<br />
under even better controlled conditions.<br />
If robust correlations are found, dissolved noble<br />
gases in groundwater may not only be used to<br />
derive paleotemperatures but also as a proxy for<br />
other recharge conditions (e.g. water level fluctuations)
128 CHAPTER 4. AQUATIC SYSTEMS<br />
4.1.8 Collecting dissolved gases in water by diffusion samplers<br />
Martin Wieser (participating scientists: Werner Aeschbach-Hertig)<br />
Abstract A new sampling method to extract dissolved noble gases from groundwater by in-situ<br />
equilibration with a small gas volume separated by a semi-permeable membrane (so-called diffusion<br />
sampler) has been established. Lab and field experiments were conducted to test the functionality<br />
and efficiency of the method.<br />
Figure 4.9: Adaptation curve of nitrogen saturated diffusion samplers in air saturated water. Shown<br />
is the curve for 40 Ar. Embedded is a schematic drawing of a diffusion sampler<br />
Background The dissolved noble gas content in<br />
groundwater is a significant palaeoclimatic tool for<br />
determination of the infiltration temperature. In<br />
order to measure the concentration of these noble<br />
gases, sampling of the water for later analysis is an<br />
important issue. Besides the original method to<br />
take water samples in copper tubes, a new method<br />
of diffusion samplers has been proposed [Sanford<br />
et al. , 1996].<br />
Methods and results The conventional sampling<br />
method is to store a certain amount of water<br />
in copper tubes whose ends are clenched off<br />
by steel clamps. This water can be extracted on a<br />
high-vacuum line to receive the dissolved gases for<br />
mass spectrometrical analysis. In the new method<br />
of passive diffusion samplers gas containers with<br />
a diffusive membrane are used, which are introduced<br />
into the water and stay there for about two<br />
days. During this time the dissolved gas content of<br />
the water equilibrates with the gas volume in the<br />
container. This container is built by two copper<br />
tubes whose open sides are connected via a silicone<br />
tube, which represents the membrane (see<br />
fig. 4.9). After removing the sampler, the copper<br />
tube containing the sampled gas is clenched<br />
off by a hydraulic plier to make a gas-tight sample.<br />
The measurement of this gas sample in conjunction<br />
with the determination of the total dissolved<br />
gas pressure (TDGP) provides the same information<br />
as the analysis of water samples. A new<br />
multiprobe that inclueds a TDGP probe has been<br />
tested and applied.<br />
The determination of the sampler’s equilibration<br />
time was a major topic of the research. This time<br />
depends on the permeability of the membrane and<br />
therefore on the noble gas. By preparing diffusion<br />
samplers in a nitrogen atmosphere and equilibrating<br />
them in air saturated water for defined times,<br />
I could estimate the adaptation times of the exponential<br />
saturation curve for several wall thicknesses<br />
of the silicone tube. Other experiments<br />
with degassed or oversaturated water were carried<br />
out similarly. The noble gas with the longest<br />
adaptation time, according to their permeability<br />
in silicone rubber, was neon, xenon was the<br />
fastest.<br />
The samplers as well as the multiprobe were used<br />
for several field experiments including a groundwater<br />
well near Willersinnweiher in Ludwigshafen<br />
and a mining lake in Brandenburg. Also, comparisons<br />
with the conventional method both in the<br />
lab and the field have been carried out.<br />
Results show the usefulness of the new method as<br />
an addition to the conventional method.<br />
Outlook/Future work After having installed<br />
the infrastructure for measurements of gas samples<br />
and establishing the use diffusion samplers,<br />
the method can be incorporated in field campaigns<br />
to come. Furthermore, a study of the total gas<br />
composition could be conducted.
4.1. GROUNDWATER AND PALEOCLIMATE 129<br />
References<br />
Aeschbach-Hertig, W. 2006a. Edelgase im Grundwasser als Tracer und Klimaindikatoren. Invited<br />
talk, Kolloquium Erdwissenschaften, University of Basel, Switzerland.<br />
Aeschbach-Hertig, W. 2006b. Edelgase und ”Excess Air” im Grundwasser. Invited talk, Hydrologisches<br />
Kolloquium, University of Freiburg, Germany.<br />
Aeschbach-Hertig, W. 2006c. Environmental tracers in groundwater studies - Case study North China<br />
Plain. Invited talk, School of Environmental Science and Engineering, Chang’an University, Xi’an,<br />
China.<br />
Aeschbach-Hertig, W. 2006d. Groundwater age dating with gas tracers: The role of gas partitioning.<br />
Invited key presentation, Annual Meeting of the Geological Society of America (GSA), Philadelphia,<br />
USA.<br />
Aeschbach-Hertig, W. 2006e. Rebuttal of ”On global forces of nature driving the Earth’s climate. Are<br />
humans involved?”. Env. Geol. DOI 10.1007/s00254-006-0519-3.<br />
Aeschbach-Hertig, W. 2006f. Spurenstoffmethoden zur Erforschung des Grundwassers. Invited talk,<br />
Rhein-Neckar Gesprächskreis, Heidelberg, Germany.<br />
Aeschbach-Hertig, W., Peeters, F., Beyerle, U., Beyerle, U., & R., Kipfer. 1999. Interpretation of<br />
dissolved atmospheric noble gases in natural waters. Water Resour. Res., 35, 2779–2792.<br />
Aeschbach-Hertig, W., Peeters, F., Beyerle, U., & R., Kipfer. 2000. Palaeotemperature reconstruction<br />
from noble gases in ground water taking into account equilibration with entrapped air. Nature,<br />
405, 1040–1044.<br />
Aeschbach-Hertig, W., Holzner, C. P., Hofer, M., Simona, M., Barbieri, A., & Kipfer, R. 2007. A<br />
time series of environmental tracer data from deep meromictic Lake Lugano, Switzerland. Limnol.<br />
Oceanogr., 52, 257 – 273.<br />
Busenberg, E., & Plummer, N. L. 2000. Dating young groundwater with sulfur hexafluoride: Natural<br />
and anthropogenic sources of sulfur hexafluoride. Water Resour. Res., 36, 3011–3030.<br />
Edmunds, W. M., Ma, J.Z., Aeschbach-Hertig, W., Kipfer, R., & Darbyshire, D.P.F. 2006. Groundwater<br />
recharge history and hydrogeochemical evolution in the Minqin Basin, North West China.<br />
Appl. Geochem., 21, 2148–2170.<br />
Friedrich, R., Aeschbach-Hertig, W., Vero, G., & Leßmann, B. 2006. A multi tracer study to investigate<br />
the groundwater in the Odenwald region, Germany. In: Annual Meeting of the Geological Society<br />
of America (GSA), abstracts. Philadelphila: Geological Society of America (GSA).<br />
Kipfer, R., Aeschbach-Hertig, W., Peeters, F., & Stute, M. 2002. Noble gases in lakes and ground waters.<br />
Pages 615–700 of: Porcelli, D., Ballentine, C., & Wieler, R. (eds), Noble gases in geochemistry<br />
and cosmochemistry. Rev. Mineral. Geochem., vol. 47. Washington, DC: Mineralogical Society of<br />
America, Geochemical Society.<br />
Kreuzer, A. M., Zongyu, C., Kipfer, R., & Aeschbach-Hertig, W. 2006. Environmental Tracers in<br />
Groundwater of the North China Plain. Pages 136–139 of: IAEA (ed), Isotopes in Environmental<br />
Studies - Aquatic Forum 2004. Vienna: IAEA.<br />
Sanford, W. E., Shropshire, R. G., & Solomon, D. K. 1996. Dissolved gas tracers in groundwater:<br />
Simplified injection, sampling, and analysis. Water Resour. Res., 32, 1635–1642.<br />
von Rohden, C. L., Kreuzer, A. M., & Aeschbach-Hertig, W. 2006. Dating Young Groundwater in<br />
the North China Plain. In: Groundwater – Present Status and Future Task, Abstracts. Beijing:<br />
International Association of Hydrogeologists.<br />
Wieser, M. 2006. Entwicklung und Anwendung von Diffusionssamplern zur Beprobung gelöster Edelgase<br />
in Wasser. diploma thesis, <strong>Universität</strong> Heidelberg.
4.2. LAKE RESEARCH (LIMNOPHYSICS) 131<br />
4.2 Lake Research (Limnophysics)<br />
Johann Ilmberger<br />
Group members<br />
Dr. Johann Ilmberger, head of group<br />
Dr. Christoph von Rohden, postdoc<br />
Christian Ebert, Diploma student<br />
Daniel Osusko, Staatsexamen student<br />
Abstract<br />
Water quality of lake waters is, among other factors, affected by mixing and transport processes in<br />
the interior, as well as by the exchange with the ambient ground water. These internal processes and<br />
the ground water exchange are the main subjects of our investigations.<br />
rain<br />
groundwater<br />
“old”<br />
groundwater<br />
heat exchange<br />
Sep Jan<br />
el. conductivity<br />
erosion<br />
wind<br />
circulation<br />
& convection<br />
eddydiffusion<br />
anaerobic<br />
evaporation<br />
temperature<br />
Jan<br />
~8 m<br />
Sep<br />
epilimnion<br />
thermocline<br />
hypolimnion<br />
?<br />
chemocline<br />
?<br />
?<br />
monimolimnion<br />
Figure 4.10: Schematic diagramm of transport processes in lakes.<br />
Background<br />
Transport processes in lakes are important for the lake water quality. Especially mining lakes tend to<br />
have a poor quality because of the disturbed landscape due to the mining activities.<br />
Methods and results<br />
The investigations are based on tracers and direct measurements. Mainly we are using the tracer SF6,<br />
but also stable isotopes and now upcoming Radon. Recently we started another Diploma work to<br />
improve the Radon measurements.<br />
The background level of SF6 can be used to study the interaction of groundwater with lake water.<br />
This is based on the equilibration of rain and surface waters with atmospheric gases and the increase<br />
of the atmospheric level of the man made SF6 during the last decades. Therefore groundwater — as<br />
it normally infiltrated a few decades ago — has a low SF6 content, while the lake water SF6 concentration<br />
is, at least during overturn, close to the higher atmospheric concentration. This difference of<br />
the signals can be used to study groundwater – lake water exchange. We apply this method to the<br />
gravel lake Willersinnweiher [Wollschläger et al. , 2006] and the mining lake Moritzteich (see section<br />
4.2.2).<br />
We use SF6 spike experiments to investigate vertical mixing and groundwater exchange. There we inject<br />
a small amount SF6 (few hundred mg) into the deep water body and trace the vertical spread and<br />
the balance by profile measurements. We applied this method to Lake Constance, Lake Hufeisensee,<br />
Lake Merseburg-Ost 1a and 1b. This summer we started a spike experiment at Lake Waldsee using 0.3<br />
mg SF6, which we injected right above the sediment. First measurements show a rather fast spread<br />
of the tracer towards the lake surface.<br />
Direct measurements include the profile measurements of temperature and electrical conductivity with<br />
a CTD-probe at a vertical resolution of ∼2 cm. Direkt measurements we used to calculate the vertical
132 CHAPTER 4. AQUATIC SYSTEMS<br />
transport in Willersinweiher [von Rohden et al. , 2006].<br />
Lakes in investigation: Mining lake Merseburg-Ost 1a, Mining lake Merseburg-Ost 1b, Lake Willersinnweiher,<br />
Lake Waldsee, Lake Moritzteich.<br />
The tracer methods, especially the spike experiments, are very well suited for the transport investigations.<br />
Projects and funding<br />
The SF6 spike measurements at the mining lakes Merseburg-Ost 1a and 1b were funded by the Centre<br />
of Environmental Research Leipzig-Halle and performed in close collaboration with B. Boehrer (UFZ-<br />
Leipzig/Halle, Section Gewässerforschung, Magdeburg).<br />
In the future we will intensify the research using radon as limnic tracer, as the work of Tobias Kluge<br />
[Kluge et al. , n.d.] has shown its potential as tracer for the groundwater exchange of gravel lakes.<br />
In a joined project, funded by the German Research Foundation, we investigate vertical transport and<br />
groundwater exchange at two mining lakes (Lake Waldsee and Lake Moritzteich).<br />
Collaborations<br />
Helmholtz-Zentrum fr Umweltforschung GmbH – UFZ, Dept. of Lake Research Magdeburg and Dept.<br />
of Isotope Hydrology Halle<br />
BTU Cottbus, Lehrstuhl Gewässerschutz<br />
<strong>Institut</strong>e for Biodiversity and Ecosystem Dynamics/Aquatic Microbiology, University of Amsterdam<br />
Limnologisches <strong>Institut</strong>, <strong>Universität</strong> Konstanz<br />
<strong>Institut</strong> <strong>für</strong> Seenforschung, Langenargen, LfU<br />
Peer Reviewed Publications<br />
1. Wollschläger et al. [2006]<br />
2. von Rohden et al. [2006]
4.2. LAKE RESEARCH (LIMNOPHYSICS) 133<br />
4.2.1 Empirical mode decomposition: A tool to analyse time series<br />
Johann Ilmberger (participating scientists: Christoph von Rohden)<br />
Abstract<br />
Empirical mode decomposition (EMD), which is a new method to analyse non linear and non stationary<br />
data, is applied to measured time series of water currents.<br />
Background<br />
Data analysis is an essential part in research and<br />
much effort has to be taken to extract information<br />
from measurements about ongoing processes.<br />
Usual data analysis assumes linear and stationary<br />
processes. At a first order approach, many systems<br />
can be treated linear. Restricting the analysis<br />
to appropriate time scales, also the stationary<br />
assumption holds and one might get acceptable<br />
results.<br />
Methods and results<br />
A useful tool to analyse non stationary and non<br />
linear data is the ”empirical mode decomposition”<br />
(EMD), which was introduced by N.E. Huang<br />
(Huang [2005]; Huang et al. [1996, 1998]). The<br />
method is based on the identification of the intrinsic<br />
oscillatory modes by their characteristic time<br />
scales in the data empirically, and decomposing<br />
the data accordingly. The advantage of the EMD<br />
is, that data of non stationary and non linear systems<br />
can be analysed. The decomposition is based<br />
on the assumption that any time series consists<br />
of different simple intrinsic modes of oscillations.<br />
Each intrinsic mode function (IMF), linear or non-<br />
linear, has the same number of extrema and zerocrossings.<br />
In 2004 we performed current measurements in a<br />
small stratified lake in the Rhine valley using a<br />
acoustic current profiler (ADCP). The currents in<br />
the lake are very low and the signal is rather noisy.<br />
Figure 11 shows a record of the north component<br />
of the current velocity at a water depth of 4.4 m.<br />
The signal is a 5 min mean, very noisy and does<br />
not show much of a structure. To analyse this<br />
signal, the empirical mode decomposition was applied.<br />
The whole set of the resulting IMF’s and<br />
the residue is shown in figure 12. The first IMF,<br />
or may be the first and second IMF, can be addressed<br />
to the signal’s noise, while the third and<br />
fourth clearly show a structure in the data, which<br />
is quite intermittent and wave package like.<br />
Funding<br />
This work was funded by the German Research<br />
Foundation (DFG).<br />
Main publication<br />
Contribution to the Workshop on Physical Processes<br />
in Natural Waters, Granada, 2006.
134 CHAPTER 4. AQUATIC SYSTEMS<br />
4.2.2 Hydrology and vertical transport of meromictic mining lakes traced<br />
with SF6 on the background level<br />
Christoph von Rohden (participating scientists: Johann Ilmberger)<br />
Abstract According to the solubility and the atmospheric input function, the anthropogenic gas<br />
SF6 causes characteristic signals in surface waters and groundwater. We use this signal to trace<br />
quantitatively hydrological processes in meromictic mining lakes. From depth and time dependent<br />
SF6-contents in the water column and in connected groundwaters we estimate vertical transport and<br />
— using the time information of the SF6-input — the coupling to the groundwater.<br />
Depth [m]<br />
0<br />
2<br />
4<br />
6<br />
8<br />
10<br />
12<br />
14<br />
16<br />
Temperature<br />
6 8 10 12 14 16 18<br />
Thermocline<br />
(Metalimnion)<br />
Monimolimnion<br />
Epilimnion<br />
Chemocline<br />
18<br />
1000 1200 1400 1600 1800 2000<br />
El. conductivity κ 25 [μS/cm]<br />
0.0 0.5 1.0 1.5 2.0 2.5 3.0<br />
SF 6 - conc. [fmol/l]<br />
Figure 4.11: Left: El. conductivity (25 ◦ C) and temperature at 6.9.2006 in Moritzteich (Lusatia, East<br />
Germany). The water column can be divided into the partly mixed epilimnion, the temperature stratified<br />
thermocline region (no distinct hypolimnion), followed by the chemocline (chemically stratified),<br />
and the anaerobic and partly chemically stratified monimolimnion. The monimolimnion is stable<br />
against vertical mixing. Right: SF6-concentrations at 6.9.2006 (exemplary). Lake surface is in equilibrium<br />
with atmosphere, deeper layers have higher SF6 remained from the last mixing (∼7 m depth).<br />
Very low concentrations in the monimolimnion indicate a comparatively high water age (≥40 y).<br />
Background Man made lakes, that form after<br />
cessation of open pit mining, are often problematic<br />
concerning the hydro-geochemical and biological<br />
development. Especially in meromictic<br />
lakes, that do not mix to the bottom, anaerobic<br />
monimolimnia can act as contaminant source.<br />
Knowledge about vertical mixing pattern, that are<br />
driven by wind and influenced by density stratification,<br />
morphology and the connection to the<br />
groundwater is therefore crucial for possible remediation<br />
and renaturation strategies. The stratification<br />
particularly at the interface between aerobic<br />
and anaerobic waters (chemocline) can be selfpreserving<br />
due to hydrochemical conversions and<br />
is therefore of interest.<br />
Methods and results Water samples with up<br />
to 20 cm depth resolution are taken monthly and<br />
measured for SF6. High resolution CTD-profiles<br />
document the density statification. Vertical transport<br />
and groundwater exchange times will be derived<br />
from tracer balances (SF6, heat) using budget<br />
methods. Hydrochemical analysis and stable<br />
isotope measurements of our project partners extend<br />
the data base for interpretation. SF6 data<br />
(see figure) reveal that the chemocline acts as efficient<br />
barrier for vertical exchange. Very low concentrations<br />
in the monimolimnion indicate an exchange<br />
with old groundwater (≥40 y) or the detachment<br />
from the atmosphere for a similar time<br />
scale.<br />
Funding The work is supported by the German<br />
Research Foundation (DFG).<br />
Main publication First results are in preparation<br />
for publication.
4.2. LAKE RESEARCH (LIMNOPHYSICS) 135<br />
References<br />
Huang, N. E. 2005. Introduction to Hilbert-Huang Transform and its Associated Mathematical Problems.<br />
In: Hilbert-Huang Transform in Engineering, vol. 1-32. New York: CRC Press.<br />
Huang, N. E., Long, S. R., & Shen, Z. 1996. The Mechanism for Frequency Downshift in Nonlinear<br />
Wave Evolution. Adv. Appl. Mech., 32, 59–111.<br />
Huang, N. E., Shen, Z., Long, S. R., Wu, M. C., Shih, H. H., Zheng, Q., Yen, N.-C., Tung, C. C., &<br />
Liu, H. H. 1998. The empirical mode decomposition and the Hilbert spectrum for nonlinear and<br />
non-stationary time series analysis. Proc. R. Soc. London, Ser. A, 454, 903–995.<br />
Kluge, T., Ilmberger, J., von Rohden, C., & Aeschbach-Hertig, W. A method for Radon-222 Measurement<br />
in Lakes to study Groundwater Inflow. Submitted to L&O methods.<br />
von Rohden, C., Wunderle, K., & Ilmberger, J. 2006. Parametrization of the vertical transport in a<br />
small thermally stratified lake. aquatic sciences accepted.<br />
Wollschläger, U., Ilmberger, J., Isenbeck-Schrter, M., Kreuzer, A., von Rohden, C., Roth, K., &<br />
Schäfer, W. 2006. Coupling of groundwater and surface water at Lake Willersinnweiher: Groundwater<br />
modelling and tracer studies. aquatic sciences accepted.
Small-Scale Air-Sea Interaction<br />
5.1 Small-Scale Air-Sea Interaction . . . . . . . . . . . . . . . . . . . . . . . . 139<br />
137
5.1. SMALL-SCALE AIR-SEA INTERACTION 139<br />
5.1 Small-Scale Air-Sea Interaction<br />
Group members<br />
Prof. Dr. Bernd Jähne, head of group<br />
Dr. Günther Balschbach, staff<br />
Dr. Kai Degreif, Postdoc<br />
Dr. Christoph Garbe, Postdoc<br />
Dr. Uwe Schimpf, Postdoc<br />
Dipl.Phys. Aleaxandra Herzog, PhD student<br />
Dipl.Phys. Kerstin Richter, PhD student<br />
Dipl.Phys. Markus Jehle, PhD student<br />
Dipl.Phys. Roland Rocholz, PhD student<br />
Dipl.Phys. Markus Schmidt, PhD student<br />
Dipl.Chem. Achim Falkenroth, PhD student<br />
Abstract<br />
Research in small-scale air-sea interaction at the IUP concentrates on air-sea gas exchange and the<br />
dynamics of wind-waves. The basic mechanisms are studied in laboratory experiments in a unique annular<br />
wind-wave facility (The Heidelberg Aeolotron), other laboratory facilities, and field experiments<br />
using imaging techniques for quantitative visualization of the water surface structure (wind waves),<br />
the flow field, concentration fields by laser-induced fluorescence, and the water surface temperature<br />
by passive and active thermography.<br />
Scientific Objectives<br />
The basic scientific objective is a better physical understanding of air-sea gas transfer, the dynamics<br />
of short wind waves, and the micro turbulence at the ocean surface.<br />
Currently the following topics are investigated:<br />
1. The influence of the diffusion coefficient (or the Schmidt number Sc) on the transfer velocity<br />
of gases. Together with the transfer velocity itself, this is a sensitive measure to distinguish<br />
different models.<br />
2. The influence of wind waves on air-sea gas transfer by enhancing the turbulence near the water<br />
surface.<br />
3. The influence of chemical reactivity on gas transfer. Here the hydration reaction of CO2 is<br />
currently of most interest, because currently only some model computations are available but<br />
no detailed measurements.<br />
4. Analysis of the spatial and temporal structure of the turbulence in the water-sided viscous<br />
boundary layer and close beneath as the driving force for air-water gas exchange.<br />
5. Studies of the intermittency of the transfer processes in order to gain a better insight into the<br />
mechanisms.<br />
6. Synthesis of all this findings in a physically based model the air/sea gas transfer process.<br />
Overarching topic<br />
is the study of small-scale air-sea interaction, especially the mechanisms of air-sea gas exchange and<br />
the dynamics of wind waves.<br />
Background<br />
Despite intensive research, knowledge about air-sea interaction processes has not been significantly<br />
improved during the last decade. Many basic questions are still open and the relation of the air-sea gas<br />
exchange rate with wind speed is discussed controversial. Both field and laboratory experiments show<br />
large deviations up to a factor of two from a simple relation between the wind speed and the gas transfer<br />
velocity [Jähne & Haußecker, 1998; Jähne, 2001]. It is obvious that other parameters, especially waveinduced<br />
near-surface turbulence and surface active films are of importance, but detailed modeling of<br />
these processes is still lacking. Therefore, despite their known significant limitations, semi-empirical<br />
relations between the wind speed and the gas transfer velocity, as established by Liss & Merlivat [1986]<br />
or Wanninkhof [1992], are still the state of the art.
140 CHAPTER 5. SMALL-SCALE AIR-SEA INTERACTION<br />
Another uncertainty in the estimation of transfer velocity is the dependence on the Schmidt number<br />
Sc. It is common to assume that the transfer velocity k is proportional to Sc −1/2 . However, for quite<br />
some time it is known [Jähne, 1980] that the exponent is about 2/3 for a smooth water surface at<br />
low wind speeds and gradually decreases to 1/2 for a rough and wavy water surface. The exact shape<br />
of this transition, and especially how it is influenced by surface films in coastal zones and on which<br />
parameters it depends, is not known. This lack of knowledge causes a considerable uncertainty in<br />
estimating the transfer velocity. A change of the exponent from 2/3 to 1/2 without a change of other<br />
parameters causes an increase of the transfer velocity by about a factor of two.<br />
Recently, the intermittent nature of the gas exchange process has come into the focus of research.<br />
Of particular interest is the microscale wave breaking, a process that causes enhanced near-surface<br />
turbulence. It is known that microscale wave breaking enhances gas transfer. Zappa et al. [2001]<br />
found, e. g., a good correlation between the measured transfer velocity and the fraction of the water<br />
surface at which surface renewal occurred by microscale wave breaking. Details of the mechanisms<br />
that allow a physically-based parameterization are, however, not yet known. The intermittency of the<br />
gas transfer is of much importance when integrating gas transfer rates form short time and spatial<br />
scales as determined by active thermography to larger scales. Because the relation between wind<br />
speed and the transfer velocity and possible other parameters is certainly nonlinear, not only the<br />
mean values but also the variations must be known for a proper integration.<br />
A particularly difficult and interdisciplinary problem is the influence of organic films on air-sea gas<br />
transfer [Frew, 1997]. Surfactants attenuate short wind waves and thus changes the hydrodynamic<br />
boundary conditions at the water surface. In effect, the gas transfer rate is significantly reduced.<br />
Interestingly this complex process can be modeled by simply relating the gas transfer rate to the<br />
mean square wave slope [Frew, 1997; Bock et al. , 1999; Frew et al. , 2004]. This close correlation<br />
between the mean square slope and the gas transfer rate was already pointed out by Jähne et al.<br />
[1987] long before systematic studies of the influence of surface films on gas transfer were performed.<br />
However, a more detailed modeling is still lacking.<br />
Main methods<br />
By using novel visualization techniques and image sequence processing techniques, the complex smallscale<br />
air-sea interaction processes can be tackled experimentally for the first time in both laboratory<br />
and field experiments. Equally important are spectroscopic techniques that allow simultaneous gas<br />
exchange measurements with many tracer. The techniques are briefly described in the following.<br />
UV-spectroscopy for volatile species dissolved in water UV spectroscopy in contrast to IR<br />
spectroscopy offers the significant advantage that it is not required to degas water samples<br />
in order to measure gases and volatile species dissolved in water, because water is transparent<br />
in the required wavelength range from 200–300 nm. Thus this technique can be used to measure<br />
concentrations both the water and air space. The technique adds a number of volatile species for<br />
gas exchange measurements, especially species containing aromatic rings, such as fluorobenzenes,<br />
thiophenes, and pyrenes. For further details see section 5.1.1 and Degreif [2006].<br />
Wave slope and height imaging A detailed investigation of the dynamics of short wind waves<br />
required simultaneous imaging of the wave height and slope. This is because the energy of<br />
gravity waves is contained in the wave height whereas the energy of the capillary waves is<br />
proportional to the wave slope. Therefore a novel instrumentation was developed that is capable<br />
to measure the wave slope and height simultaneously by making use of the fact that light at<br />
different wavelengths in the near infrared shows significant differences in absorption. In this way<br />
the imaging wave slope gauge could be extended for simultaneous wave height measurements<br />
(section 5.1.7 and Jähne et al. [2005]).<br />
Active thermography Using heat as a proxy tracer for gases has two significant advantages. Firstly,<br />
the concentration of the tracer at the water surface can directly be measured with infrared cameras.<br />
Secondly, the heat flux can be controlled by applying infrared radiation onto the water<br />
surface. Periodically varying infrared radiation was applied to the water surface to create a corresponding<br />
variation in the surface temperature of the water. For slow variations of the infrared<br />
radiation - slower than the time constant for the exchange process - the transfer velocity can be<br />
measured directly by dividing the known flux density by the measured temperature variation.<br />
If the heat flux is switched off, the temperature increase will decay with the characteristic time<br />
constant t⋆ (surface renewal time) for the transport process across the aqueous heat boundary<br />
layer. From this time constant the transfer velocity k can be computed directly using the relation<br />
t⋆ = D/k 2 , where D is the diffusion coefficient for heat [Jähne et al. , 1989]. By measuring the
5.1. SMALL-SCALE AIR-SEA INTERACTION 141<br />
phase shift and amplitude damping of the thermal boundary to periodically changing IR radiation,<br />
it is also possible to distinguish between different models for the exchange process and to<br />
investigate the intermittency of the process [Popp, 2006]. Because the infrared image sequences<br />
contain significant contrast, the surface flow field including its vorticity and local convergence<br />
and divergence zones can also be computed from image sequences [Garbe et al. , 2003]. Moreover,<br />
the spatial structure of the micro-turbulence at the water surface can be studied [Schimpf<br />
et al. , 2004].<br />
Fluorescence imaging of gas tracer concentration fields Concentration fields of dissolved gases<br />
in water can be made visible by two techniques. Firstly, oxygen can quench the fluorescence of<br />
dyes with a rather long live time. While previously less suitable dyes such as pyrene butyric<br />
acid were used, a new class of dyes, organic ruthenium complexes are more sensitive, not surface<br />
active and can be dissolved readily in water. Secondly, dyes with a pH-dependent fluorescence<br />
can be used with experiments using acid or alkaline gases or volatile species including carbon<br />
dioxide. While previously fluorescein or derivatives were used, a better alternative was found in<br />
HPTS.<br />
The ultimate goal is the dynamic visualization of three-dimensional concentration fields. One<br />
promising approach is a kind of spectroscopic tomographic technique. It makes use of the fact<br />
that the fluorescence spectrum of dyes generally shows a bandwidth between 30 and 100 nm.<br />
A second dye cab be used to attenuate the emitted fluorescent light in this wavelength range<br />
differently for different wavelengths. With this double-dye technique, the shape of the observed<br />
fluorescence spectrum depends on the path length the light travels through the water before it<br />
is measured. Because the fluorescence is excited from the air space, the path length directly<br />
corresponds to the distance from the water surface. For a given wavelength, the fluorescent<br />
light received is then integrated over a characteristic depth ˆz = α −1 (λ), where α(λ) is the<br />
wavelength-dependent absorption coefficient of the absorbing dye solution. If α(λ) is known,<br />
the depth-dependent concentration can be computed from the measured spectra as a linear<br />
inverse problem.<br />
3-D flow measurements close to and at the water surface The aqueous viscous boundary layer<br />
at a wind-driven water surface has a thickness of at most a millimeter. Therefore almost no flow<br />
measurements are available from this layer at a free water surface. We try to tackle this difficult<br />
experimental problem with two techniques. First, thermal image sequences from the water surface<br />
contain enough structures to computed 2-D flow fields (section ??). Secondly, a modified<br />
particle tracking technique is used for depth-resolved flow measurements. Again an absorbing<br />
dye is used to code the depth of the tracked particles and to measure the velocity component<br />
perpendicular to the water surface from the brightness change of the particle (section 5.1.5).<br />
Main activities<br />
Our current main activities include<br />
1. the development of a novel optic technique for simultaneous imaging of the height and slope of<br />
short wind waves (section 5.1.7),<br />
2. the development of depth-resolving imaging technique to measure concentration fields of gases<br />
close to the water surface by using a double dye laser induced fluorescence techniques (sections<br />
5.1.2 and 5.1.4),<br />
3. detailed studies of the Schmidt number dependency of air-water gas transfer (section 5.1.1),<br />
4. investigations of the air-sea gas exchange by active thermography (section 5.1.6),<br />
5. analysis of flow fields by passive and active thermography thermography (section ??),<br />
6. 3-D flow measurements within the aqueous viscous boundary layer. (section 5.1.5)<br />
Funding<br />
1. DFG-Schwerpunktprogramm 1114 “Mathematische Methoden der Zeitreihenanalyse und digitalen<br />
Bildverarbeitung”<br />
2. DFG-Schwerpunktprogramm 1147 “Bildgebende Strömungsmesstechnik”
142 CHAPTER 5. SMALL-SCALE AIR-SEA INTERACTION<br />
3. Graduiertenkolleg 1114 “Optische Messtechniken <strong>für</strong> die Charakterisierung von Transportprozessen<br />
an Grenzflächen” (TU Darmstadt and U Heidelberg)<br />
4. DFG Ja395/13: ”Impact of Wind, Rain, and Surface Slicks on Air-Sea CO2 Transfer Velocity -<br />
Tank Experiments”<br />
Cooperation within the institute and with groups outside of the institute<br />
1. Prof. Jürgen Wolfrum, PD Dr. Volker Ebert, Physikalische Chemie, <strong>Universität</strong> Heidelberg<br />
2. Prof. Dr. Klaus Affeld, Dr. Ulrich Kertzscher, Labor <strong>für</strong> Biofluidmechanik, <strong>Universität</strong>sklinikum<br />
Charite Berlin, Humboldt <strong>Universität</strong> Berlin<br />
3. Dr. Volker Beushausen, Laser-Laboratorium Göttingen e.V.<br />
4. Prof. Dr. Gerhard Jirka, Dr. Herlina, <strong>Institut</strong> fr Hydromechanik, TU <strong>Karls</strong>ruhe<br />
5. Prof. R. Mester, Digitale Bildverarbeitung, <strong>Institut</strong> <strong>für</strong> Angewandte Physik, <strong>Universität</strong> Frankfurt<br />
6. Dr. Bernd Schneider, Dr. Joachim Kuss, <strong>Institut</strong> <strong>für</strong> Ostseeforschung, Warnemünde<br />
7. Prof. Christoph Schnörr, Bildverarbeitung, Mustererkennung & Computergrafik <strong>Universität</strong><br />
Mannheim<br />
8. Prof. Dr. Detlef Stammer, Dr. Martin Gade, <strong>Institut</strong> <strong>für</strong> Meeresforschung, <strong>Universität</strong> Hamburg<br />
9. Prof. Dr. Douglas Wallace, Chemische Ozeanographie, Leibniz-<strong>Institut</strong> fr Meereswissenschaften,<br />
Kiel<br />
10. Dr. Nelson M. Frew, Marine Chemistry and Geochemistry, Woods Hole Oceanographic <strong>Institut</strong>ion<br />
(WHOI), USA<br />
11. Dr. Guillemette Gaulliez, IRPHE - Laboratoire IOA, University of Marseille, Frankreich<br />
12. Prof. Dr. Tetsu Hara, Graduate School of Oceanography (GSO), University of Rhode Island,<br />
USA<br />
Future Work<br />
Future work in the coming year will include laboratory measurements in the Heidelberg Aeolotron,<br />
the Marseille and the Hamburg wind wave facilities. Most of this work will be part of the international<br />
SOLAS initiative funded by the BMBF SOPRAN project. The measurements will combine<br />
gas exchange, wave imaging and flow measurements and modelling efforts. In the further stage also<br />
experiments in the field (Baltic Sea) are planned.<br />
The second focus will be further development of the depth-resolving measurements of concentration<br />
fields and 3-D flow fields within the aqueous viscous boundary layer in our new linear wind/wave<br />
facility.<br />
Peer Reviewed Publications<br />
1. Schimpf et al. [2006b]<br />
2. Garbe et al. [2007]<br />
3. Jähne et al. [2007]
5.1. SMALL-SCALE AIR-SEA INTERACTION 143<br />
Other Publications<br />
1. Garbe et al. [2006a]<br />
2. Falkenroth [n.d.]<br />
3. Jähne [2007a]<br />
4. Jähne [2007b]<br />
5. Jehle & Jähne [n.d.]<br />
6. Jehle & Jähne [2006a]<br />
7. Schimpf et al. [2006a]<br />
Diploma Theses<br />
1. Vogel [2006]<br />
PhD Theses<br />
1. Degreif [2006]<br />
2. Popp [2006]<br />
3. Kraus [2006]<br />
4. Jehle [2006]
144 CHAPTER 5. SMALL-SCALE AIR-SEA INTERACTION<br />
5.1.1 Gas Exchange Measurements: The Transition of the Boundary Conditions<br />
from a Flat to a Wavy Water Surface<br />
Kai Degreif<br />
Abstract Gas exchange measurements in a small circular wind wave tank were performed to reproduce<br />
the transition of the Schmidt number exponent from a flat to a rough and wavy water surface.<br />
The transition begins at unexpectedly low wind speeds and extends over a wide range of wind speeds.<br />
a)<br />
Schmidt number exponent n<br />
0.68<br />
0.66<br />
0.64<br />
0.62<br />
0.6<br />
0.58<br />
0.56<br />
0.54<br />
0.52<br />
0.5<br />
0.48<br />
clean surface 09.10.05<br />
clean surface 10.10.05<br />
clean surface 12.10.05<br />
parameterisation<br />
10 −4<br />
10 −3<br />
10 −2<br />
mean squared surface slope σ 2<br />
s<br />
10 −1<br />
k 600 [cm/h]<br />
b)<br />
100<br />
10<br />
1<br />
0.1<br />
τ−model: k ∝ u * Sc −1/2<br />
Deacon−model: k ∝ u * Sc −2/3<br />
clean surface 09.10.05<br />
clean surface 12.10.05<br />
clean surface 10.10.05<br />
surfactant 02.08.06<br />
parameterised transition<br />
0.1 0.2 0.5<br />
friction velocity u [cm/s]<br />
*<br />
1 2<br />
Figure 5.1: a) Measured Schmidt number exponent n in dependence of the waviness of the water<br />
surface. b) Measured transfer velocities normalised to a Schmidt number Sc = 600. Blue dotted line:<br />
model predictions for a flat water surface, red dotted line: predictions for a rough and wavy water<br />
surface, black dotted line: expected transition for a clean surface as in picture a).<br />
Background The theory of mass transfer at the<br />
air water interface is well understood only for a<br />
smooth and flat water surface as in this case the<br />
boundary conditions are equivalent to mass transfer<br />
to a smooth solid wall. Gas transfer may be<br />
quantified in terms of a “transfer velocity k” in<br />
the following form:<br />
k = u∗w<br />
1<br />
12.2 Sc−2/3<br />
Sc > 60 (5.5)<br />
Herein u∗w is the water side friction velocity, a<br />
quantity that describes the shear stress that is<br />
produced by the wind at the water surface. Sc<br />
denotes the “Schmidt number”, a tracer specific<br />
property that describes the relation of tracer diffusivity<br />
and kinematic water viscosity.<br />
If we assume a rough and wavy water surface,<br />
the boundary conditions have to be changed in<br />
the way that now surface divergences and convergences<br />
are allowed. In the theoretical descriptions<br />
this change results in a drop of the Schmidt number<br />
exponent n from 2/3 to 1/2. To date theoretical<br />
descriptions are unable to predict the transition<br />
between the parameterisations for a smooth<br />
and for a rough water surface.<br />
Methods and results Gas exchange experiments<br />
were performed simultaneously with trace<br />
gases that exhibit different Schmidt numbers. In<br />
a small circular wind wave channel with 1.2 m diameter,<br />
wind speed was increased stepwise to produce<br />
different surface roughness conditions. The<br />
measurement of the Schmidt number exponent<br />
was directly accessible from the ratio of the transfer<br />
rates for the different trace gases (figure 5.1.a).<br />
In figure 5.1.b the transition between the different<br />
parameterisations for a clean water surface can<br />
easily be discerned. In an additional experiment<br />
the production of wind waves was suppressed by<br />
adding a surfactant to the water surface. In this<br />
case the measured data points join the parametrisation<br />
for a smooth water surface until the stability<br />
of the surfactant breaks and waves are generated.<br />
For low wind speeds and friction velocities<br />
the measured transfer velocities are higher than<br />
the theoretical predictions. This is an effect that<br />
is produced by secondary currents due to the annular<br />
geometry of the tank and shows clearly the<br />
limitations of the experimental setup.<br />
Outlook/Future work The transition of the<br />
Schmidt number exponent will be measured in the<br />
larger circular facility in Heidelberg (Aeolotron)<br />
as well as in the linear wind wave tanks in Marseilles<br />
and Hamburg. A new linear setup will be<br />
available in Heidelberg in 2007.<br />
Main publication [Degreif, 2006],
5.1. SMALL-SCALE AIR-SEA INTERACTION 145<br />
5.1.2 Gas exchange rates by LIF imaging of O2 concentration boundary<br />
layer<br />
Achim Falkenroth (Kai Degreif)<br />
Abstract Laser-Induced Fluorescence (LIF) is applied to directly observe and understand the mechanism<br />
of gas exchange in the upper 500 µm boundary layer. The luminescent dye used (Ru-complex)<br />
is sensitive to a given in-situ oxygen concentration that quenches the phosphorescence. The obtained<br />
boundary layer thickness leads to the gas exchange rate that is comparable with other measuring<br />
techniques.<br />
a:<br />
b:<br />
Boundary layer thickness z * (mm)<br />
0.6<br />
0.5<br />
0.4<br />
0.3<br />
0.2<br />
0.1<br />
0<br />
0 2 4 6<br />
Wind speed (m/s)<br />
c:<br />
k 600 (cm/h)<br />
6<br />
5<br />
4<br />
3<br />
2<br />
1<br />
H 2<br />
N 2 O<br />
O 2 water probe<br />
O 2 boundary layer z fit<br />
O 2 boundary layer z e<br />
0<br />
0 1 2 3 4 5 6 7<br />
Wind speed (m/s)<br />
Figure 5.2: a: Time series of one line in 27 s with 185 Hz. b: Boundary layer thickness for O2 invasion<br />
into water using two image processing algorithms. c: Comparison of gas exchange constant k with<br />
other measurements.<br />
Background The difficulty in studying the<br />
inter-phase exchange processes is due to the small<br />
interacting thickness of approximately 30 µm to<br />
1 mm on both sides of a boundary layer z∗. Therefore,<br />
none of the traditional fixed sampling methods<br />
are applicable.<br />
A non invasive optical method using luminescent<br />
dyes is chosen to determine the gas concentration.<br />
Especially phosphorescent dyes are advantageously<br />
sensitive to quenching because of the long<br />
live time of their excitation states. In regions of<br />
high oxygen concentration, the amount of light<br />
emitted will be significantly lower.<br />
Methods and results In a small circular wind–<br />
wave tank, the LIF emission of a laser light sheet<br />
was imaged near the surface. The pixel resolution<br />
was 25 µm/pixel and the time resolution 185 Hz.<br />
From time series like a in the shown figure the<br />
boundary thickness z∗ was calculated. Using the<br />
relation<br />
k = Dox/z ∗<br />
(5.6)<br />
with the diffusivity Dox of oxygen in water, the<br />
gas exchange rate was calculated and compared<br />
with other measurement techniques.<br />
Outlook/Future work Better results for high<br />
wind speeds are expected from the improvement<br />
of the optical path in a new linear tank.<br />
Funding DFG-Research-Training-Group<br />
(Graduiertenkolleg 1114)<br />
Main publication [Falkenroth et al. , 2007]
146 CHAPTER 5. SMALL-SCALE AIR-SEA INTERACTION<br />
5.1.3 Water flow measurements in environmental and biological systems<br />
Participating scientist Christoph S. Garbe<br />
Abstract Novel measurement techniques are developed for accurately determining water flows in<br />
biological and environmental systems. These techniques are closely linked to the development of refined<br />
image processing techniques, making temporally and spatially highly resolved field measurements<br />
feasible.<br />
a) b) c)<br />
z<br />
12<br />
b<br />
0<br />
t1 t2 t3<br />
v(z)<br />
x<br />
Intensity, arbitrary units<br />
c<br />
0<br />
0 50 100 150 200<br />
Distance, arbitrary units<br />
10<br />
8<br />
6<br />
4<br />
2<br />
Flow Velocity FTh [mm/min]<br />
9.0<br />
8.8<br />
8.6<br />
8.4<br />
8.2<br />
8.0<br />
7.8<br />
7.6<br />
Diameter of Xylem<br />
7.4<br />
4 5 6 7 8 9 10 11<br />
Distance from Petiol [cm]<br />
Figure 5.3: In a) the effect of Taylor dispersion due to the flow profile in microfluidics is shown. In<br />
b) intensity structures of active thermography due to the flow profile at the air water interface, and<br />
in c) the found correlation between xylem diameter and flow velocities.<br />
Background The transport of energy, mass and<br />
momentum are important quantities in describing<br />
complex system, such as those encountered in engineering,<br />
environmental and life sciences. Systems<br />
of interest are turbulent transport at water<br />
surfaces for air sea heat and gas exchange, water<br />
flow in plant leaves, and microfluids. Density<br />
distributions of tracers are visualized with modern<br />
cameras and their motion as well as density<br />
changes estimated from digital image processing<br />
techniques. Examples of such tracers are heat<br />
which can be applied with lasers and visualized<br />
with highly resolved thermographic imagers or<br />
caged dyes for microfluidic applications. Results<br />
of these flow measurements can be used for modelling<br />
physical transport processes, deepening our<br />
understanding of the systems analyzed.<br />
Funding Research Centre Jülich (Forschungszentrum<br />
Jülich), Jülich<br />
DFG SPP 1147, “Bildgebende Messverfahren <strong>für</strong><br />
die Strömungsanalyse”<br />
DFG SPP 1114, “Mathematische Methoden<br />
der Zeitreihenanalyse und digitalen Bildverarbeitung”<br />
Methods and results A fluid is visualized using<br />
density distributions as tracers. These can be<br />
heat or dyes. At the air-water interface, usually<br />
a net heat flux is present which allows visualizing<br />
turbulences directly without additional tracers.<br />
The motion of density distributions is then<br />
modelled as a linear partial differential equation<br />
(PDE). These PDEs can be solved from the image<br />
sequences with techniques developed in digital image<br />
processing. This allows to estimate the motion<br />
Flow Velocity<br />
as well as density changes in the image sequences.<br />
Novel motion models have been developed that<br />
allow to explicitly model velocity gradients of the<br />
fluid flow and the physical transport phenomena.<br />
In microfluidics, this makes it feasible to measure<br />
fluid flow accurately in the presence of Taylor dispersion.<br />
At the shear driven free water interface,<br />
a similar technique can be adapted to measure<br />
not only the flow velocity directly at the interface,<br />
but the flux of momentum from air to water.<br />
From thermography, both the flux of momentum<br />
as well as that of energy can be measured with<br />
the same experimental set-up in the same footprint<br />
directly at the interface. This opens up new<br />
possibilities for better understanding and parameterizing<br />
transport across the water-air interface.<br />
Outlook/Future work The developed techniques<br />
will be used for studying transport processes<br />
for shear driven as well as convective driven<br />
exchange of heat and mass at the air-water interface,<br />
both in laboratory setting as well as in<br />
the field. Furthermore, the transport of Xylem<br />
in plant leaves will be measured under varying<br />
environmental forcings. This will make spatially<br />
resolved measurements of water flows in plant<br />
leaves possible for the first time, closing a missing<br />
link in the understanding of water relations in<br />
plants. In microfluidic mixing machines, together<br />
with species concentrations from Raman scattering,<br />
low Reynolds number flows will be measured.<br />
This will improve the design and mixing capabilities<br />
for such devices.<br />
Main publication Garbe et al. [2006c,b]<br />
2.0<br />
1.8<br />
1.6<br />
1.4<br />
1.2<br />
1.0<br />
Diameter DnX [mm]
5.1. SMALL-SCALE AIR-SEA INTERACTION 147<br />
5.1.4 Measuring depth dependent concentration profiles via fluorescent<br />
pH-indicator<br />
A. Herzog<br />
Abstract A new wind wave flume is built in order to investigate penetration of acid/alkaline gases<br />
from air into the water phase through the air-water boundary layer.<br />
Figure 5.4: left image: example of calibration curve emission intensity over pH-value; right image:<br />
penetration of acid gases -dark eddies- into a dye solution in the alkaline range illuminated by a Laser<br />
from above.<br />
Background In environmental physics gas exchange<br />
is of high importance regarding the damping<br />
of CO 2 in the oceans, which is a crucial factor<br />
in the prediction of world climate.<br />
Each available model of gas exchange prognoses<br />
a different depth-dependent gas concentration<br />
within the water-sided boundary layer between air<br />
and liquid phase. Yet, until now it was not possible<br />
to measure this concentration directly and<br />
therefore distinguish between the models.<br />
It is known that molecular diffusion determines<br />
the actual transition of gas molecules into the<br />
skin of the boundary layer and turbulent processes<br />
dominate the transport into deeper layers. But<br />
the kind of turbulent processes that take place is<br />
still under investigation, e.g. ?. In general, this<br />
work continues with the project of ? and is closely<br />
related to the work of ?.<br />
Methods and results In this work the depthdependent<br />
gas concentration is examined by<br />
LASER induced fluorescence (LIF). This means<br />
fluorescence dyes are used which indicate the presence<br />
of different gases via a change in intensity of<br />
fluorescene.<br />
In detail a fluorescent pH-indicator for detection<br />
of alkaline/acid gases like CO 2 is used. For<br />
the present setup the experiment starts with a<br />
dye solution in the alkaline range, where fluorescence<br />
intensity is highest. Penetrating acid gases<br />
diminuish the fluorescence intensity and are therefore<br />
visible to a CCD-camera setup.<br />
Titration experiments have been carried out to<br />
obtain calibration curves, grey value and therefore<br />
emission intensity as a function of conductivity or<br />
pH-value. The result of one of these is plotted<br />
in the figure above. Especially around the first<br />
point of neutralization the intensity is extremely<br />
sensitive to changes in the conductivity/pH-value<br />
(high slope). So penetrating acid gases appear as<br />
areas of lesser fluorescence intensity. In that way<br />
not only the gas concentration can be determined<br />
locally but also the transport mechanism in the<br />
forms of turbulent currents and eddies, which can<br />
be seen in the right image above.<br />
As the boundary layer size varies between 30 -<br />
300 µm the demands on optical properties are<br />
extremly high.<br />
Currently a new linear wind-wave-flume is being<br />
built with better optical properties that is also<br />
able to deal even with strong acid/alkaline gases<br />
like HCl. The old circular facility was regretably<br />
not able to fullfill the needs of the used technique.<br />
Outlook/Future work The new flume will be<br />
finished within the next month. After instrumentation<br />
is sucessfully completed the main measurements<br />
can begin in the first months of next year.<br />
Funding This project is supported by the DFG<br />
via the GRK 1114 -’Optische Messtechniken <strong>für</strong><br />
die Charakterisierung von Transportprozessen an<br />
Grenzflächen’.<br />
Main publications [Herzog, n.d.]
148 CHAPTER 5. SMALL-SCALE AIR-SEA INTERACTION<br />
5.1.5 3D fluid flow measurement close to free water surfaces<br />
Markus Jehle<br />
Abstract A novel measurement technique is developed for 3D reconstruction of velocity vector fields<br />
close to free water surfaces. The new method overcomes the restriction of planar dimensionality by<br />
both a sophisticated experimental setup and data analysis based on contemporary image processing<br />
techniques.<br />
1.5<br />
1<br />
0.5<br />
0<br />
-0.5<br />
-1<br />
-1.5<br />
0 0.5 1<br />
z = 9.5mm z = 7.5mm z = 5.5mm<br />
z = 3.5mm z = 1.5mm z = 0.5mm<br />
umean/vmean [pixel/frame] urms/vrms [pixel/frame] wmean [cm/frame] wrms [cm/frame]<br />
0.8<br />
0.6<br />
0.4<br />
0.2<br />
0.01<br />
0.005<br />
0<br />
-0.005<br />
0<br />
-0.01<br />
0<br />
z[cm] 0 0.5 1 z[cm] 0 0.5 1 z[cm] 0 0.5 1 z[cm]<br />
Figure 5.5: Flow in a convection tank driven by buoyancy and evaporation. Top: Velocity vector<br />
fields starting from the deepest layer moving upwards (the w-component is colour-coded). Bottom:<br />
Vertical profiles of the mean and rms velocities (red: u, blue: v, black w).<br />
Background In order to examine the air-water<br />
gas exchange a detailed knowledge of the waterside<br />
flow-field is needed. Therefore important<br />
quantities such as shear stresses and velocity profiles<br />
have to be determined. Because the interesting<br />
flow is 3D, instationary and close to the wavedriven<br />
water-surface, conventional techniques like<br />
particle imaging velocimetry (PIV) using laser<br />
light sections are not applicable. A technique,<br />
that is similar to the one proposed here, is applied<br />
in the field of biofluidmechanics successfully,<br />
where it is important to get knowledge about the<br />
flow in artificial blood vessels.<br />
Methods and results A fluid volume is illuminated<br />
by LEDs. Small spherical particles are<br />
added to the fluid, functioning as a tracer. A<br />
camera pointing to the water surface from above<br />
records the image sequences. The distance of the<br />
spheres to the surface is coded by means of a<br />
supplemented dye, which absorbs the light of the<br />
LEDs according to Beer-Lambert’s law. By using<br />
LEDs flashing with two different wavelengths, it<br />
is possible to use particles variable in size. The<br />
0.025<br />
0.02<br />
0.015<br />
0.01<br />
0.005<br />
velocity vectors are obtained by using an extension<br />
of the method of optical flow, an established<br />
technique in computer vision. The vertical velocity<br />
component is computed from the temporal<br />
change of brightness.<br />
Hardware and algorithmics are tested in several<br />
ways: i) A laminar falling film serves as reference<br />
flow. The predicted parabolic profile of this<br />
stationary flow can be reproduced very well. ii)<br />
Convective turbulence acts as an example for an<br />
instationary inherently 3D flow (see figure 5.5).<br />
Outlook/Future work The presented technique<br />
constitutes the first part of a comprehensive<br />
research project whose ultimate goal is the<br />
spatio-temporal analysis of flows close to moving<br />
and wave-driven curved interfaces.<br />
Funding DFG priority program “Bildgebende<br />
Messverfahren <strong>für</strong> die Strömungsanalyse”.<br />
Main publications [Jehle & Jähne, 2006b;<br />
Jehle, 2006; Jehle et al. , in preparation]
5.1. SMALL-SCALE AIR-SEA INTERACTION 149<br />
5.1.6 Small-scale turbulence in the sea-surface microlayer<br />
Uwe Schimpf<br />
Abstract Heat is used as a proxy tracer for gases to study the transport processes across the seasurface<br />
microlayer. Infrared imaging techniques permit fast measurements of heat transfer velocities<br />
and give an insight into the transport mechanisms across the thermal sublayer.<br />
IR camera<br />
(3-5 µm)<br />
240 Watt carbon dioxide<br />
laser (10.6 µm)<br />
optics<br />
wind wave facility<br />
mirror<br />
x-y<br />
scan<br />
head<br />
wind speed: 2.0 ms<br />
0.5 s 1.0 s 1.5 s<br />
2.0 s 2.5 s 3.0 s<br />
wind speed: 7.0 ms<br />
0.5 s 1.0 s 1.5 s<br />
2.0 s 2.5 s 3.0 s<br />
Figure 5.6: Setup of the controlled flux technique in the wind-wave facility at IRPHE, University of<br />
Marseille. The carbon dioxide laser forces a periodically varying heat flux onto the water surface. The<br />
temperature response of the water surface (amplitude and phase shift) is measured by an infrared<br />
imager.<br />
Background The turbulent mixing processes in<br />
the watersided thermal boundary layer controlling<br />
the transport of heat across the sea surface microlayer<br />
are investigated with high temporal and<br />
spatial resolution by means of the active controlled<br />
flux technique [Jähne et al. , 1989].<br />
Methods and results The heat flux density is<br />
controlled by forcing infrared radiation onto the<br />
water surface and the variation of surface temperature<br />
is measured with an infrared camera.<br />
For slow temporal variations of the infrared radiation<br />
the heat transfer rate is given by the ratio<br />
of the net heat flux density and the temperature<br />
change at the water surface. If the heat flux is<br />
switched off, the temperature increase will decay<br />
with a characteristic time constant of the transport<br />
across the thermal sublayer. The measured<br />
phase shifts clearly indicate that the transfer process<br />
is strongly intermittent.<br />
Outlook/Future work The improved ACFT<br />
system was deployed for 4 weeks in wind-wave facility<br />
at IRPHE, University of Marseille. A detailed<br />
comparison of the local heat transfer and<br />
the synchronously measured surface slope of short<br />
wind waves (section 5.1.7) might allow to identify<br />
micro scale breaking of capillary waves.<br />
Funding Aktives Thermografie System, HBFG-<br />
125-667 (Hardware), DFG Ja395/13-1 (Joint<br />
project with <strong>Institut</strong> <strong>für</strong> Meereskunde, <strong>Universität</strong><br />
Hamburg.<br />
Main publications [Schimpf et al. , 2006b],<br />
[Schimpf et al. , 2006a]
150 CHAPTER 5. SMALL-SCALE AIR-SEA INTERACTION<br />
5.1.7 Measurement of short wind waves<br />
Roland Rocholz<br />
Abstract Imaging systems for the measurement of short wind waves were set up at two wind-wave<br />
facilities 1,2 . The synchronized measurement of the water surface structure and the heat flux (see also<br />
section 5.1.6) was tested during two gas–exchange experiments. The work on an automated calibration<br />
for the Heidelberg setup has been continued.<br />
a b<br />
Figure 5.7: a Example of wave imaging that color–codes the water surface gradient. (Raw image,<br />
image sector: 40 cm x 30 cm) b Top view of the robot for calibration. Three spindles press a glass<br />
window below the water surface. Thus defined inclinations of the water–glass–air interface can be<br />
used to calibrate the imaging setup.<br />
Background Measuring wind waves is of special<br />
interest for air–sea gas and heat transfer investigations.<br />
We aim at a better understanding of<br />
the wave influence on the turbulence near the water<br />
surface. This turbulence in the viscous boundary<br />
layer is responsible for enhancing the exchange<br />
of heat and trace gases. Especially the breaking of<br />
small–scale waves is suspected to contribute significantly<br />
to this enhancement [Csanady, 1990].<br />
Synchronized imaging of waves and heat flux on<br />
the water surface provides a direct visualization<br />
for this process, see also section 5.1.6. So far it<br />
is only possible to perform these measurements in<br />
the laboratory. We conduct experiments in different<br />
wind–wave tanks to investigate the reproducibility<br />
of the observations under different geometries<br />
given by the tanks. This is important to<br />
allow for inference to the physical processes at the<br />
open sea.<br />
Methods and results The applied wave imaging<br />
is based on light refraction. The water surface<br />
is observed by an digital camera from above and is<br />
illuminated by an area-extended light source from<br />
below. A defined spatial variation of radiance or<br />
color allows for tracing the rays from the image<br />
plane back to the light source. From this, the surface<br />
gradient can be computed using the law of refraction.<br />
For experiments in Marseille (11/2006),<br />
two color cameras were used to double the sample<br />
rate up to 400 images per second. In addition,<br />
the cameras were synchronized with the system<br />
for active thermography that gives the heat flux<br />
1 Wind–wave flume of the <strong>Institut</strong> <strong>für</strong> Meereskunde, University of Hamburg, Germany<br />
2 Wind–wave flume at IRPHE, University of Marseille, France<br />
information. As light source a sealed box with 20<br />
neon tubes was put directly into the water. Color<br />
coding was gained with the use of a colored transparent<br />
film. Figure 5.7a shows an example for the<br />
wave images. Sequences at wind speeds of 10, 8,<br />
5, 3, and 2 m/s were captured. For test experiments<br />
in Hamburg (04/2006) an array consisting<br />
of 320 LEDs was used as light source. In this case<br />
the radiance is regulated to achieve spatial variation<br />
of monochromatic light. The light source is<br />
located beneath the water body. This allows for<br />
the application of a telecentric illumination setup<br />
[Rocholz, 2005]. The setups still need further improvements<br />
to achieve the aimed accuracy. For<br />
the calibration of the wave imaging system a robot<br />
was build which is currently tested, see fig. 5.7b.<br />
Outlook/Future work Based on the evaluation<br />
of the Marseille experiments, we will conduct<br />
constitutive experiments in Hamburg (04/2007).<br />
Setup modifications and calibration tests are<br />
planned to improve the performance of the system.<br />
The combined analysis of synchronized wave<br />
and heat information is expected to give new insight<br />
into the microscale wave breaking process.<br />
Main publication [Rocholz, 2005], [Rocholz,<br />
2006]<br />
Funding DFG, Ja395/13: ”Mechanismen des<br />
Gasaustausches zwischen Atmosphäre und Ozean:<br />
Laborversuche und Modellierung”
5.1. SMALL-SCALE AIR-SEA INTERACTION 151
152 CHAPTER 5. SMALL-SCALE AIR-SEA INTERACTION<br />
5.1.8 Spectroscopic Techniques for Gas-Exchange Measurements<br />
Felix Vogel<br />
Abstract To evaluate the applicability of different spectroscopic techniques for temporally resolved<br />
gas-exchange measurements a Raman spectometer was built and existing UV/Vis systems were improved.<br />
Laboratory experiments yielded that Raman spectroscopy is not suitable for dynamic gasexchange<br />
measurements due to its insufficient temporal resolution while the applicability of UV/Vis<br />
spectroscopy was confirmed.<br />
Figure 5.8: Simultaneous measurement of the concentration of anisole in the air and water-bulk during<br />
an invasion experiment<br />
Background Studying gas-exchange processes<br />
contributes to the understanding of our climate<br />
system as well as it is fundamental research of<br />
turbulent processes in fluids.<br />
Accounting for small scale processes to yield an<br />
accurate parametrisation of the transfer rate, temporally<br />
resolved in-situ measurements of the concentration<br />
change have to be performed.<br />
Besides classical methods measuring dissolved<br />
gases, recently temporally highly resolved spectroscopic<br />
techniques with volatile aromatics have<br />
been introduced as a new tool for the investigation<br />
of the transfer processes [Degreif2006].<br />
Funding None<br />
Methods and results Experiments with pure<br />
and dissolved aromatics yielded that the newly<br />
built Raman setup is not suitable for systemanic<br />
gas-exchange measurements. To conduct experiments<br />
at the circular wind-wave flume of the University<br />
of Heidelberg and the linear wind-wave<br />
flume of the University of Hamburg, one waterphase<br />
and one air-phase setup was developed. The<br />
performance of both UV/Vis spectrometers was<br />
evaluated at the Aeolotron laboratory. With an<br />
absorption path length of up to 10 metres the<br />
temporal resolution of the air-phase spectrometer<br />
is of the order of deciseconds. Invasion experiments<br />
yielded that the in-situ concentration<br />
can be monitored continuously in the range of<br />
30 ppm−0.3 ppm for example for benzaldehyde.<br />
For the UV/Vis setup to measure the water-phase<br />
concentration an absorption length of one metre<br />
and an integration time of 40 ms turned out to be<br />
adequate.<br />
Outlook/Future work To reduce the uncertainties<br />
of the calculated piston velocities, the solubilities<br />
of the applied substances should be determined<br />
in laboratory experiments, as the values<br />
given in the available literature vary largly. The<br />
acquistion of concentration gauged spectra is also<br />
needed to determine the piston velocities of moderately<br />
soluble substances. As their transfer rate<br />
is not dominated by the transfer rate of one compartment,<br />
both air and water-phase concentration<br />
have to be taken into account.<br />
Main publications [Vogel, 2006]
5.1. SMALL-SCALE AIR-SEA INTERACTION 153<br />
References<br />
Bock, E. J., Hara, T., Frew, N. M., & McGilles, W. R. 1999. Relationship between air-sea gas transfer<br />
and short wind waves. J. Gephys. Res., 104, 25 821–25 831.<br />
Csanady, G.T. 1990. The role of breaking wavelets in air–sea gas transfer. J. Geophys. Res., 95,<br />
749–759.<br />
Degreif, K. A. 2006. Untersuchungen zum Gasaustausch - Entwicklung und Applikation eines zeitlich<br />
aufgelsten Massenbilanzverfahrens. PhD Thesis, <strong>Universität</strong> Heidelberg.<br />
Falkenroth, A.; Herzog, A.; Jähne B. Visualization of Air Water Gas Exchange using Novel Fluorescent<br />
Dyes. ISFV 12, 10- 14 September 2006, Göttingen.<br />
Falkenroth, Achim, Degreif, Kai, & Jähne, Bernd. 2007. Visualisation of Oxygen Concentration<br />
Fields in the Mass Boundary Layer by Fluorescence Quenching. In: Garbe, C.S., Handler, R.A., &<br />
Jähne, B. (eds), Transport at the Air Sea Interface - Measurements, Models and Parameterizations.<br />
Springer.<br />
Frew, N. M. 1997. The role of organic films in air-sea gas exchange. Pages 121–172 of: Liss, Peter S., &<br />
Duce, Robert S. (eds), The Sea Surface and Global Change. Cambridge, UK: Cambridge University<br />
Press.<br />
Frew, N. M., Bock, E. J., Schimpf, U., Hara, T., Haußecker, H., Edson, J. B., McGillis, W. R., Nelson,<br />
R. K., McKeanna, B. M., Uz, B. M., & Jähne, B. 2004. Air-sea gas transfer: its dependence on wind<br />
stress, small-scale roughness and surface films Small-Scale Air-Sea Interaction with Thermography.<br />
J. Geophys. Res, C8(109). C08S17, doi:10.1029/2003JC002131.<br />
Garbe, C. S., Roetmann, K., & Jähne, B. 2006a. An Optical Flow Based Technique for the Non-<br />
Invasive Measurement of Microfluidic Flows. Pages 1–10 of: 12TH INTERNATIONAL SYMPO-<br />
SIUM ON FLOWVISUALIZATION.<br />
Garbe, C. S., Roetmann, K., & Jhne, B. 2006b. An Optical Flow Based Technique for the Non-<br />
Invasive Measurement of Microfluidic Flows. Pages 1–10 of: 12th International Symposium on<br />
Flow Visualization.<br />
Garbe, C. S., Degreif, K., & Jhne, B. 2006c. Viscous stress measurements from active thermography<br />
on a free air-water interface. Pages 1–10 of: International Symposium on Transport at the Air-Sea<br />
Interface.<br />
Garbe, C. S., Handler, R. A., & Jähne, B. 2007. Transport at the Air Sea Interface - Measurements,<br />
Models and Parameterizations. Springer. Accepted for publication.<br />
Garbe, Christoph S., Spies, Hagen, & Jähne, Bernd. 2003. Estimation of Surface Flow and Net Heat<br />
Flux from Infrared Image Sequences. J. Mathematical Imaging and Vision, 19, 159–174.<br />
Herzog, A. Tiefenaufgelöste Grenzschichtvisualisierung an freien Oberflächen.<br />
Jähne, B. 1980. Zur Parameterisierung des Gasaustausches mit Hilfe von Laborexperimenten. PhD<br />
Thesis, <strong>Universität</strong> Heidelberg. D-200.<br />
Jähne, B. 2001. Air-Sea Interaction: Gas Exchange. In: Steele, J., Thorpe, S., & Turekian, K. (eds),<br />
Encyclopedia of Ocean Sciences. Academic Press, London.<br />
Jähne, B. 2007a. Complex Motion. Springer. LNCS 3417.<br />
Jähne, B. 2007b. Complex Motion in Environmental Physics and Live Sciences. Pages 92–105 of:<br />
Jhne, B. (ed), Complex Motion. Springer. LNCS 3417.<br />
Jähne, B., & Haußecker, H. 1998. Air-Water Gas Exchange. Annual Rev. Fluid Mech., 30, 443–468.<br />
Jähne, B., Münnich, K. O., Bösinger, R., Dutzi, A., Huber, W., & Libner, P. 1987. On the parameters<br />
influencing air/water gas exchange. J. Geophys. Res, 92, 1937–1949.<br />
Jähne, B., Libner, P., Fischer, R., Billen, T., & Plate, E. J. 1989. Investigating the transfer processes<br />
across the free aqueous viscous boundary layer by the controlled flux method. Tellus, 41B, 177–195.
154 CHAPTER 5. SMALL-SCALE AIR-SEA INTERACTION<br />
Jähne, B., Schmidt, M., & Rocholz, R. 2005. Combined optical slope/height measurements of short<br />
wind waves: principle and calibration. Meas. Sci. Technol., 16, 1937–1944.<br />
Jähne, B., Popp, C., Schimpf, U., & Garbe, C. S. 2007. The Influence of Intermittency on Air/Water<br />
Gas Transfer Measurements. In: Garbe, C.S, Handler, R. A., & Jhne, B. (eds), Transport at the Air<br />
Sea Interface-Measurements, Models and Parameterizations. Springer. Accepted for Publication.<br />
Jehle, M. 2006. Spatio-temporal analysis of flows close to water surfaces. PhD Thesis, <strong>Universität</strong><br />
Heidelberg.<br />
Jehle, M., & Jähne, B. A novel method for spatio-temporal analysis of flows close to free water<br />
surfaces. Experiments in Fluids, Special Issue for ISFV12.<br />
Jehle, M., & Jähne, B. 2006a. Direct estimation of the wall shear rate using parametric motion models<br />
in 3D. In: Pattern Recognition, 28th DAGM.<br />
Jehle, M., & Jähne, B. 2006b. A novel method for spatiotemporal analysis of flows within the waterside<br />
viscous boundary layer. In: 12th International Symposium of Flow Visualisation.<br />
Jehle, M., Klar, M., & Jähne, B. in preparation. Optical-Flow based velocity analysis. In: Tropea, C.,<br />
Foss, J., & Yarin, A. (eds), Springer Handbook of Experimental Fluid Dynamics. Berlin, Heidelberg:<br />
Springer.<br />
Kraus, S. 2006. Entwicklung eines flexiblen Softwaresystems zur Auswertung spektroskopischer<br />
Satelliten-Bildsequenzen. PhD Thesis, Technische Informatik, <strong>Universität</strong> Mannheim.<br />
Liss, P. S., & Merlivat, L. 1986. Air-sea gas exchange rates: introduction and synthesis. Pages 113–127<br />
of: Buat-Menard, P. (ed), The Role of Air-Sea Exchange in Geochemical Cycling. Dordrecht, The<br />
Netherlands: Reidel.<br />
Popp, C. J. 2006. Untersuchung von Austauschprozessen an der Wasseroberfläche aus Infrarot-<br />
Bildsequenzen mittels frequenzmodulierter Wärmeeinstrahlung. PhD Thesis, <strong>Universität</strong> Heidelberg.<br />
Rocholz, A. 2005. Bildgebendes System zur simultanen Neigungs- und Höhenmessung an kleinskaligen<br />
Wind-Wasser-Wellen. diploma thesis, <strong>Universität</strong> Heidelberg.<br />
Rocholz, Roland. 2006. Imaging System for combined slope/height measurements of short wind<br />
waves : ISHG. In: DPG Frhjahrstagung, Heidelberg, 03.2006 (ed), Verhandlungen der Deutschen<br />
Physikalischen Gesellschaft. Deutsche Physikalische Gesellschaft.<br />
Schimpf, U., Garbe, C. S., & Jähne, B. 2004. Investigation of transport processes across the sea-surface<br />
microlayer by infrared imagery. J. Geophys. Res, C8(109). C08S13, doi:10.1029/2003JC001803.<br />
Schimpf, U., Popp, C., & Jähne, B. 2006a. Active Thermography: a local and fast method to<br />
investigate heat and gas exchange between ocean and atmosphere. In: DPG Frhjahrstagung, Heidelberg,<br />
15.-17.03.2006 (ed), Verhandlungen der Deutschen Physikalischen Gesellschaftt. Deutsche<br />
Physikalische Gesellschaft.<br />
Schimpf, U., Frew, N., & Jähne, B. 2006b. Infrared Imaging: A novel tool to investigate the influence<br />
of surface slicks on air sea gas exchange. In: Gade, M., Hühnerfuss, H., & Korenowski, G.M. (eds),<br />
Marine Surface Films: Chemical Characteristics, Influence on Air-Sea Interactions, and Remote<br />
Sensing. Springer.<br />
Vogel, F. 2006. Raman- and UV-Spectroscopy of liquids and dissolved volatile gases for gas-exchange<br />
measurements. diploma thesis, <strong>Universität</strong> Heidelberg.<br />
Wanninkhof, R. 1992. Relationship between wind speed and gas exchange over the ocean. J. Gephys.<br />
Res., 97, 7373–7382.<br />
Zappa, C. J., Asher, W. E., Jessup, A. T., Klinke, J., & Long, S. R. 2001. Effect of microscale wave<br />
breaking on air-water gas transfer. Pages 23–29 of: Donelan, M. A., Drennan, W. M., Saltzman,<br />
E. S., & Wanninkhof, R. (eds), Gas Transfer at Water Surfaces. Geophysical Monograph, vol. 127.<br />
Washington, DC: American Geophysical Union.
Forschungsstelle “Radiometrie” of<br />
the Heidelberger Akademie der<br />
Wissenschaften<br />
6.1 Forschungsstelle ”Radiometrie” of the Heidelberger Akademie der Wissenschaften<br />
. . . . . . . . . . . . . . . . . . . . . . . . . . . . . . . . . . . . 157<br />
155
6.0. FORSCHUNGSSTELLE “RADIOMETRIE” 157<br />
6.1 Forschungsstelle ”Radiometrie” of the Heidelberger Akademie<br />
der Wissenschaften<br />
Augusto Mangini<br />
The Forschungsstelle is an independent research unit funded by the Heidelberger Akademie der Wissenschaften.<br />
Founding began in the year 1958 will run through the end of 2010.<br />
Group members<br />
Prof. Dr. Augusto Mangini<br />
Dr. Bernd Kromer<br />
R. Eichstätter, technician<br />
M. Gillmann, technician<br />
K. Thomas, Secretary<br />
Additional funding from the DFG, BMBF and EU:<br />
Dr. H. Braun, Post Doc<br />
Dr. M. Friedrich, Post Doc<br />
Dr. D. Scholz, Post Doc<br />
Dr. A. Schröder-Ritzrau, Post Doc<br />
Dr. I. Unkel, Post Doc<br />
Dr. P. Verdes, Post Doc<br />
S. Talamo, Scientific staff<br />
F. Bernsdorff, PhD-student<br />
J. Fohlmeister, PhD-student<br />
C. Mühlinghaus, PhD-student<br />
N. Latuske, PhD-student<br />
J. Lippold, PhD-student<br />
D. Schimpf, PhD-student<br />
N. Vollweiler, PhD-student<br />
H. Baus, technician<br />
E. Gier, technician<br />
S. Kühr, technician<br />
S. Lindauer, technician<br />
4 student assistants<br />
The task of the Forschungsstelle ”Radiometrie” of the Heidelberger Akademie der Wissenschaften is<br />
dating and interpretation of climate archives. The research unit presently consists of two groups, the<br />
Radiocarbon Lab (Bernd Kromer) and the Th/U-Lab (Augusto Mangini).<br />
14 C Lab The focus of the 14 C Lab are highly precise 14 C-dating and the construction of a calibration<br />
curve for radiocarbon that reaches far back into the last Glacial. Furthermore this Lab delivers 14 Cdatings<br />
for several archeological groups.<br />
Methods We use both the conventional gas-counting technique and AMS. The gas counters were<br />
developed to highest precision (better than 2 permille). For AMS we prepare graphite targets, to be<br />
measured at one of the European AMS facilities.<br />
Extension of tree-ring based 14 C calibration into the Late Glacial In collaboration with<br />
the tree-ring laboratories of the University Stuttgart-Hohenheim and the University of Zürich/WSL<br />
Birmensdorf we extend the tree-ring based 14 C calibration into the past. Presently the absolutely<br />
(annually) dated oak and pine chronology starts at 12.400 years BP (before AD 1950) [Friedrich et al.<br />
, 2004; Reimer et al. , 2004]. In the Late Glacial two independent chronologies were built in the two<br />
tree-ring labs, assisted be numerous 14 C predating in our laboratory [Kromer et al. , 2004; Schaub<br />
et al. , 2005]. Based on a comparison to the marine 14 C of Hughen et al. [2004] the chronologies<br />
cover the mid-Bølling, all of Allerød and the initial 150 years of Younger Dryas (ca. 14.100 to 12.800
158 CHAPTER 6. FORSCHUNGSSTELLE “RADIOMETRIE”<br />
cal BP). The trees were recovered from gravel pits at the Danube river and its tributaries, the lignite<br />
area south-east of Berlin, and construction sites in Zürich. Beyond the range of these chronologies we<br />
assembled several floating 14 C sections from trees found in Northern Italy and Romania. The 14 C data<br />
sets are evaluated to infer solar activity variability [Bond et al. , 2001; Solanki et al. , 2004; Usoskin<br />
& Kromer, 2005; Usoskin et al. , 2006] as well as ocean thermohaline circulation changes. Combined<br />
with 10 Be time series from Greenland they may serve to link tree-ring and ice-core time-scales.<br />
From dendro-climatological parameters of tree-rings, such as ring-widths, frost damage and growth<br />
patterns climate anomalies can be reconstructed.<br />
14 C dating, archaeology and geosciences We maintain extensive collaborations with archaeologists<br />
to date key sites, such as Troy [Kromer et al. , 2002] or the Nasca sites in Peru [Eitel et al.<br />
, 2005], and to anchor floating tree-ring sections by 14 C wiggle-matching to the absolute scale. In<br />
the ’Roman Gap Project’ (http://www.arts.cornell.edu/dendro/2004News/ADP2004.html) we assist<br />
in the extension of the Eastern Mediterranean chronologies into the first millennium AD, to link the<br />
absolute part to the 2300-year long Bronze Age chronology [Manning et al. , 2003]. The date of the<br />
eruption of Thera remains a crucial and still controversial time marker of the Late Bronze Age in the<br />
Eastern Mediterranean. In long-standing collaborations with colleagues in archaeology we contribute<br />
to a high-precision 14 C date of this event [Manning et al. , 2001].<br />
14 C in the present-day carbon cycle The present-day 14 C level is largely determined by the<br />
re-equilibration of the atmosphere following strong 14 C input during the bomb testing up to 1962,<br />
and the dilution of the natural 14 C level by anthropogenic, 14 C free, CO2 emissions (see contribution<br />
by I. Levin in this report). In our laboratory continuous 14 C times series from several sites around<br />
the globe have been measured up to today, now covering more than 40 years [Levin & Kromer, 2004].<br />
Recently 14 C has become an important marker to determine the ratio of fossil to present-day sources<br />
of carbon, e.g. in the emissions trading. Here we are involved in pilot studies to establish legislative<br />
procedures.<br />
Th/U-Lab The Th/U-Lab works on continental archives, such as speleothems and travertines, as<br />
well as on marine samples, such as deep sea sediments, Mn-nodules and corals.<br />
One principal focus is the determination of the natural variations of climate in the past (from the<br />
Holocene to the Last Pleistocene) using the stable isotope composition of speleothems. Further, we<br />
determine the height of the sea level in the past from the position and ages of fossil coral reefs as well<br />
as the intensity of the Earths magnetic field during the past 350,000 years.<br />
These studies deliver a precise time scale for the variations of climate in the past, which is a basic<br />
requirement for understanding the mechanisms behind the larger abrupt climate changes during the<br />
past 350,000 years, as well as for the causes of the minor climate changes during the Holocene. We<br />
work in close cooperation with climate modelers from Hamburg and Berlin in the DEKLIM program (<br />
through 5/2006), and with modelers from Potsdam where their CLIMBER2 model is applied to study<br />
the abrupt climate changes that occurred during the last Glacial (Dansgaard/Oeschger events).<br />
Methods We use a number of methods for dating, relying on the disequilibrium of the natural decay<br />
chains (TIMS- 230 Th/U-, 231 Pa/U), and on the decay of 10 Be, a radioactive product of cosmic rays.<br />
Speleothems, an archive of paleoclimate Stalagmites are being developed as climate archives<br />
because they can be dated very precisely with the Th/U method, and because stable isotopes in<br />
the carbonate that can be measured at a resolution of 100 µm (corresponding to yearly resolution)<br />
contain a climate signal. Most stalagmites, display significant kinetic effects in the isotope signals.<br />
Since about ten years these kinetic signals in stalagmites were related to the intensity of precipitation.<br />
For example, for speleothems from Oman and from Central Germany, periods of enhanced kinetic<br />
were ascribed to periods of less intense precipitation [Burns et al. , 2002; Fleitmann et al. , 2003; Neff<br />
et al. , 2001; Niggemann et al. , 2003].<br />
This proxy for precipitation with a high resolution combined with the precise Th/U dating lead to<br />
a number of internationally regarded publications. For example we found a very good correlation<br />
between the intensity of precipitation in Oman and the intensity of solar irradiation [Neff et al. ,<br />
2001]. This relationship has been confirmed by a number of following studies. In November 2005<br />
we were granted by the DFG for a Forschergruppe (www.fg-Daphne.de) to study the kinetic effects<br />
in speleothems and their applicability as archives for precipitation and temperature in the past. In<br />
this project, lasting for the next 6 years, we work in close collaboration with groups in Trento, Italy,<br />
Innsbruck, Austria and from Bochum University.
6.1. FORSCHUNGSSTELLE “RADIOMETRIE” 159<br />
The intensity of the Earth’s magnetic field in the past Accumulating evidence suggests that<br />
solar activity is responsible for at least some climatic variability. These include correlations between<br />
solar activity and either direct climatic variables or indirect climate proxies over time scales ranging<br />
from days to millennia [Eddy, 1976; Labitzke & Loon, 1992; Svensmark & Friis Christensen, 1997;<br />
Soon et al. , 2000; Beer et al. , 2000; Hodell et al. , 2001]. A very notable correlations was that<br />
obtained in our group in Heidelberg [Neff et al. , 2001]. However, the climatic variability attributable<br />
to solar activity is larger than could be expected from the typical 0.1% changes in the solar irradiance<br />
observed over the decadal to centennial time scale [Beer et al. , 2000; Soon et al. , 2000]. Thus, an<br />
amplifier is required unless the sensitivity to changes in the radiative forcing is uncomfortably high.<br />
The first suggestion for an amplifier of solar activity was suggested by Ney [1959], who pointed out<br />
that if climate is sensitive to the amount of tropospheric ionization, it would be sensitive the intensity<br />
of the Earths magnetic field as well as to solar activity since the solar wind modulates the cosmic ray<br />
flux (CRF), and with it, the amount of tropospheric ionization [Ney, 1959].<br />
We are studying 10 Be in marine sediments to determine the timing and the intensity of the Earths<br />
magnetic field in the past. The cosmogenic nuclide 10 Be is mainly produced in the lower stratosphere<br />
by interaction of galactic cosmic rays with oxygen and nitrogen atoms, and its production is known<br />
to be strongly anti-correlated with the solar- and/or geomagnetic field strength. In addition, highly<br />
resolved profiles of 10 Be in marine sediments may be used to synchronize the marine to the ice core<br />
ones.<br />
Cooperation within the institute and with groups outside of the institute<br />
Peer Reviewed Publications<br />
1. Björck et al. [2006]<br />
2. Braun et al. [2005]<br />
3. Claussen et al. [2006]<br />
4. Frank et al. [2006]<br />
5. Friedrich et al. [2006]<br />
6. Frisia et al. [2006]<br />
7. Kilian et al. [2006]<br />
8. Manning et al. [2006]<br />
9. Scholz & Mangini [2006]<br />
10. Spötl et al. [2006]<br />
11. Spötl & Mangini [2006]<br />
12. Usoskin et al. [2006]<br />
13. Vollweiler et al. [2006]<br />
Other Publications<br />
1. Spötl & Mangini [2005]<br />
Diploma Theses<br />
1. Mühlinghaus [2006]<br />
2. Vollweiler [2005]
160 CHAPTER 6. FORSCHUNGSSTELLE “RADIOMETRIE”<br />
PhD Theses<br />
1. Braun [2006]<br />
2. Latuske [2006]<br />
3. Unkel [2006]
6.1. FORSCHUNGSSTELLE “RADIOMETRIE” 161<br />
6.1.1 Modelling growth and isotopic composition of stalagmites<br />
Christian Mühlinghaus (Participating scientist: Denis Scholz)<br />
Abstract Growth and isotopic composition of stalagmites are influenced by climate driven parameters.<br />
To understand the underlying mechanisms, we developed a time dependent multi box model to<br />
calculate growth and the isotopic enrichment of δ 13 C under disequilibrium conditions, both along the<br />
growth axis and individual growth layers of stalagmites.<br />
δ �� �����<br />
2 ,5 -2 ,5 -5 ,0 -7 ,5 -1 0 ,0<br />
δ �� � ����<br />
������������<br />
������� �������<br />
�������<br />
φ 1<br />
1 ,0<br />
0 ,8<br />
0 ,6<br />
0 ,4<br />
0 ,2<br />
0 ,0<br />
0 ,0<br />
������������������������<br />
0 ,1<br />
Figure 6.1: Growth and isotopic enrichment of δ 13 C along the growth axis with varying external<br />
parameters. Stage 1 : dT = 100s – 1000s – 500s, Stage 2 : T = 1 ◦ C – 20 ◦ C – 10 ◦ C, Stage 3 : φ1 = 0.1<br />
– 1.0 – 0.5<br />
Background To reconstruct past variations in<br />
Earth’s climate, a variety of climate archives are<br />
studied. During the last decades stalagmites came<br />
into focus due to their long, continuous growth<br />
periods and improved dating techniques. In this<br />
study a new multi box model is introduced to calculate<br />
time dependent processes in the solution<br />
layer like growth and isotopic enrichment of δ 13 C.<br />
Hereby, we focus on fractionation in disequilibrium,<br />
modelled by a kinetic Rayleigh process. The<br />
dependency of the isotope enrichment of δ 13 C on<br />
external parameters like temperature T , drip interval<br />
dT (i.e. the time between two drops) and<br />
mixing coefficient φ1 is investigated.<br />
Methods and results During CO2 degassing<br />
and calcite precipitation from the solution layer<br />
on top of the stalagmite, the isotopic composition<br />
of the solution and, thus, of the precipitated calcite<br />
changes. This process can be described by a<br />
Rayleigh process, if precipitation occurs under disequilibrium<br />
conditions. To describe this temporal<br />
development of the isotopic change, the movement<br />
of the solution layer has to be known.<br />
Model set-up By fixing the size of the drop volume<br />
and film thickness, boxes are constructed to<br />
divide the solution layer into individual attached<br />
parts. Assuming a stagnant film, the solution<br />
moves between boxes only, if a new drop hits<br />
the innermost box. Therefore, the movement of<br />
the solution becomes dependent on drip interval<br />
and, thus, on time. In addition, mixing processes<br />
must be considered, both between the falling drop<br />
�<br />
��<br />
����������<br />
and the innermost box and among the boxes, described<br />
by mixing coefficients φi.<br />
Calibration The calibration of these mixing coefficients<br />
is realized by a comparison to an existing<br />
stalagmite growth model. By iterative adjustment<br />
of the box model to the reference model the mixing<br />
parameters are optimized.<br />
Fractionation under disequilibrium Calcite<br />
precipitation under disequilibrium conditions can<br />
be described by a kinetic Rayleigh process. Unlike<br />
the enrichment of δ 13 C under equilibrium conditions,<br />
this process is not influenced by temperature<br />
only, but also by the drip interval. This is<br />
due to the temporal development of bicarbonate<br />
in the solution.<br />
Results As a main result, the isotopic enrichment<br />
of δ 13 C along the growth axis shows an increase<br />
with increasing drip interval. Comparing all input<br />
parameters, the drip interval seems to have<br />
the highest variability during the growth period<br />
of a stalagmite and might therefore be the main<br />
influence on variations in growth and isotopic enrichment<br />
of δ 13 C (see figure 6.1).<br />
Outlook/Future work As a future task an<br />
inversion of the box model is planned in order<br />
to extract drip interval changes from stalagmite<br />
records.<br />
Funding This study is part of the daphne -<br />
forschergruppe.<br />
Main publications Mühlinghaus [2006]
162 CHAPTER 6. FORSCHUNGSSTELLE “RADIOMETRIE”<br />
6.1.2 A precisely dated climate record for the last 9 kyr from three high<br />
alpine stalagmites, Spannagel Cave, Austria<br />
Nicole Vollweiler (Participating scientists: Denis Scholz, Christian Mühlinghaus, Augusto Mangini,<br />
Christoph Spötl (Innsbruck))<br />
Abstract We used the δ 18 O time-series of three stalagmites from the high alpine Spannagel cave<br />
(Austria) which grew in small distance from each other to construct a precisely U/Th-dated, continuous<br />
δ 18 O curve for the last 9 kyr (COMNISPA).<br />
δ 18 O [‰]<br />
-9,0<br />
-8,5<br />
-8,0<br />
-7,5<br />
-7,0<br />
-6,5<br />
0<br />
9 8 7 6 5 4 3 2 1 0<br />
Age [kyr]<br />
Figure 6.2: COMNISPA [Vollweiler et al. , 2006] in comparison with dated wood and peat samples<br />
indicating glacier extensions smaller than 1985 AD [Joerin et al. , 2006]. The grey areas indicate the<br />
uncertainty ranges for the composite parts of the curve<br />
Background Stalagmites are ideally suited to<br />
investigate short-term Holocene climate variability<br />
because they can be precisely dated with Useries<br />
methods and record variations of past temperature<br />
and precipitation in their oxygen isotope<br />
signals with high resolution. The Alps belong to<br />
the regions where the Holocene climate variability<br />
has been most intensively studied. Variations in<br />
vegetation, glacier extension, timberline, tree-ring<br />
width as well as periods of solifluction and pedogenesis<br />
and lake and river history indicate major climate<br />
oscillations. The Spannagel cave is located<br />
around 2,500 m asl at the end of the Tux Valley<br />
in Tyrol (Austria) close to the Hintertux glacier.<br />
The speleothem record is not influenced by effects<br />
of kinetic isotope fractionation due to the low temperatures<br />
in the cave (presently between 1.8 ◦ and<br />
2.0 ◦ C).<br />
Methods and results The combined record<br />
derived from the stalagmites SPA 12, SPA 128<br />
and SPA 70 shows substantial variability within<br />
the last 9 kyr (Fig.): The most pronounced and<br />
long-lasting phase of low δ 18 O values occurs between<br />
7.5 and 6.5 kyr and persists on slightly<br />
higher values until 5.9 kyr. Further periods of low<br />
δ 18 O values are between 3.8 and 3.6 kyr and during<br />
the MWP between 1.2 and 0.7 kyr. Between<br />
2.25 and 1.7 kyr, a time known as the Roman<br />
Warm Period (RWP), some of the Alpine passes<br />
were ice-free also in winter. COMNISPA shows<br />
15<br />
10<br />
5<br />
higher δ 18 O values during the RWP than during<br />
the MWP and suggests a shorter duration of the<br />
RWP than other archives. In contrast, periods<br />
of high δ 18 O are visible between 7.9 and 7.5, 5.9<br />
and 5.1, 3.5 and 3 kyr, and during the LIA between<br />
600 and 150 yr. The period between 5.9<br />
and 5.1 kyr has equivalence in many records from<br />
various regions in both hemispheres corresponding<br />
to global cooling. It also includes the time<br />
of the Alpine Iceman at 5.3 kyr. The timing of<br />
the climatic variations revealed by COMNISPA<br />
agrees approximately with that shown by other<br />
Alpine archives. For example, Joerin et al. [2006]<br />
dated wood and peat samples which were released<br />
by melting Swiss Alpine glaciers located between<br />
Engadin and Valais. The Figure shows the age<br />
distribution of their samples indicating glacier extensions<br />
smaller than 1985 AD and, therefore, periods<br />
when climatic conditions were different than<br />
at this time. Both the δ 18 O maxima and minima<br />
recorded in COMNISPA clearly have counterparts<br />
in the glacier recession record.<br />
Outlook/Future work We want to investigate<br />
further Alpine stalagmites from the Spannagel<br />
cave and from Obir Cave (South Austria) and<br />
compare our records to other Holocene archives.<br />
Funding DFG<br />
Main publications Vollweiler et al. [2006]<br />
Number of samples
6.1. FORSCHUNGSSTELLE “RADIOMETRIE” 163<br />
6.1.3 Measurement of 231 Pa in deep-sea sediments via ICP-MS and AMS<br />
Jörg Lippold<br />
Abstract The measurement of the tracers 231 Pa and 230 Th allows high resolution studies for paleoproductivity<br />
and ocean circulation on glacial to interglacial timescales. Using ICP-MS or AMS<br />
higher precision will be obtaind compared to formerly applied α-spectroscopy for measuring the 231 Pa<br />
/ 230 Th ratio of deep-sea sediments.<br />
Figure 6.3: 230 Th norm. 10 Be-flux at ODP Sites 983 (North Atlantic) and 1089 (South Atlantic)<br />
unaccounted for transport effects due to circulation or scavenging [Christl, Bernsdorff, Lippold]<br />
Background 231 Pa and 230 Th are natural radionuclides,<br />
which are continously produced in<br />
seawater by in situ decay of their dissolved progenitors<br />
234 U and 235 U. As a result, both are produced<br />
at a constant rate with an initial 231 Pa and<br />
230 Th activity ratio of 0.093. Variable 231 Pa and<br />
230 Th ratios in sediments indicate that both radionuclides<br />
follow different pathways of removal<br />
from the water column. The flux of 230 Th to<br />
the seafloor is nearly identical to its rate of production.<br />
In contrast, the longer oceanic residence<br />
time for dissolved 231 Pa due to lower particle reactivity<br />
allows a large scale diffusive transport<br />
over basin-wide distances prior to scavenging, resulting<br />
in its preferential removal in high particle<br />
flux regions. Particularly in the North Atlantic<br />
region radioisotope signals may be significantly<br />
influenced by changes in Ocean circulation. Up<br />
to now, the 231 Pa and 230 Th -ratio is the best<br />
kinematic proxy to quantify the strength of the<br />
meridional overturning circulation. Thus, 231 Pa<br />
and 230 Th -data, that provide the best estimate<br />
of Ocean circulation in the past, can be used as<br />
input for model calculations to quantify the transport<br />
of other tracers (e.g. 10 Be, see figure above)<br />
in the North Atlantic Ocean.<br />
Methods and results The accurate and precise<br />
determination of the very low 231 Pa content<br />
in marine sediments requires the application of a<br />
new analytical technique. ICP-MS is currently<br />
the most suitable analytical tool for high precision<br />
measurements of heavy isotope ratios. Therefore,<br />
a cooperation with the <strong>Institut</strong>e of Mineralogy<br />
at the University of Frankfurt to develop the<br />
appropriate analytical techniques for the determination<br />
of Th/U, and Pa-isotope-ratios with Inductively<br />
Coupled Plasma Mass Spectrometry (ICP-<br />
MS) was initiated. Additionally an alternatively<br />
method for measuring Pa with AMS (Accelerator<br />
Mass Spectroscopy) at the ETH in Zürich has<br />
been established, allowing to cross check results<br />
and to highlight special aspects of the measurement.<br />
Outlook/Future work In combination with<br />
published 231 Pa and 230 Th -data from the North<br />
Atlantic region, this records will help to greatly<br />
improve our understanding of past Ocean circulation<br />
in this region. Once established the 231 Pa<br />
measurement method has been already applied to<br />
further paleoclimate records, e.g. corals.<br />
Funding DFG Schwerpunktprogramm 527 and<br />
1158.<br />
Main publications none yet
164 CHAPTER 6. FORSCHUNGSSTELLE “RADIOMETRIE”<br />
6.1.4 Ghost Resonance in Glacial Climate<br />
Holger Braun<br />
Abstract A new hypothesis was elaborated to explain the 1470-year cycle of abrupt climate changes<br />
in the Last Glacial. This hypothesis was tested with two different types of models.<br />
Figure 6.4: Illustration of the ghost resonance mechanism with a conceptual model. The forcing<br />
(black, in arbitrary units) consists of two sinusoidal cycles with periods of 1470/7 (=210) and 1470/17<br />
(about 86.5) years. Each time the forcing crosses a certain threshold function (green), the model<br />
switches its state (negative values of the threshold function correspond to the ground state, positive<br />
values to the excited state). The response of the system (i.e. the time evolution of the threshold<br />
function) has a main spectral component of 1470 years, which is missing in the forcing.<br />
Background Paleoclimatic records (ice cores,<br />
deep sea sediments, speleothems) from the Last<br />
Glacial show repeated large-scale (10-15 Kelvin)<br />
warming events in the North Atlantic region, the<br />
so-called Dansgaard-Oeschger (DO) events. In<br />
the GISP2 ice core from Greenland, DO events<br />
are often spaced by about 1470 years or multiples<br />
thereof. This indicates that the events were<br />
probably triggered by a regular external forcing.<br />
But no such forcing with a pronounced 1470-year<br />
spectral component is known.<br />
Methods and results I elaborated a new hypothesis<br />
to explain the 1470-year cyclicity of DO<br />
events. According to this hypothesis, which I<br />
tested with a climate model and a simple conceptual<br />
model, the regularity of DO events is due to a<br />
nonlinear resonance caused by a periodic external<br />
forcing with a period of 1470 years, but without a<br />
corresponding spectral component (i.e. with spectral<br />
components corresponding only to harmonics<br />
of a missing 1470-year fundamental frequency).<br />
This resonance mechanism, which is known as<br />
ghost resonance, can occur in excitable nonlinear<br />
systems with a threshold. Since DO events probably<br />
represent threshold-like switches between two<br />
possible modes of deep water formation, the ghost<br />
resonance mechanism is indeed plausible to explain<br />
the events. The new hypothesis attributes<br />
the glacial 1470-year cycle of DO events to solar<br />
variability, since proxies of solar activity (i.e.<br />
records of cosmogenic radionuclides) exhibit pronounced<br />
spectral components near harmonics of<br />
1470 years.<br />
Outlook/Future work In the DFG project<br />
Dansgaard-Oeschger events (DFG project number<br />
MA821/33-1) I have started to investigate with a<br />
climate model if past solar irradiance variations<br />
could indeed have been strong enough to trigger<br />
regular DO events in the Last Glacial.<br />
Funding The work was funded by the Heidelberg<br />
Academy of Sciences and by the DFG (DFG<br />
project number MA821/33-1).<br />
Main publications Braun et al. [2005]<br />
Braun [2006]
6.1. FORSCHUNGSSTELLE “RADIOMETRIE” 165<br />
6.1.5 Dating and interpretation of climate proxies for three Holocene stalagmites<br />
from the South of Chile (Patagonia)<br />
Daniel Schimpf (Participating scientists: C. Mühlinghaus, D. Scholz, A. Schröder-Ritzrau, A.<br />
Mangini, R. Kilian (Trier), A. Kronz (Göttingen), C. Spötl (Innsbruck))<br />
Abstract Three Holocene stalagmites (MA-1, MA-2 and MA-3) from the Marcelo-Arévalo cave,<br />
which is located in the South of Chile (53 ◦ S) at the Pacific coast, were dated with the 230 Th/ 234 U<br />
method and analysed with respect to their oxygen and carbon isotopes. Furthermore a Mg/Ca ratio<br />
record for MA-1 was measured at high resolution. It is a proxy for precipitation and correlates very<br />
well with the isotope data. We find that the West wind drift, which controls precipitation, is strongly<br />
influenced by the El Nino Southern Oscillation.<br />
δ 13 C (‰ VPDB)<br />
0 1 2 3 4<br />
-6<br />
40 point smoothing 100*Mg/Ca<br />
δ 13 C MA-1<br />
-8<br />
-10<br />
-12<br />
-14<br />
-16<br />
0 1 2 3 4<br />
age (kyrs)<br />
Figure 6.5: Correlation between δ 13 C data and the Mg/Ca ratio<br />
Background For the first time stalagmites<br />
from a cave of the southernmost Andes were analysed<br />
at high resolution. The intensity of precipitation<br />
at this location reflects the shifts of the<br />
position of the West wind drift.<br />
Methods and results The 230 Th/ 234 U dating<br />
method was used to establish a depth-age model<br />
for the three stalagmites (MA-1, MA-2 and MA-<br />
3). The measurements were performed by a Thermal<br />
Ionization Mass Spectrometer (TIMS). Furthermore<br />
the Mg/Ca ratio was measured by Electron<br />
Microprobe, this ratio is a proxy for precipitation.<br />
Figure 6.5 shows a comparison between<br />
the δ 13 C profile and Mg/Ca ratio of stalagmite<br />
MA-1. The very good correlation between the two<br />
records confirms that the δ 13 C record (and in the<br />
same case the δ 18 O record) also depends on precipitation.<br />
The comparison of the dated δ 13 C and<br />
δ 18 O profiles with a record of the ENSO intensity,<br />
derived from a sediment record off the coast of<br />
Peru, reveals that ENSO strongly influenced the<br />
1,0<br />
0,9<br />
0,8<br />
0,7<br />
0,6<br />
0,5<br />
0,4<br />
0,3<br />
0,2<br />
0,1<br />
100*Mg/Ca<br />
intensity of precipitation, probably causing North-<br />
South-shifts of the Southern Westerlies. An eruption<br />
of volcano Mt. Burney (4.3 kyrs BP), which<br />
occurred 100 km to the north-west of the MA cave,<br />
resulted in a higher uranium content in the stalagmites<br />
for the following 2 kyrs due to a leaching<br />
effect caused by sulpherous ashes that covered the<br />
soil above the cave.<br />
Outlook/Future work ICP-MS data for all<br />
three stalagmites have been measured, these trace<br />
element data will be analysed. In addition a sediment<br />
core of lake Tamar in the vicinity of the<br />
MA cave has been taken and will be analysed.<br />
The stable isotope profiles will be modelled by C.<br />
Mühlinghaus.<br />
Funding Stalagmite der Südanden, DFG<br />
project<br />
Main publication Schimpf [2005], Kilian et al.<br />
[2006]
166 CHAPTER 6. FORSCHUNGSSTELLE “RADIOMETRIE”<br />
6.1.6 14 C in speleothems<br />
Jens Fohlmeister (Participating scientists: Bernd Kromer, Denis Scholz, Renza Miorandi (Trento),<br />
Silvia Frisia (Trento))<br />
Abstract Using the absolute age of speleothem samples from Th/U-dating, we can determine their<br />
14 C reservoir age. The 14 C reservoir age is controlled mainly by pCO2 in the unsaturated soil zone and<br />
the dissolution system of the limestone. The main factors governing soil pCO2 are soil temperature and<br />
precipitation. Hence, variations in the 14 C reservoir age may provide information on the variability<br />
of these two climate variables.<br />
d c f [% ]<br />
1 7<br />
1 6<br />
1 5<br />
1 4<br />
1 3<br />
1 2<br />
1 1<br />
1 0<br />
9<br />
8<br />
5 0 0 0 4 0 0 0 3 0 0 0 2 0 0 0 1 0 0 0 0<br />
c a l a g e [y B P ]<br />
Figure 6.6: Dead carbon fraction (dcf) of stalagmite<br />
ER-76. Dcf is increasing with time. Possible<br />
causes are changes in the dissolution system or an<br />
aging of soil organic matter.<br />
Background Speleothems (carbonates formed<br />
in caves) are excellent archives for studies of paleoclimate.<br />
We use 14 C of stalagmites as a geochemical<br />
tracer of climate-related processes in the unsaturated<br />
soil zone. A useful tool for radiocarbon<br />
interpretation is the dead carbon fraction (dcf).<br />
It determines the percentual fraction of carbon in<br />
a stalagmite, coming from the limestone or from<br />
old organic matter of the soil above the cave.<br />
In the soil the dcf is influenced by the soil respiration<br />
rate (atmospheric 14 C content) and the<br />
age spectrum of soil organic matter (depleted<br />
by radioactive decay). By dissolution of the<br />
limestone ( 14 C free) the dcf increases. The increase<br />
depends on the open/closed dissolution ratio<br />
[Hendy, 1971]. For the dcf we expect values<br />
between 0 (for an open system) and 50% (for a<br />
closed system).<br />
Methods and results We choose two time approaches:<br />
firstly we take a section of a stalagmite<br />
in the Holocene and secondly we investigate the<br />
present day situation by analysing drip water covering<br />
an annual cycle.<br />
We measured the 14 C content of the stalagmite<br />
ER-76 of the Grotta di Ernesto (N-Italy), covering<br />
a time span from 2.3 to 4.9 ky before present<br />
and one sample at 180 y BP. For the second approach<br />
we investigate the drip water of two sta-<br />
a 1 4 C [p m C ]<br />
1 0 2<br />
1 0 1<br />
1 0 0<br />
9 9<br />
9 8<br />
9 7<br />
9 6<br />
9 5<br />
9 4<br />
E R -7 6 s lo w d rip ra te<br />
E R -G 1 fa s t d rip ra te<br />
N o v J a n M a r M a y J u l S e p<br />
M o n th 0 5 /0 6<br />
Figure 6.7: 14 C in drip water of two stalagtites<br />
(ER-76, ER-G1). The 14 C activity imply different<br />
processes, which are responsible for the annual<br />
cycle.<br />
lagtites (ER-76, ER-G1) of the same cave. Each<br />
month we collect one sample of each source.<br />
Sample preparation for Accelerator Mass<br />
Spectrometry (AMS) 14 C dating was done in<br />
the Heidelberg radiocarbon labaratory. The stalagmite<br />
samples were drilled under a CO2 free<br />
atmosphere in a glove box. By acidifying the<br />
calcite powder and the drip water samples we obtain<br />
CO2 which is converted to graphite (required<br />
by the ion source) by the semi-automated AMStarget<br />
preparation line. The AMS measurements<br />
were done in Lund. The δ 18 O and the δ 13 C of the<br />
drip water samples were measured in Heidelberg.<br />
Figures 6.6 and 6.7 show first results of the<br />
Holocene section and drip water, respectivly. The<br />
results will be evaluated using additional information<br />
from stable isotope information of both approaches<br />
and from meteorological parameters for<br />
the annual cycle.<br />
Outlook/Future work We will follow another<br />
annual cycle of drip water samples. It is planned<br />
to study another Holocene section obtained from<br />
a different cave.<br />
Funding DFG Forschergruppe 668: ”Datierte<br />
Speläotheme: Archive der Paläoumwelt”<br />
Main publication Claussen et al. [2006]
6.1. FORSCHUNGSSTELLE “RADIOMETRIE” 167<br />
6.1.7 Precise dating of D/O-Events on a stalagmite from Socorta Island<br />
(Indian Ocean)<br />
Isabela Hoschek<br />
Abstract The stalagmite M1-2 from Socorta Island, which is located in the Indian Ocean in the<br />
sphere of influence of the monsoon, is dated with more accuracy with the 230 T h/ 234 U method. The<br />
intention is to determine a more exactly age for the Dansgaard-Oeschger-Events (D/O-events) 10, 11<br />
and 12.<br />
18 O<br />
-2,0<br />
-1,5<br />
-1,0<br />
-0,5<br />
0,0<br />
0,5<br />
1,0<br />
10 11 12<br />
0 200 400 600 800 1000<br />
Depth [mm]<br />
Figure 6.8: Oxygen-isotope ratios of stalagmite M1-2.<br />
Background Oxygen-isotope ratios of a stalagmite<br />
from Socotra Island in the Indian Ocean provide<br />
a record of changes in monsoon precipitation<br />
and climate for the time period from 42 to 55<br />
thousand years (kyr) before the present. The pattern<br />
of precipitation bears a striking resemblance<br />
to the oxygen-isotope record from Greenland ice<br />
cores, with increased tropical precipitation associated<br />
with warm periods in the high northern latitudes.<br />
The chronology of the events found in the<br />
record requires a reevaluation of previously published<br />
time scales for climate events during this<br />
period.<br />
Methods and results The 230 T h/ 234 U dating<br />
method is used to establish a depth-age model<br />
for the stalagmite M1-2. The measurements are<br />
performed with a Thermal Ionization Mass Spectrometer<br />
(TIMS). The aim of the diploma thesis is<br />
to accurately determine the age of (D/O-events)<br />
10, 11 and 12 by analysis of several samples from<br />
the same depth. This should allow (i) to calculate<br />
a more reliable age uncertainty and (ii) to reduce<br />
the analytical error. Figure 6.8 shows the oxygenisotope<br />
record for stalagmite M1-2 [Burns et al. ,<br />
2003].<br />
Outlook/Future work Not available.<br />
Funding Diploma thesis, therefore not applicable.
168 CHAPTER 6. FORSCHUNGSSTELLE “RADIOMETRIE”<br />
6.1.8 Trace element mapping of speleothems<br />
Andrea Schröder-Ritzrau (Participating scientists: Yann Lahaye, Stefan Niggemann, Detlev Richter,<br />
Dana Riechelmann, Denis Scholz , Christoph Spötl)<br />
Abstract In recent years, numerous speleothem based proxy studies have advanced understanding of<br />
annual to decadal scale climate variability. The Research Group DAPHNE is establishing a routine for<br />
speleothem LA-ICP-MS measurements in cooperation with Prof. G. Brey, head of the Mineralogical<br />
<strong>Institut</strong>e, University of Frankfurt.<br />
Figure 6.9: Ten point running mean Strontium content for two parallel profiles with a distance of 300<br />
µm. The profiles show the same general trend. But, variations in small scale cyclicity are visible.<br />
Background Trace elements (e.g. Mg, Ba, Sr,<br />
P) cycles in speleothems may provide information<br />
on past rainfall intensity [Johnson et al. , 2006;<br />
Treble et al. , 2003, e.g.]. The DAPHNE group<br />
is establishing a routine for speleothem analysis<br />
with LA-ICP-MS in cooperation with the Mineralogical<br />
<strong>Institut</strong>e in Frankfurt, Germany.<br />
Methods and results A 213nm Nd:YAG laser<br />
ablation system (UP213 from NewWave) has been<br />
coupled to an ICP-MS (Element 2 from Thermo<br />
Electron Cooperation). Measurements are performed<br />
versus the NIST 610 glass standard and<br />
data are normalized to the calcium carbonate content<br />
of the speleothem. This synthetic glass standard<br />
has been used as an external standard of<br />
reference. The calcium content of the sample has<br />
also been monitored for the correction related to<br />
matrix effect and for the calculation of the trace<br />
element concentrations. First results of trace element<br />
analysis on a Holocene stalagmite from the<br />
Bunker Cave, Iserlohn, North West Germany, are<br />
shown. The upper 28 mm of the stalagmite were<br />
investigated and correspond to the last 2000 years.<br />
Mg and Sr contents of the stalagmite are between<br />
150 and 900ppm and 14 and 42 ppm, respectively.<br />
Despite the relatively high noise in the data a general<br />
trend to rising Sr values from 25 mm to 20mm<br />
with maximum values between 18 to 12 mm is<br />
depicted. In the upper 12mm of the stalagmite<br />
Sr values are low with three visible excursion to<br />
higher values. Generally, a superimposed, small<br />
scale cyclicity is visible. However, the chronology<br />
is still tentative. Hence, we are not yet able to calculate<br />
growth rates and interpret cyclic variations<br />
in trace element content.<br />
Outlook/Future work The method will be<br />
optimized. Trace element contents of additional<br />
samples from Grotta di Ernesto, Italy, Bunker<br />
Cave, Germany and other caves will be investigated.<br />
The results will be interpreted in terms of<br />
climate variability.<br />
Funding FG DAPHNE (DFG)
6.1. FORSCHUNGSSTELLE “RADIOMETRIE” 169<br />
6.1.9 U-series dating and paleoclimatic interpretation of the stable isotope<br />
profile of stalagmite ER76 from Grotta di Ernesto, Italy<br />
Denis Scholz (Participating scientists: Christoph Spötl (Innsbruck), Silvia Frisia (Trento), Andrea<br />
Borsato (Trento), Jens Fohlmeister)<br />
Abstract Stalagmite ER76 from Grotta di Ernesto, Italy, was precisely dated by TIMS Th/Udating.<br />
The age-depth-model was constructed using a Bayesian approach to improve the dating<br />
uncertainty and applying a mixed effect regression model. Furthermore, high-resolution stable oxygen<br />
and carbon isotope profiles were determined.<br />
A g e [k y r]<br />
1 0<br />
9<br />
8<br />
7<br />
6<br />
5<br />
4<br />
3<br />
2<br />
1<br />
A g e -d e p th m o d e l (H e e g a a rd e t a l., 2 0 0 5 )<br />
9 5 % c o n fid e n c e lim its<br />
N e w U -s e rie s a g e s<br />
U -s e rie s a g e s (M c D e rm o tt e t a l., 1 9 9 9 )<br />
0<br />
0 5 0 1 0 0 1 5 0 2 0 0 2 5 0 3 0 0 3 5 0 4 0 0<br />
D is ta n c e fro m to p [m m ]<br />
Figure 6.10: Final age-depth-model calculated for stalagmite ER76<br />
Background Stalagmite ER76 from Grotta di<br />
Ernesto, Italy, was precisely dated by TIMS<br />
Th/U-dating. The age-depth-model was constructed<br />
using a Bayesian approach to improve the<br />
dating uncertainty and applying a mixed effect regression<br />
model. Furthermore, high-resolution stable<br />
oxygen and carbon isotope profiles were determined.<br />
Methods and results Nine TIMS U-series<br />
ages as well as high-resolution stable isotope profiles<br />
on stalagmite ER76 from Grotta di Ernesto,<br />
Italy, were determined. Due to its low 238 U (20-<br />
40 ng/g) content which is typical for stalagmites<br />
from Grotta di Ernesto, U-series dating of ER76<br />
is rather difficult. Nevertheless, we were able to<br />
determine a 230 Th/U-age of 2.27 0.08 kyr in the<br />
youngest part, at 30 mm distance from top (dft).<br />
However, due to the low U content, the error bars<br />
of some data points overlap significantly. By application<br />
of a Bayesian approach which takes into<br />
account both the results of the U-series dating<br />
and the stratigraphic sequence of the individual<br />
samples the uncertainty of some data points could<br />
be reduced substantially. We suggest to generally<br />
apply this Bayesian approach when the individual<br />
data point errors overlap. Overall, 13 data points,<br />
nine measured in Heidelberg and four by McDermott<br />
et al. [1999], were used to construct the final<br />
age-depth relationship for ER76. The age model<br />
and its uncertainty (see Fig. 6.10) was estimated<br />
using a mixed-effect regression model [Heegaard<br />
et al. , 2005]. Based on the new age model, ER76<br />
exhibits a rather constant growth rate of approximately<br />
0.05 mm/yr between 8.5 and 2 kyr. It<br />
was actively growing when it was collected, and<br />
Frisia et al. [2003] have shown that ER76 exhibits<br />
annual laminae in the period between 1650<br />
and 1995 AD. The thickness of these annual laminae<br />
lies between 0.02 and 0.1 mm. In combination<br />
with the new age model obtained by U-series dating<br />
this shows that there must be a substantial<br />
hiatus between 2 and 0.5 kyr in ER76. Oxygen<br />
and carbon stable isotope profiles were measured<br />
at the University of Innsbruck at a resolution of<br />
0.1 mm between 0 and 8 mm dft and 0.25 mm<br />
below 8 mm dft.<br />
Outlook/Future work An earlier study [Mc-<br />
Dermott et al. , 1999] revealed that ER76 recorded<br />
several Holocene warm/dry and cold/wet phases,<br />
respectively. Because the resolution in that study<br />
was approximately 2 mm, the new profiles have<br />
a ten times higher resolution which should enable<br />
to detect even rapid climate events.<br />
Funding DFG Forschergruppe 668: ”Datierte<br />
Speläotheme: Archive der Paläoumwelt”<br />
Main publication Vollweiler et al. [2006],<br />
Scholz & Mangini [2006], Scholz & Mangini [accepted<br />
for publication], Mangini et al. [accepted<br />
for publication]
170 CHAPTER 6. FORSCHUNGSSTELLE “RADIOMETRIE”<br />
6.1.10 Kinetic Fractionation of Stable Isotopes in Speletothems - Laboratory<br />
Experiments<br />
Daniela Polag (Participating scientists: E. Wiedner, D. Scholz, R. März, A. Schröder-Ritzrau, A.<br />
Mangini, C. Spötl, M. Segl)<br />
Abstract Many speleothems show evidence for calcite precipitation under disequilibrium conditions.<br />
To improve the understanding of these kinetic processes, laboratory experiments were carried out to<br />
study the fractionation of stable oxygen and carbon isotopes during the precipitation of calcite.<br />
Figure 6.11: Picture of the experiment setup that was used to precipitate synthetic carbonates under<br />
controlled conditions in the laboratory.<br />
Background To deduce paleoclimatic information<br />
from calcite which is precipitated under nonequilibrium-conditions<br />
it is important to understand<br />
the influence of kinetic fractionation processes<br />
for example in what extent different parameters<br />
like drip rate and temperature affecting the<br />
slope of ∆(δ 18 O/δ 13 C). In this context laboratory<br />
experiments with controlled parameters like<br />
solution composition, temperature and drip rate<br />
should help to improve the understanding of kinetic<br />
fractionation of oxygen and carbon stable<br />
isotopes with reference to natural speleothems.<br />
Methods and results The laboratory experiments<br />
are conducted in a refrigerator under 100%<br />
relative humidity and for the present in a pure<br />
nitrogen atmosphere. A mixture of two solutions<br />
(CaCl2 and NaHCO3) flows on a glass fiber<br />
stripe along a 32 ◦ dipping rod with a length of 50<br />
cm, representing the water film flowing alongside<br />
a stalagmite. The humidified nitrogen gas flushes<br />
the rod and carry along the fast degassing CO2<br />
from the solution leading to a Rayleigh fractionation<br />
within the isotope compound.<br />
First results indicate that the isotopic enrichment<br />
of δ 13 C and δ 18 O is significantly related to the<br />
solution flow speed which means that the isotopic<br />
enrichment increases with a larger drip interval.<br />
Another objective of the experiments had been<br />
the investigation on the effects of different<br />
magnesium/calcium-ratios. The magnesium distribution<br />
coefficient is an important parameter<br />
in paleoclimate investigation because of the temperature<br />
dependence of the magnesium build up.<br />
First results within this context show that the<br />
measured magnesium partitioning coefficients fit<br />
in the range of published values [Gascoyne, 1983];<br />
[Burton & Walter, 1999].<br />
Outlook/Future work For future work the influence<br />
of different experimental parameters on<br />
the enrichment of δ 13 C and δ 18 O will be tested.<br />
Experiments will be conducted under lower temperatures<br />
and slower drip rates. Besides, the fiber<br />
glass as a substrate for the precipitating calcite<br />
will be investigated and compared with other surfaces<br />
acting as a seed for calcite crystallisation.<br />
Funding DFG (DAPHNE Forschergruppe)<br />
Main publications Results from former experimental<br />
work (Elke Wiedner) are lately submitted<br />
to Quarternary International (Elsevier)
6.1. FORSCHUNGSSTELLE “RADIOMETRIE” 171<br />
6.1.11 231 Pa/ 235 U-Dating of fossil corals with AMS<br />
Kerstin Bauer (Participating scientists: Denis Scholz, Jörg Lippold)<br />
Abstract The ages of fossil reef corals from Aqaba, Jordan, and Barbados, West Indies, are determined<br />
by uranium-series dating. The samples are prepared with ion exchange chemistry and analysed<br />
by thermal ionisation mass spectrometer (TIMS) for 231 Th, 234 U, and 238 U and by accelerator mass<br />
spectometry (AMS) for 231 Pa and 235 U. The ages obtained by both methods are compared for consistency.<br />
If they differ, the coral is assumed to show open-system-behaviour.<br />
� ��� ����� ��� ��<br />
1 ,2<br />
1 ,0<br />
0 ,8<br />
0 ,6<br />
0 ,4<br />
0 ,2<br />
δ ��� � ������� ��������<br />
0 ,0<br />
0 ,0 0 ,2 0 ,4 0 ,6 0 ,8 1 ,0<br />
� ��� ����� ��� ��<br />
δ ��� � ������� ��������<br />
1 ,2 0<br />
1 ,1 5<br />
1 ,1 0<br />
1 ,0 5<br />
1 ,0 0<br />
0 ,0 0 ,2 0 ,4 0 ,6 0 ,8 1 ,0 1 ,2<br />
� ��� ����� ��� ��<br />
Figure 6.12: Concordia diagrams for the U-Th-Pa system. The straight lines show the timely development<br />
of the ( 230 Th/ 238 U), ( 234 U/ 238 U), and ( 231 Pa/ 235 U) activity ratios with an initial ( 234 U/ 238 U)<br />
activity ratio of 1.1496 (modern seawater). The red circle indicates a coral which has behaved as a<br />
closed system for 100 kyr. The dashed lines indicate the 100-kyr-closed-system isochrons.<br />
Background The main goal of U-series dating<br />
of fossil reef corals is to reconstruct past sea level<br />
changes during the last 300,000 years. Some coral<br />
species only inhabit the upper five metres below<br />
the sea surface. If their age and their location relative<br />
to the current sea level are known and if a<br />
correction for the uplift or subsidence of the land<br />
mass can be applied, the change of the sea level<br />
can be calculated. It is an established procedure<br />
to determine the age of carbonates by measuring<br />
the ratio between 238 U and its decay series daughters<br />
230 Th and 234 U. This has been done with the<br />
TIMS of the group for several years. Still, the<br />
age of a coral determined by this method can be<br />
inaccurate due to open system behaviour and geochemical<br />
processes of isotope mobilization which<br />
alter the activity ratios which are used for dating.<br />
Numerous criteria to identify diagenetically<br />
altered corals can be applied. In addition, several<br />
so-called open-system models have been developed<br />
to correct the diagenetic changes and calculate<br />
the true coral age [Scholz, 2005]. The subject<br />
of this diploma thesis is another access to validate<br />
the accuracy of fossil coral ages: the decay<br />
� ��� ���� ��� ��<br />
of 235 U to 231 Pa, which provides a second ”clock”.<br />
Methods and results The 231 Pa/ 235 U dating<br />
method can be applied for the last 250,000 years<br />
and in this timeframe it can be compared with<br />
the results of 238 U/ 230 Th method. If the coral behaved<br />
as a closed system, both ages should be concordant<br />
and different ages of a coral system should<br />
plot on a concordia line (see Fig. 6.12). This technique<br />
is planned to be tested on corals collected at<br />
Barbados (West Indies) and Aqaba (Jordan, Red<br />
Sea). Thereby the dating with 231 Pa is associated<br />
with some difficulties as there must be a different<br />
chemical sample preparation. In addition, there<br />
is no long-living isotope which can be used as a<br />
spike. The only possibility is to use 233 Pa (t 1/2<br />
= 26,97 d) which must be separated shortly before<br />
the measurement from a Np mother. Furthermore,<br />
the abundance of Pa is lower than that of<br />
Th and is not measured at the local TIMS, but at<br />
an AMS at the ETH in Zuerich, Switzerland.<br />
Funding Diploma thesis, therefore not applicable.
172 CHAPTER 6. FORSCHUNGSSTELLE “RADIOMETRIE”<br />
6.1.12 Reconstruction of the geomagnetic field strength over the past<br />
300.000 years derived from 10 Be data of deep sea sediments from<br />
the North and South Atlantic Ocean<br />
Frank Bernsdorff<br />
Abstract In this project we use the anti correlation between the 10 Be production in the earths<br />
stratosphere via galactic cosmic rays and the strength of the geomagnetic field to determine its variation<br />
over a time period of 300.000 years. Hence two deep sea sediment cores (ODP) from the Atlantic<br />
Ocean, which act as 10 Be archives are investigated.<br />
Figure 6.13: Schematic pathway of the production and deposition of cosmogenic 10 Be<br />
Background The cosmogenic nuclide 10 Be is<br />
mainly produced in the lower stratosphere by<br />
inter-action of galactic cosmic rays with oxygen<br />
and nitrogen atoms, and its production is<br />
known to be strongly anti-correlated with the<br />
solar- and/or geomagnetic field strength. After a<br />
short atmospheric residence time of about 1 year<br />
10 Be is removed from this part of the atmosphere<br />
and deposited onto land, ice sheets and (mainly)<br />
the ocean surface. Therefore it should be possible<br />
to extract a record of geomagnetic paleointensity<br />
(GPI) from depositional profiles of these radionuclides<br />
in marine, terrestrial and ice core archives.<br />
In this study we are investigating two deep sea<br />
sediment cores from the North and Northwest Atlantic<br />
Ocean (ODP-Site 983 and ODP-Site 1063)<br />
for highly resolved 10 Be profiles. The application<br />
of a special correction procedure (involving uranium<br />
and thorium measurements) is indispensable<br />
to quantify the transport of 10 Be in the ocean, so<br />
that the global 10 Be-production can be extracted<br />
from marine records. Based on these profiles, a<br />
marine 10 Be stratigraphy will be developed that<br />
can be matched with 10 Be records from Greenland<br />
(GRIP, GISP II) and Antarctic (EPICA) ice<br />
cores.<br />
Methods and results In addition to the above<br />
specified goals a new analytical technique had to<br />
be developed and applied for the uranium and<br />
thorium measurements to get more precise data<br />
sets in shorter times (compared to Alpha spec-<br />
trometry). This was implemented by the application<br />
of an ICP-SF-MC-MS (Inductively Coupled<br />
Plasma Sector Field Multi Collector Mass Spectrometer)<br />
for the uranium and thorium measurements.<br />
To assure consistent data sets different<br />
standard materials (e.g. certified standard solutions<br />
of thorium and uranium isotopes as well as<br />
deep sea sediment samples of known isotopic composition)<br />
were tested intensively. After these initial<br />
experiments we could assure the quality of<br />
the following measurements concerning the deep<br />
sea sediment cores: ODP 983 and 1063. Those<br />
data sets will be processed and evaluated within<br />
the next month.<br />
Nevertheless, first results of the 230 Th xs(0) corrected<br />
data sets of 10 Be are showing already that<br />
we are able to reconstruct at least the LaChampand<br />
Jamaica Event.<br />
Outlook/Future work Outlook/Future work<br />
According to the goals of this project the future<br />
work will mainly comprise 10 Be measurements of<br />
the deep sea sediments from ODP site 983 and<br />
1063, its normalisation to 230 Th xs(0) and comparison<br />
to the data set of ODP site 1089 (South<br />
Atlantik).<br />
Funding DFG Schwerpunktprogramm: Integrated<br />
Ocean Drilling Program/Ocean Drilling<br />
Program (IODP/ODP); (SPP 527)<br />
Main publication Muscheler et. al [2005]
6.1. FORSCHUNGSSTELLE “RADIOMETRIE” 173<br />
References<br />
Beer, J., Mende, W., & Stellmacher, R. 2000. The role of the sun in climate forcing. Quaternary<br />
Science Reviews, 19, 403–415.<br />
Björck, S., Rittenour, T., Rosén, P., Franca, Z., Mller, P., Snowball, I., Wastegard, S., O., Bennike,<br />
& B., Kromer. 2006. A Holocene lacustrine record in the central North Atlantic: proxies for volcanic<br />
activity, short-term NAO mode variability, and long-term precipitation changes. Quarternary<br />
Science Reviews, 25, 9–32.<br />
Bond, Gerard, Kromer, Bernd, Beer, Juerg, Muscheler, Raimund, Evans, Mike, Showers, William,<br />
Hoffmann, Sharon, Lotti-Bond, Rusty, Hajdas, Irka, & Bonani, Georges. 2001. Persistent Solar<br />
Influence on North Atlantic Surface Circulation During the Holocene. Science, 294(2130-2136).<br />
Braun, H. 2006. A new hypothesis for the 1470-year cycle of abrupt warming events in the last ice-age.<br />
Ph.D. thesis, <strong>Ruprecht</strong>-<strong>Karls</strong>-University, Heidelberg.<br />
Braun, H., Christl, M., Rahmstorf, S., Ganopolski, A., Mangini, A., Kubatzki, C., Roth, K., &<br />
Kromer, B. 2005. Possible solar origin of the glacial 1,470-year glacial climate cycle demonstrated<br />
in a coupled mode. Nature, 438, 208 – 211.<br />
Burns, S., Fleitmann, D., Matter, A., Kramers, J., & Al-Subbary, A. 2003. Indian Ocean Climate and<br />
an Absolute Chronology over Dansgaard/Oeschger Events 9 to 13. Science, 301, 1365–1367.<br />
Burns, S.J., Fleitmann, D., Mudelsee, M., Neff, U., Matter, A., & Mangini, A. 2002. A 780-year<br />
annually resolved record of Indian Ocean monsoon precipitation from a speleothem from south<br />
Oman. Journal of Geophysical Research, 107(D20), doi:10.1029/2001JD001281.<br />
Burton, E.A., & Walter, L.M. 1999. The effects of PCO2 and temperature on magnesium incorporation<br />
in calcite on seawater and MgCl2-CaCl2 solutions. Geochimica et Cosmochimica Acta, 55, 777 –<br />
785.<br />
Claussen, M., Fohlmeister, J., Ganopolski, A., & Brovkin, V. 2006. Vegetation Dynamics Amplifies<br />
Precessional Forcing. Geophys. Res. Lett., 33.<br />
Eddy, J. 1976. The mounder minimum. Science, 192, 1189–1202.<br />
Eitel, B., Hecht, S., Mchtle, B., Schukraft, G., Kadereit, A., Wagner, G. A., Kromer, B., Unkel, I., &<br />
Reindel, M. 2005. Geoarchaeological evidence from desert loess in the Nazca/Palpa region, Southern<br />
Peru: Palaeoenvironmental changes and their impact on Pre-Columbian cultures. Archaeometry,<br />
47(1), 137–158.<br />
Fleitmann, D., Burns, S.J., Mudelsee, M., Neff, U., Kramers, J., Mangini, A., & Matter, A. 2003.<br />
Holocene Forcing of the Indian Monsoon Recorded in a Stalagmite from Southern Oman. Science,<br />
300(5626), 1737–1739.<br />
Frank, N., Kober, B., & Mangini, A. 2006. Carbonate precipitation, U-series dating, and U.isotopic<br />
variations in a Holocene Travertine Platform at Bad Langensalza- Thuringian Basin. Quaternaire,<br />
17(4), 321–330.<br />
Friedrich, Michael, Remmele, Sabine, Kromer, Bernd, Hofmann, Jutta, Spurk, Marco, Kaiser,<br />
Klaus Felix, Orcel, Christian, & Kppers, Manfred. 2004. The 12,460-Year Hohenheim Oak and<br />
Pine Tree-Ring Chronology from Central Europe - a Unique Annual Record for Radiocarbon Calibration<br />
and Paleoenvironment Reconstructions. Radiocarbon, 46(3), 1111–1122.<br />
Friedrich, W. L., Kromer, B., Friedrich, M., Heinemeier, J., Pfeiffer, T., & S., Talamo. 2006. Santorini<br />
Eruption Radiocarbon Dated to 1627-1600 B.C. Science, 312, 548.<br />
Frisia, S., Borsato, A., Preto, N., & McDermott, F. 2003. Late Holocene Annual Growth in Three<br />
Alpine Stalagmites Records the Influence of Solar Activity and the North Atlantic Oscillation on<br />
Winter Climate. EPSL, 216, 411 – 424.<br />
Frisia, S., Borsato, A., Mangini, A., Sptl, C., Madonia, G., & Sauro, U. 2006. Holocene climate<br />
variability in Sicily from a discontinuous stalagmite record and the Mesolithic to Neolithic transition.<br />
Quaternary Research, 66, 388–400.
174 CHAPTER 6. FORSCHUNGSSTELLE “RADIOMETRIE”<br />
Gascoyne, M. 1983. Trace element partition coefficients in the calcite-water system and their paleoclimatic<br />
significance in cave studies. Journal of Hydrology, 61, 213 – 222.<br />
Heegaard, E., Birks, H. J. B., & Telford, R. J. 2005. Relationships between calibrated ages and depth<br />
in stratigraphical sequences: an estimation procedure by mixed-effect regression. The Holocene,<br />
15(4), 612 – 618.<br />
Hendy, C.H. 1971. The Isotopic Geochemistry of Speleothems – I. The Calculation of the Effects of<br />
Different Modes of Formation on the Isotopic Composition of Speleothems and Their Applicability<br />
as Palaeoclimatic Indicators. Geochimica et Cosmochimica Acta, 35, 801 – 824.<br />
Hodell, D.A., Brenner, M., Curtis, J.H., & Guilderson, T. 2001. Solar Forcing of Drought Frequency<br />
in the Maya Lowlands. Science, 292, 1367–1370.<br />
Hughen, Konrad A, Baillie, Mike G L, Bard, Edouard, Beck, J Warren, Bertrand, Chanda J H,<br />
Blackwell, Paul G, Buck, Caitlin E, Burr, George S, Cutler, Kirsten B, Damon, Paul E, Edwards,<br />
Richard L, Fairbanks, Richard G, Friedrich, Michael, Guilderson, Thomas P, Kromer, Bernd, Mc-<br />
Cormac, Gerry, Manning, Sturt, Ramsey, Christopher Bronk, Reimer, Paula J, Reimer, Ron W,<br />
Remmele, Sabine, Southon, John R, Stuiver, Minze, Talamo, Sahra, Taylor, F W, Plicht, Johannes<br />
van der, & Weyhenmeyer, Constanze E. 2004. Marine04 Marine Radiocarbon Age Calibration, 0-26<br />
Cal Kyr BP. Radiocarbon, 46(3), 1059–1086.<br />
Joerin, U.E., Stocker, T.F., & Schlüchter, C. 2006. Multicentury glacier fluctuations in the Swiss Alps<br />
during the Holocene. The Holocene, 16, 697 – 704.<br />
Johnson, K.R., Hu, C., Belshaw, N.S., & Henderson, G.M. 2006. Seasonal trace-element and stableisotope<br />
variations in a Chinese speleothem The potential for high-resolution paleomonsoon reconstruction.<br />
Earth and Planetary Science Letters, 244, 394 – 407.<br />
Kilian, R., Biester, H., Behrmann, J., Baeza, O., Fesq-Martin, M., Hohner, M., Schimpf, D., Friedmann,<br />
A., & Mangini, A. 2006. Millennium-scale volcanic impact on a superhumid and pristine<br />
ecosystem. Geology, 34(8), 609–612.<br />
Kromer, B., Korfmann, M., & Jablonka, P. 2002. Heidelberg radiocarbon dates for Troia I to VIII<br />
and Kumtepe. Pages 43–54 of: Wagner, G. (ed), Troia and the Troad. Heidelberg: Springer.<br />
Kromer, B., Friedrich, M., Hughen, K.A., Kaiser, F., Remmele, S., Schaub, M., & Talamo, S. 2004.<br />
Late Glacial 14C ages from a floating 1382-ring pine chronology. Radiocarbon, 46(3), 1203–1209.<br />
Labitzke, K., & Loon, H. 1992. Association between the 11-Year Solar Cycle and the Atmosphere.<br />
Part V: Summer. Journal of Climate, 5, 240–251.<br />
Latuske, N. 2006. Solare Variabilitt und Klimaänderungen auf einer Zeitskala von einigen Dekaden<br />
bis Jahrhunderten im Holozän. Ph.D. thesis, <strong>Ruprecht</strong>-<strong>Karls</strong>-University, Heidelberg.<br />
Levin, Ingeborg, & Kromer, Bernd. 2004. The Tropospheric 14 CO2 level in Mid-Latitudes of the<br />
Northern Hemisphere (1959-2003). Radiocarbon, 46(3), 1261–1272.<br />
Mangini, A., Verdes, P., Sptl, C., Scholz, D., Vollweiler, N., & Kromer, B. accepted for publication.<br />
Persistent influence of the North Atlantic hydrography on Central European winter temperature<br />
during the last 9,000 years. Geophysical Research Letters.<br />
Manning, Sturt W., Kromer, Bernd, Kuniholm, Peter Ian, & Newton, M. W. 2001. Anatolian treerings<br />
and a new chronology for the east Mediterranean Bronze-Iron Ages. Science, 294(2532-2535).<br />
Manning, Sturt W., Kromer, B., Kuniholm, P.I., & Newton, M. W. 2003. Confirmation of nearabsolute<br />
dating of east Mediterranean Bronze-Iron Dendrochronology. Antiquity, 77(295).<br />
Manning, S.W., Ramsey, C.B., Kutschera, W., Higham, T., Kromer, B., Steier, P., & E.M., Wild.<br />
2006. Chronology for the Aegean Late Bronze Age 1700-1400 B.C. Science, 312, 565–569.<br />
McDermott, F., Frisia, S., Huang, Y., Longinelli, A., Spiro, B., Heaton, T. H. E., Hawkesworth, C. J.,<br />
Borsato, A., Keppens, E., Fairchild, I. J., van der Borg, K., Verheyden, S., & Selmo, E. M. 1999.<br />
Holocene climate variability in Europe: Evidence from δ 18 O, textural and extension-rate variations<br />
in three speleothems. Quaternary Science Reviews, 18, 1021 – 1038.
6.1. FORSCHUNGSSTELLE “RADIOMETRIE” 175<br />
Mühlinghaus, C. 2006. Modellierung paläoklimatischer Parameter anhand Wachstum und Isotopiekorrelationen<br />
von Stalagmiten. Diploma thesis, Heidelberg University.<br />
Muscheler et. al. 2005. Geomagnetic field intensity during the last 60,000 years based on 10 Be and<br />
36 Cl from the Summit ice cores and 14 C. Quaternary Science Reviews.<br />
Neff, U., Burns, S.J., Mangini, A., Mudelsee, M., Fleitmann, D., & Matter, A. 2001. Strong coherence<br />
between solar variability and the monsoon. Nature, 411, 290–293.<br />
Ney, E.P. 1959. Cosmic radiation and weather. Nature, 183, 451.<br />
Niggemann, S., Mangini, A., Mudelsee, M., Richter, D.K., & Wurth, G. 2003. Sub-Milankovitch<br />
climatic cycles in Holocene stalagmites from Sauerland, Germany. Earth and Planetary Science<br />
Letters, 6844, 1–9.<br />
Reimer, Paula J, Baillie, Mike G L, Bard, Edouard, Bayliss, Alex, Beck, J Warren, Bertrand, Chanda<br />
J H, Blackwell, Paul G, Buck, Caitlin E, Burr, George S, Cutler, Kirsten B, Damon, Paul E,<br />
Edwards, R Lawrence, Fairbanks, Richard G, Friedrich, Michael, Guilderson, Thomas P, Hogg,<br />
Alan G, Hughen, Konrad A, Kromer, Bernd, McCormac, Gerry, Manning, Sturt, Ramsey, Christopher<br />
Bronk, Reimer, Ron W, Remmele, Sabine, Southon, John R, Stuiver, Minze, Talamo, Sahra,<br />
Taylor, F W, Plicht, Johannes van der, & Weyhenmeyer, Constanze E. 2004. INTCAL04 terrestrial<br />
radiocarbon age calibration, 0-26 cal kyr BP. Radiocarbon, 46(3), 1029–1058.<br />
Schaub, Matthias, Kaiser, Klaus F., Kromer, Bernd, & Talamo, Sahra. 2005. Extension of the Swiss<br />
Lateglacial tree-ring chronologies. Dendrochronologia, doi:10.1016.<br />
Schimpf, D. 2005. Datierung und Interpretation der Kohlenstoff- und Sauerstoffisotopie zweier<br />
holozäner Stalagmiten aus dem Süden Chiles (Patagonien). M.Phil. thesis, <strong>Ruprecht</strong>-<strong>Karls</strong>-<br />
University, Heidelberg.<br />
Scholz, D. 2005. U-series dating of diagenetically altered fossil reef corals and the application for sea<br />
level reconstructions. Ph.D. thesis, <strong>Ruprecht</strong>-<strong>Karls</strong>-University, Heidelberg.<br />
Scholz, D., & Mangini, A. 2006. U-redistribution in fossil reef corals from Barbados, West Indies, and<br />
sea level reconstruction for MIS 6.5. The climate of past Interglacials. in press.<br />
Scholz, D., & Mangini, A. accepted for publication. The uncertainty of coral isochron ages. Quaternary<br />
Geochronology.<br />
Solanki, S. K., Usoskin, I. G., Kromer, B., Schssler, M., & Beer, J. 2004. Unusual activity of the Sun<br />
during recent decades compared to the previous 11,000 years. Nature, 431, 1084–1087.<br />
Soon, W.H., Posmentier, E.S., & Baliunas, S.L. 2000. Climate hypersensitivity to solar forcing?<br />
Annales Geophysicae, 18, 583–588.<br />
Spötl, C., & Mangini, A. 2005. Altersbestimmungen an Griffner Tropfsteinen. Page 336pp of: Komposch,<br />
C., & Wieser, C. (eds), Schlossberg Griffen: Klagenfurt. Verlag des Naturwissenschaftlichen<br />
Vereins fr Kärnten.<br />
Spötl, C., & Mangini, A. 2006. U/Th age constraints on the absence of ice in the central Inn Valley<br />
(eastern Alps, Austria) during Marine Isotope Stages 5c to 5a. Quaternary Research, 66, 167–175.<br />
Spötl, C., Mangini, A., & Richards, D.A. 2006. Chronology and paleoenvironment of Marine Isotope<br />
Stage 3 from two high-elevation speleothems, Austrian Alps. Quaternary Science Reviews, 25,<br />
1127–1136.<br />
Svensmark, H., & Friis Christensen, E. 1997. Variation of cosmic ray flux and global cloud coverage-a<br />
missing link in solar-climate relationships. J. Atmos. Terr. Phys, 59, 1225–1232.<br />
Treble, P., Shelley, J.M.G., & Chappell, J. 2003. Comparison of high resolution sub-annual records of<br />
trace elements in a modern (1911-1992) speleothem with instrumental climate data from southwest<br />
Australia. Earth and Planetary Science Letters, 216, 141 – 153.<br />
Unkel, I. 2006. AMS- 14 C-Analysen zur Rekonstruktion der Landschafts- und Kulturgeschichte in der<br />
Region Palpa (S-Peru). Ph.D. thesis, <strong>Ruprecht</strong>-<strong>Karls</strong>-University, Heidelberg.
176 CHAPTER 6. FORSCHUNGSSTELLE “RADIOMETRIE”<br />
Usoskin, I.G., Solanki, S.K., Kovaltsov, G.A., Beer, J., & Kromer, B. 2006. Solar proton events in<br />
cosmogenic isotope data. Geophys. Res. Lett., 33.<br />
Usoskin, Ilya G, & Kromer, Bernd. 2005. Reconstruction of the 14 C Production Rate from Measured<br />
Relative Abundance. Radiocarbon, 47(1), 31–37.<br />
Vollweiler, N. 2005. Stalagmiten aus der Spannagel-Höhle bei Hintertux (Tirol, Österreich) - Archive<br />
<strong>für</strong> das Klima der Alpen im Holozän. Diploma thesis, Heidelberg University.<br />
Vollweiler, N., Scholz, D., Mühlinghaus, C., Mangini, A., & Spötl, C. 2006. A precisely dated climate<br />
record for the last 9 kyr from three high alpine stalagmites, Spannagel Cave, Austria. Geophysical<br />
Research Letters, 33, L20703.
Bibliography<br />
177
7.1. PEER REVIEWED PUBLICATIONS 179<br />
Peer Reviewed Publications<br />
Aeschbach-Hertig, W. 2006. Rebuttal of ”‘On global forces of nature driving the Earth’s climate. Are<br />
humans involved?”’. Env. Geol. DOI 10.1007/s00254-006-0519-3.<br />
Aeschbach-Hertig, W., Holzner, C. P., Hofer, M., Simona, M., Barbieri, A., & Kipfer, R. 2007. A<br />
time series of environmental tracer data from deep meromictic Lake Lugano, Switzerland. Limnol.<br />
Oceanogr., 52, 257 – 273.<br />
Aiuppa, A., Franco, A., von Glasow, R., Allen, A. G., D’Alessandro, W., Mather, T. A., Pyle, D. M.,<br />
& Valenza, M. 2006. The tropospheric processing of acidic gases and hydrogen sulphide in volcanic<br />
gas plumes as inferred from field and model investigations. Atmos. Chem. Phys. Discuss., 6, 11653<br />
– 11680.<br />
Allen, G., Mather, T.A., McGonigle, A.J.S., Aiuppa, A., Delmelle, P., Davison, B., Bobrowski,<br />
N., Oppenheimer, C., Pyle, D.M., & Inguaggiato, S. 2006. Sources, size distribution and downwind<br />
grounding of aerosols from Mt. Etna. Journal of Geophysical Research, 111(D10302).<br />
doi:10.1029/2005JD006015.<br />
Beirle, S., Spichtinger, N., Stohl, A., Cummins, K. L., Turner, T., Boccippio, D., Cooper, O. R., Wenig,<br />
M., Grzegorski, M., Platt, U., & Wagner, T. 2006. ESTIMATING THE NOx PRODUCED BY<br />
LIGHTNING FROM GOME AND NLDN DATA: A CASE STUDY IN THE GULF OF MEXICO.<br />
Atmos. Chem. Phys., 6, 10751089.<br />
Bergamaschi, P., Frankenberg, C., Meirink, J. F., Kroll, M., Dentener, F., Wagner, T., Platt, U., Kaplan,<br />
J. O., Körner, S., Heimann, M., Dlugokencky, E. J., & Goede, A. 2006. SATELLITE CHAR-<br />
TOGRAPHY OF ATMOSPHERIC METHANE FROM SCIAMACHY ONBOARD ENVISAT: (II)<br />
EVALUATION BASED ON INVERSE MODEL SIMULATIONS. J. Geophys. Res., accepted.<br />
Bigler, M., Rthlisberger, R., Lambert, F., Stocker, T.F., & Wagenbach, D. 2006. Aerosol deposited<br />
in East Antarctica over the last glacial cycle: Detailed apportionment of continental and sea-salt<br />
contributions. Journal of Geophysical Research, 111, (8)(D08205).<br />
Björck, S., Rittenour, T., Rosén, P., Franca, Z., Mller, P., Snowball, I., Wastegard, S., O., Bennike,<br />
& B., Kromer. 2006. A Holocene lacustrine record in the central North Atlantic: proxies for volcanic<br />
activity, short-term NAO mode variability, and long-term precipitation changes. Quarternary<br />
Science Reviews, 25, 9–32.<br />
Bobrowski, N., von Glasow, R., Aiuppa, A., Inguaggiato, S., Louban, I., Ibrahim, O. W., & Platt, U.<br />
2006a. Halogen Chemistry in Volcanic Plumes. J. Geophys. Res., in press.<br />
Bobrowski, N., Hönninger, G., Lohberger, F., & Platt, U. 2006b. I-DOAS: A new monitoring technique<br />
to study the 2D distribution of volcanic gas emissions. Journal of Volcanology and Geothermal<br />
Research, 150(4), 329–338.<br />
Bobrowski, N., Glasow, R.v., Aiuppa, A., Inguaggiato, S., Louban, I., Ibrahim, O.W., & Platt,<br />
U. 2006c. Reactive Halogen Chemistry in Volcanic Plumes. Journal of Geophysical Research.<br />
accepted,2006JD007206.<br />
Braun, H., Christl, M., Rahmstorf, S., Ganopolski, A., Mangini, A., Kubatzki, C., Roth, K., &<br />
Kromer, B. 2005. Possible solar origin of the glacial 1,470-year glacial climate cycle demonstrated<br />
in a coupled mode. Nature, 438, 208 – 211.<br />
Bruns, M., Buehler, S.A., Burrows, J.P., Richter, A., Rozanov, A., Wang, P., Heue, K.-P., Platt, U.,<br />
Pundt, I., & Wagner, T. 2006a. NO2 Profile retrieval using airborne multi axis UV-visible skylight<br />
absorption measurements over central Europe. Atmospheric Chemistry and Physics, 6, 3049–3058.<br />
Bruns, M., Buehler, S. A., Burrows, J. P., Richter, A., Rozanov, A., Wang, P., Heue, K.-P., Platt, U.,<br />
Pundt, I., & Wagner, T. 2006b. NO2 PROFILE RETRIEVAL USING AIRBORNE MULTI AXIS<br />
UV-VISIBLE SKYLIGHT ABSORPTION MEASUREMENTS OVER CENTRAL EUROPE. Atmos.<br />
Chem. Phys., 6, 3049–3058.<br />
Butz, A., Bösch, H., Camy-Peyret, C., Chipperfield, M. P., Dorf, M., G., Dufour, Grunow, K., Jeseck,<br />
P., Kühl, S., Payan, S., Pepin, I., Pukite, J., Rozanov, A., von Savigny, C., Sioris, C., Weidner,<br />
F., & Pfeilsticker, K. 2006a. Inter-comparison of stratospheric O3 and NO2 abundances retrieved<br />
from balloon borne direct sun observations and Envisat/SCIAMACHY limb measurements. Atmos.<br />
Chem. Phys., 6, 1293–1314.
180 CHAPTER 7. BIBLIOGRAPHY<br />
Butz, A., Bösch, H., Camy-Peyret, C., Chipperfield, M., Dorf, M., Dufour, G., Grunow, K., Jeseck,<br />
P., Kühl, S., Payan, S., Pepin, I., Pukite, J., Rozanov, A., von Savigny, C., Sioris, C., Wagner, T.,<br />
Weidner, F., & Pfeilsticker, K. 2006b. INTER-COMPARISON OF STRATOSPHERIC O3 AND<br />
NO2 ABUNDANCES RETRIEVED FROM BALLOON BORNE DIRECT SUN OBSERVATIONS<br />
AND ENVISAT/SCIAMACHY LIMB MEASUREMENTS. Atmos. Chem. Phys., 6, 1293–1314.<br />
Claussen, M., Fohlmeister, J., Ganopolski, A., & Brovkin, V. 2006. Vegetation Dynamics Amplifies<br />
Precessional Forcing. Geophys. Res. Lett., 33.<br />
Dils, B., De Maziere, M., Blumenstock, T., Buchwitz, M., de Beek, R., Demoulin, P., Duchatelet, P.,<br />
Fast, H., Frankenberg, C., Gloudemans, A., Griffith, D., Jones, N., Kerzenmacher, T., Kramer, I.,<br />
Mahieu, E., Mellqvist, J., Mittermeier, R. L., Notholt, J., Rinsland, C. P., Schrijver, H., Smale,<br />
D., Strandberg, A., Straume, A. G., Stremme, W., Strong, K., Sussmann, R., Taylor, J., van den<br />
Broek, M., Wagner, T., Warneke, T., Wiacek, A., & Wood, S. 2006. COMPARISONS BETWEEN<br />
SCIAMACHY AND GROUND-BASED FTIR DATA FOR TOTAL COLUMNS OF CO, CH4, CO2<br />
AND N2O. Atmos. Chem. Phys., 6, 1953–1976.<br />
Dorf, M., Bösch, H., Butz, A., Camy-Peyret, C., Chipperfield, M. P., Engel, A., Goutail, F., Grunow,<br />
K., Hendrick, F., Hrechanyy, S., Naujokat, B., Pommereau, J.-P., Van Roozendael, M., Sioris, C.,<br />
Stroh, F., Weidner, F., & Pfeilsticker, K. 2006a. Balloon-borne stratospheric BrO measurements:<br />
Comparison with Envisat/SCIAMACHY BrO limb profiles. Atmos. Chem. Phys., 6, 2483–2501.<br />
Dorf, M., Butler, J. H., Butz, A., Camy-Peyret, C., Chipperfield, M. P., Kritten, L., Montzka, S. A.,<br />
Simmes, B., Weidner, F., & Pfeilsticker, K. 2006b. Long-term observations of stratospheric bromine<br />
reveal slow down in growth. Geophys. Res. Lett., 33, L24803. doi:10.1029/2006GL027714.<br />
Edmunds, W. M., Ma, J.Z., Aeschbach-Hertig, W., Kipfer, R., & Darbyshire, D.P.F. 2006. Groundwater<br />
recharge history and hydrogeochemical evolution in the Minqin Basin, North West China.<br />
Appl. Geochem., 21, 2148–2170.<br />
Engel, A., Möbius, T., Haase, H.-P., Bönisch, H., Wetter, T., Schmidt, U., Levin, I., Reddmann, T.,<br />
Oelhaf, H., Wetzel, G., Grunow, K., Huret, N., & Pirre, M. 2006. Observation of mesospheric air<br />
inside the arctic stratospheric polar vortex in early 2006. Atmos. Chem. Phys., 6, 267–282.<br />
EPICA Community Members. 2006. One-to-one coupling of glacial climate variability in Greenland<br />
and Antarctica. Nature, 444(195).<br />
Falkenroth, Achim, Degreif, Kai, & Jähne, Bernd. 2007. Visualisation of Oxygen Concentration<br />
Fields in the Mass Boundary Layer by Fluorescence Quenching. In: Garbe, C.S., Handler, R.A., &<br />
Jähne, B. (eds), Transport at the Air Sea Interface - Measurements, Models and Parameterizations.<br />
Springer Verlag, this volume.<br />
Feng, W., Chipperfield, M. P., Dorf, M., & Pfeilsticker, K. 2006. Mid-latitude Ozone Changes: Studies<br />
with a 3-D CTM Forced by ERA-40 Analyses. Atmos. Chem. Phys. Discuss., 6, 6695–6722.<br />
Frank, N., Kober, B., & Mangini, A. 2006. Carbonate precipitation, U-series dating, and U.isotopic<br />
variations in a Holocene Travertine Platform at Bad Langensalza- Thuringian Basin. Quaternaire,<br />
17(4), 321–330.<br />
Frankenberg, C., Meirink, J. F., Bergamaschi, P., Goede, A., Heiman, M., Körner, S., Platt, U., van<br />
Weele, M., & Wagner, T. 2006. SATELLITE CHARTOGRAPHY OF ATMOSPHERIC METHANE<br />
FROM SCIAMACHY ON BOARD ENVISAT: ANALYSIS OF THE YEARS 2003 AND 2004. J.<br />
Geophys. Res., 111, D07303, doi:10.1029/2005JD006235.<br />
Friedrich, W. L., Kromer, B., Friedrich, M., Heinemeier, J., Pfeiffer, T., & S., Talamo. 2006. Santorini<br />
Eruption Radiocarbon Dated to 1627-1600 B.C. Science, 312, 548.<br />
Frieler, K., Rex, M., Salawitch, R. J., Canty, T., Streibel, M., Stimpfle, R. M., Pfeilsticker, K., Dorf,<br />
M., Weisenstein, D. K., & Godin-Beekmann, S. 2006. Towards a better quantitative understanding<br />
of polar stratospheric ozone loss. Geophys. Res. Lett., 22. doi:10.1029/2005GL025466.<br />
Frieß, U., Monks, P.S., Remedios, J.J., Rozanov, A., Sinreich, R., Wagner, T., & Platt, U. 2006.<br />
MAX-DOAS O4 measurements: A new technique to derive information on atmospheric aerosols.<br />
(II) Modelling studies. Journal of Geophysical Research, 111(D14203). doi:10.1029/2005JD006618.
7.1. PEER REVIEWED PUBLICATIONS 181<br />
Frie, F., Monks, P. S., Remedios, J. J., Rozanov, A., Sinreich, R., Wagner, T., & Platt, U. 2006.<br />
MAX-DOAS O4 MEASUREMENTS: A NEW TECHNIQUE TO DERIVE INFORMATION ON<br />
ATMOSPHERIC AEROSOLS. (II) MODELLING STUDIES. J. Geophys. Res., 111, D14203,<br />
doi:10.1029/2005JD006618.<br />
Frins, E., Bobrowski, N., Platt, U., & Wagner, T. 2006a. TOMOGRAPHIC MAX-DOAS OBSERVA-<br />
TIONS OF SUN ILLUMINATED TARGETS: A NEW TECHNIQUE PROVIDING WELL DE-<br />
FINED ABSORPTION PATHS IN THE BOUNDARY LAYER. Applied Optics, 45, 6227–6240.<br />
Frins, E., Bobrowski, N., Platt, U., & Wagner, T. 2006b. Tomographic multiaxis-differential optical<br />
absorption spectroscopy observations of Sun-illuminated targets: a technique providing well-defined<br />
absorption paths in the boundary layer. Applied Optics, 45(24), 6227–6240.<br />
Frisia, S., Borsato, A., Mangini, A., Sptl, C., Madonia, G., & Sauro, U. 2006. Holocene climate<br />
variability in Sicily from a discontinuous stalagmite record and the Mesolithic to Neolithic transition.<br />
Quaternary Research, 66, 388–400.<br />
Gamnitzer, U., Karstens, U., Kromer, B., Neubert, R. E M., Meijer, H. A. J., Schroeder, H., & Levin,<br />
I. 2006. Carbon monoxide: A quantitative tracer for fossil fuel CO2? J. Geophys. Res., 111,<br />
D22302, doi:10.1029/2005JD006966.<br />
Garbe, C. S., Handler, R. A., & Jähne, B. 2007. Transport at the Air Sea Interface - Measurements,<br />
Models and Parameterizations. Springer. Accepted for publication.<br />
Grzegorski, M., Wenig, M., Platt, U., Stammes, P., Fournier, N., & Wagner, T. 2006. THE HEIDEL-<br />
BERG ITERATIVE CLOUD RETRIEVAL UTILITIES (HICRU) AND ITS APPLICATION TO<br />
GOME DATA. Atmos. Chem. Phys., 6, 4461–4476.<br />
Hartl, A., Song, B.C., & Pundt, I. 2006. 2-D reconstruction of atmospheric concentration peaks from<br />
horizontal long path DOAS tomographic measurements: parametrisation and geometry within a<br />
discrete approach. Atmospheric Chemistry and Physics, 6, 847–861.<br />
Hendrick, F., Van Roozendael, M., Kylling, A., Petritoli, A., Rozanov, A., Sanghavi, S., Schofield,<br />
R., von Friedeburg, C., Wagner, T., Wittrock, F., Fonteyn, D., & De Maziere, M. 2006. BrO<br />
PROFILING FROM GROUND-BASED DOAS OBSERVATIONS: NEW TOOL FOR THE EN-<br />
VISAT/SCIAMACHY VALIDATION. Atmos. Chem. Phys., 6, 93–108.<br />
Jähne, B., Popp, C., Schimpf, U., & Garbe, C. S. 2007. The Influence of Intermittency on Air/Water<br />
Gas Transfer Measurements. In: Garbe, C.S, Handler, R. A., & Jhne, B. (eds), Transport at the Air<br />
Sea Interface-Measurements, Models and Parameterizations. Springer. Accepted for Publication.<br />
Jehle, M., & Jähne, B. A novel method for spatio-temporal analysis of flows close to free water<br />
surfaces. Experiments in Fluids, Special Issue for ISFV12.<br />
Jehle, M., & Jähne, B. 2006. Direct estimation of the wall shear rate using parametric motion models<br />
in 3D. In: Pattern Recognition, 28th DAGM.<br />
Keene, W. C., Stutz, J., Pszenny, A. A. P., Maben, J. R., Fisher, E., Smith, A. M., von Glasow,<br />
R., Pechtl, S., Sive, B. C., & Varner, R. K. 2006. Inorganic chlorine and bromine in coastal New<br />
England air during summer. J. Geophys. Res., accepted.<br />
Kern, C., Trick, S., Rippel, B., & Platt, U. 2006. Applicability of light-emitting diodes as light sources<br />
for active DOAS measurements. Applied Optics, 45, 2077–2088.<br />
Kilian, R., Biester, H., Behrmann, J., Baeza, O., Fesq-Martin, M., Hohner, M., Schimpf, D., Friedmann,<br />
A., & Mangini, A. 2006. Millennium-scale volcanic impact on a superhumid and pristine<br />
ecosystem. Geology, 34(8), 609–612.<br />
Legrand, M., Preunkert, S., Schock, M., Cerqueira, M., Kasper-Giebl, A., Alfonso, J., Pio, C., Gelencser,<br />
A., Etchevers, I., & Simpson, D. in press. Major 20th century changes of organic aerosol<br />
components (BC, WinOC, DOC, HULIS, mono and dicarboxylic acids and cellulose) derived from<br />
Alpine ice cores. Journal of Geophysical Research. CARBOSOL special issue.<br />
Leidenberger, P., Oswald, B., & Roth, K. 2006. Efficient reconstruction of dispersive dielectric profiles<br />
using time domain reflectrometry (TDR). Hydrol. Earth Syst. Sci., 10, 209–232.
182 CHAPTER 7. BIBLIOGRAPHY<br />
Leigh, R. J., Corlett, G. K., Frieß, U., & Monks, P. S. 2006. concurrent multi axie differential optical<br />
absorption spectroscopy system for the measurement of tropospheric nitrogen dioxide. Applied<br />
Optics, 45(28), 7504–7518.<br />
Levin, I., & Karstens, U. 2006. Inferring high-resolution fossil fuel CO2 records at continental sites<br />
from combined 14 CO2 and CO observations. accepted for publication in Tellus B.<br />
Loyola, D., Valks, P., Ruppert, T., Richter, A., Wagner, T., van der A, R., & Meisner, R. 2006.<br />
THE 1997 EL NIÑO IMPACT ON CLOUDS, WATER VAPOUR, AEROSOLS AND REACTIVE<br />
TRACE GASES IN THE TROPOSPHERE, AS MEASURED BY THE GLOBAL OZONE MON-<br />
ITORING EXPERIMENT. Advances in Geosciences, 6, 267 272.<br />
Manning, S.W., Ramsey, C.B., Kutschera, W., Higham, T., Kromer, B., Steier, P., & E.M., Wild.<br />
2006. Chronology for the Aegean Late Bronze Age 1700-1400 B.C. Science, 312, 565–569.<br />
Mettendorf, K.U., Hartl, A., & Pundt, I. 2006. An Indoor Test Campaign of the Tomography Long<br />
Path Differential Optical Absorption Spectroscopy (DOAS) Technique. Journal of Environmental<br />
Monitoring, 8, 279–287.<br />
Meyer, R., Büll, R., Leiter, C., Mannstein, H., Pechtl, S., Oki, T., & Wendling, P. 2006. Contrail<br />
observations over Southern and Eastern Asia in NOAA/AVHRR data and intercomparison to contrail<br />
simulations in a GCM. Int. J. Remote Sensing, in press, Also available as Report No. 176,<br />
<strong>Institut</strong> <strong>für</strong> Physik der Atmosphäre, DLR Oberpfaffenhofen.<br />
Naegler, T., & Levin, I. 2006. Closing the Global Radiocarbon Budget 1945-2005. J. Geophys. Res.,<br />
111, D12311, doi:10.1029/2005JD006758.<br />
Naegler, T., Ciais, P., Rodgers, K., & Levin, I. 2006a. Excess radiocarbon constraints on airsea<br />
gas exchange and the uptake of CO2 by the oceans. Geophys. Res. Letters, 33, L11802,<br />
doi:10.1029/2005GL025408.<br />
Naegler, T., Ciais, P., Orr, J. C., Aumont, O., & Rödenbeck, C. 2006b. On evaluating ocean models<br />
with atmospheric potential oxygen. TELLUS, (in press).<br />
Oppenheimer, C., Tsanev, V. I., Braban, C. F., Cox, R. A., Adams, J. W., Aiuppa, A., Bobrowski, N.,<br />
Delmelle, P., Barclay, J., & McGonigle, A. J. 2006. BrO formation in volcanic plumes. Geochimica<br />
et Cosmochimica Acta, 70, 2935–2941.<br />
Pechtl, S., Schmitz, G., & von Glasow, R. 2006a. Modeling iodide iodate speciation in atmospheric<br />
aerosol. Atmos. Chem. Phys. Discuss., 6, 10959 – 10989.<br />
Pechtl, S., Lovejoy, E. R., Burkholder, J. B., & von Glasow, R. 2006b. Modeling the possible role of<br />
iodine oxides in atmospheric new particle formation. Atmos. Chem. Phys., 6, 503 – 523.<br />
Piel, C., Weller, R., M.Huke, & Wagenbach, D. 2006. Atmospheric methane sulfonate and non-sea<br />
salt sulfate records at the EPICA deep-drilling site in Dronning Maud Land. Journal of Geophysical<br />
Research.<br />
Ponater, M., Pechtl, S., Sausen, R., Schumann, U., & Hüttig, G. 2006. A state-of-the-art assessment<br />
of the potential of the cryoplane technology to reduce aircraft climate impact. Atmos. Environment,<br />
40, 6928 – 6944.<br />
Rezanezhad, F, Vogel, H.-J., & Roth, K. 2006. Experimental study of fingered flow through initially<br />
dry sand. Hydrol. Earth Syst. Sci. Discuss., 3, 2595–2620.<br />
Rohs, S., Schiller, C., Riese, M., Engel, A., Schmidt, U., Wetter, T., Levin, I., Nakazawa, T., & Aoki,<br />
S. 2006. Long-term changes of methane and hydrogen in the stratosphere in the period 1978-2003.<br />
J. Geophys. Res., 111, D14315, doi:10.1029/2005JD006877.<br />
Schimpf, U., Frew, N., & Jähne, B. 2006. Infrared Imaging: A novel tool to investigate the influence<br />
of surface slicks on air sea gas exchange. In: Gade, M., Hühnerfuss, H., & Korenowski, G.M. (eds),<br />
Marine Surface Films: Chemical Characteristics, Influence on Air-Sea Interactions, and Remote<br />
Sensing. Springer.<br />
Schneider, Klaus, Ippisch, Olaf, & Roth, Kurt. 2006. Novel evaporation experiment to determine soil<br />
hydraulic properties. 10, 817–827.
7.1. PEER REVIEWED PUBLICATIONS 183<br />
Schofield, R., Johnston, P. V., Thomas, A., Kreher, K., Connor, B. J., Wood, S., Shooter, D., Chipperfield,<br />
M. P., Richter, A., von Glasow, R., & Rodgers, C. D. 2006. Tropospheric and stratospheric<br />
BrO columns over Arrival Heights, Antarctica during the spring polar vortex split, 2002. J. Geophys.<br />
Res., 111, D22310, doi:10.1029/2005JD007022.<br />
Scholl, T., Pfeilsticker, K., Davis, A. B., Klein Baltink, H., Crewell, S., Löhnert, U., Simmer, C.,<br />
Meywerk, J., & Quante, M. 2006. Path length distributions for solar photons under cloudy skies:<br />
Comparison of measured first and second moments with predictions from classical and anomalous<br />
diffusion theories. J. Geophys. Res., 111, D12211. doi:10.1029/2004JD005707.<br />
Scholz, D., & Mangini, A. 2006. U-redistribution in fossil reef corals from Barbados, West Indies, and<br />
sea level reconstruction for MIS 6.5. The climate of past Interglacials. in press.<br />
Sioris, C. E., Kovalenko, L. J., McLinden, C. A., Salawitch, R. J., Van Roozendael, M., Goutail,<br />
F., Dorf, M., Pfeilsticker, K., Chance, K., von Savigny, C., Liu, X., Kurosu, T. P., Pommereau,<br />
J.-P., Bösch, H., & Frerick, J. 2006. Latitudinal and vertical distribution of bromine monoxide in<br />
the lower stratosphere from SCIAMACHY limb scattering measurements. J. Geophys. Res., 111,<br />
D14301. doi:10.1029/2005JD006479.<br />
Smoydzin, L., & von Glasow, R. 2006. Do organic surface films on sea salt aerosols influence atmospheric<br />
chemistry? A model study. Atmos. Chem. Phys. Discuss., 6, 10373 – 10402.<br />
Spötl, C., & Mangini, A. 2006. U/Th age constraints on the absence of ice in the central Inn Valley<br />
(eastern Alps, Austria) during Marine Isotope Stages 5c to 5a. Quaternary Research, 66, 167–175.<br />
Spötl, C., Mangini, A., & Richards, D.A. 2006. Chronology and paleoenvironment of Marine Isotope<br />
Stage 3 from two high-elevation speleothems, Austrian Alps. Quaternary Science Reviews, 25,<br />
1127–1136.<br />
Steier, P., Drosg, R., Fedi, M., Kutschera, W., Schock, M., Wagenbach, D., & Wild, E.M. 2006.<br />
Radiocarbon determination of particulated organic carbon in non-temperated, alpine glacier ice.<br />
Radiocarbon, 48(1), 69–82.<br />
Toenges-Schuller, N., Stein, O., Rohrer, F., Wahner, A., Richter, A., Burrows, J. P., Beirle, S.,<br />
Wagner, T., Platt, U., & Elvidge, C. D. 2006. GLOBAL DISTRIBUTION PATTERN OF AN-<br />
THROPOGENIC NITROGEN OXIDE EMISSIONS: CORRELATION ANALYSIS OF SATEL-<br />
LITE MEASUREMENTS AND MODEL CALCULATIONS. J. Geophys. Res., 111, D05312,<br />
doi:10.1029/2005JD006068.<br />
Usoskin, I.G., Solanki, S.K., Kovaltsov, G.A., Beer, J., & Kromer, B. 2006. Solar proton events in<br />
cosmogenic isotope data. Geophys. Res. Lett., 33.<br />
Vollweiler, N., Scholz, D., Mühlinghaus, C., Mangini, A., & Spötl, C. 2006. A precisely dated climate<br />
record for the last 9 kyr from three high alpine stalagmites, Spannagel Cave, Austria. Geophysical<br />
Research Letters, 33, L20703.<br />
von Glasow, R. 2006. Importance of the surface reaction OH + Cl − on sea salt aerosol for the<br />
chemistry of the marine boundary layer - a model study. Atmos. Chem. Phys., 6, 3571 – 3581.<br />
von Glasow, R., & Crutzen, P. J. 2006. Tropospheric halogen chemistry. In: The Atmosphere (ed. R.<br />
F. Keeling), Vol. 4 Treatise on Geochemistry (eds. H. D. Holland and K. K. Turekian), in press.<br />
Elsevier-Pergamon, Oxford.<br />
von Rohden, C., Wunderle, K., & Ilmberger, J. 2006. Parametrization of the vertical transport in a<br />
small thermally stratified lake. aquatic sciences accepted.<br />
Wagner, T., Beirle, S., Grzegorski, M., & Platt. 2006a. GLOBAL TRENDS (1996 TO 2003)<br />
OF TOTAL COLUMN PRECIPITABLE WATER OBSERVED BY GOME ON ERS-2 AND<br />
THEIR RELATION TO SURFACE TEMPERATURE. J. Geophys. Res., 111, D12102,<br />
doi:10.1029/2005JD006523.<br />
Wagner, T., Beirle, S., Deutschmann, T., Grzegorski, M., & Platt. 2006b. SATELLITE MONITOR-<br />
ING OF DIFFERENT VEGETATION TYPES BY DIFFERENTIAL OPTICAL ABSORPTION<br />
SPECTROSCOPY (DOAS) IN THE RED SPECTRAL RANGE. Atmos. Chem. Phys., accepted.
184 CHAPTER 7. BIBLIOGRAPHY<br />
Wang, P., Richter, A., Bruns, M., Burrows, J.P., Scheele, R., Junkermann, W., Heue, K.-P., Wagner,<br />
T., Platt, U., & Pundt, I. 2006a. Airborne multi-axis DOAS measurements of tropospheric SO2<br />
plumes in the Po-valley, Italy. Atmospheric Chemistry and Physics, 6, 329–338.<br />
Wang, P., Richter, A., Bruns, M., Burrows, J. P., Junkermann, W., Heue, K.-P., Wagner, T., Platt, U.,<br />
& Pundt, I. 2006b. AIRBORNE MULTI-AXIS DOAS MEASUREMENTS OF TROPOSPHERIC<br />
SO2 PLUMES IN THE PO-VALLEY, ITALY. Atmos. Chem. Phys., 6, 329338.<br />
Wittrock, F., Richter, A., Oetjen, H., Burrows, J. P., Kanakidou, M., Myriokefalitakis, S., Volkamer,<br />
R., Beirle, S., Platt, U., & Wagner, T. 2006. SIMULTANEOUS GLOBAL OBSERVA-<br />
TIONS OF GLYOXAL AND FORMALDEHYDE FROM SPACE. Geophys. Res. Lett., 33, L16804,<br />
doi:10.1029/2006GL026310.<br />
WMO (ed). 2006a. Scientific Assessment of Ozone Depletion: 2006. World Meteorological Organization<br />
Global Ozone Research and Monitoring Project: Geneva.<br />
WMO (ed). 2006b. Scientific Assessment of Ozone Depletion: 2006. World Meteorological Organization<br />
Global Ozone Research and Monitoring Project: Geneva.<br />
Wolff, E.W., Fischer, H., Fundel, F., Ruth, U., Twarloh, B., Littot, G.C., Mulvaney, R., Röthlisberger,<br />
R., De Angelis, M., Boutron, C.F., Hansson, M., Jonsell, U., Hutterli, M.A., Lambert, F., Kaufmann,<br />
P., Stauffer, B., Stocker, T.F., Steffensen, J.P., Bigler, M., Siggaard-Andersen, M.L., Udisti,<br />
R., Becagli, S., Castellano, E., Severi, M., Wagenbach, D., Barbante, C., Gabrielli, P., & Gaspari,<br />
V. 2006. Southern Ocean sea-ice extent, productivity and iron flux over the past eight glacial cycles.<br />
Nature, 440(7083), 491–496.<br />
Wollschläger, U., Ilmberger, J., Isenbeck-Schrter, M., Kreuzer, A., von Rohden, C., Roth, K., &<br />
Schäfer, W. 2006. Coupling of groundwater and surface water at Lake Willersinnweiher: Groundwater<br />
modelling and tracer studies. aquatic sciences accepted.
7.2. GREY PUBLICATIONS 185<br />
Grey Publications<br />
Barkly, M.P., Frieß, U., & Monks, P.S. 2006. Measuring atmospheric CO2 from space using Full<br />
Spectral Initiation (FSI) WFM-DOAS. Atmospheric Chemistry and Physics Discussion, 6, 2765–<br />
2807.<br />
Beirle, S., Volkamer, R., Wittrock, F., Richter, A., Burrows, J., Platt, U., & Wagner,<br />
T. 2006. DOAS RETRIEVAL OF GLYOXAL FROM SPACE. Proceedings of<br />
the ESA Atmospheric Science Conference, 8-12 May 2006, ESA ESRIN, Frascati, Italy,<br />
http://earth.esa.int/workshops/atmos2006/participants/1055/paper DOAS retrieval of Glyoxal from space.<strong>pdf</strong>.<br />
Bobrowski, N., Burton, M.R., Caltabiano, T., Salerno, G., & Platt, U. 2006. Measurements of<br />
the Halogen and SO2 Flux from Mt. Etna in September 2003. Geophysical Research Letters. in<br />
preparation.<br />
Butz, A., Bösch, H., Camy-Peyret, C., Dorf, M., Engel, A., Payan, S., & Pfeilsticker, K. 2006.<br />
Observational constraints on the kinetics of the ClO-BrO and ClO-ClO ozone loss cycles in the<br />
Arctic winter stratosphere. Geophys. Res. Lett. submitted.<br />
Deutschmann, T., & Wagner, T. 2006. TRACY-II Users Manual.<br />
Frieler, K., Rex, M., Salawitch, R.J., Canty, T., Streibel, M., Stimpfle, R.M., Pfeilsticker, K., Dorf,<br />
M., Weisenstein, D.K.and Godin-Beekmann, S., & von der Gathen, P. 2006. Towards a better quantitative<br />
understanding of polar stratospheric ozone loss. Geophysical Research Letters. submitted.<br />
Frieß, U., & Platt, U. 2006a. Absolute concentration measurements by DOAS at ”Zero Visibility”. in<br />
preparation.<br />
Frieß, U., & Platt, U. 2006b. Tropospheric IO in the Antarctic Coastal Region - Observations by<br />
Multi-Axis DOAS. in preparation.<br />
Garbe, C. S., Roetmann, K., & Jähne, B. 2006a. An Optical Flow Based Technique for the Non-<br />
Invasive Measurement of Microfluidic Flows. Pages 1–10 of: 12TH INTERNATIONAL SYMPO-<br />
SIUM ON FLOWVISUALIZATION.<br />
Garbe, C. S., Roetmann, K., & Jhne, B. 2006b. An Optical Flow Based Technique for the Non-<br />
Invasive Measurement of Microfluidic Flows. Pages 1–10 of: 12th International Symposium on<br />
Flow Visualization.<br />
Garbe, C. S., Degreif, K., & Jhne, B. 2006c. Viscous stress measurements from active thermography<br />
on a free air-water interface. Pages 1–10 of: International Symposium on Transport at the Air-Sea<br />
Interface.<br />
Hendrick, F., Van Roozendael, M., De Maziere, M., Richter, A., Rozanov, A., Sioris, C., Dorf, M.,<br />
Kühl, S., Pukite, J., Wagner, T., & Goutail, F. 2006. BrO PROFILING FROM GROUND-BASED<br />
DOAS OBSERVATIONS: NEW TOOL FOR THE ENVISAT/SCIAMACHY VALIDATION. proceedings<br />
of the ESA Atmospheric Science Conference, 8-12 May 2006, ESA ESRIN, Frascati, Italy,<br />
http://earth.esa.int/workshops/atmos2006/participants/873/paper hendrick esa conf06.<strong>pdf</strong>.<br />
Jähne, B. 2007a. Complex Motion. Springer. LNCS 3417.<br />
Jähne, B. 2007b. Complex Motion in Environmental Physics and Live Sciences. Pages 92–105 of:<br />
Jhne, B. (ed), Complex Motion. Springer. LNCS 3417.<br />
Jehle, M., Klar, M., & Jähne, B. in preparation. Optical-Flow based velocity analysis. In: Tropea, C.,<br />
Foss, J., & Yarin, A. (eds), Springer Handbook of Experimental Fluid Dynamics. Berlin, Heidelberg:<br />
Springer.<br />
Kreuzer, A. M., Zongyu, C., Kipfer, R., & Aeschbach-Hertig, W. 2006. Environmental Tracers in<br />
Groundwater of the North China Plain. Pages 136–139 of: IAEA (ed), Isotopes in Environmental<br />
Studies - Aquatic Forum 2004. Vienna: IAEA.<br />
Kühl, S., Pukite, J., Deutschmann, T., Platt, U., & Wagner, T. 2006a. SCIAMACHY Limb Measurements<br />
of NO2, BrO and OClO. Retrieval of vertical profiles: Algorithm, first results and validation.<br />
Adv. Space Res., in review.
186 CHAPTER 7. BIBLIOGRAPHY<br />
Kühl, S., Pukite, J., Deutschmann, T., Dorf, M., Hendrick, F., Platt, U., & Wagner, T. 2006b.<br />
STRATOSPHERIC OClO AND BrO PROFILES FROM SCIAMACHY LIMB MEASUREMENTS.<br />
Proceedings of the ACVE-3 Workshop, 4 7 December, Frascati, Italy, 2006.<br />
Lee, J. S., Kim, Y. J., Geyer, A., & Platt, U. 2006. Simultaneous Measurements of Atmospheric Trace<br />
Gases and Atmospheric Visibility by DOAS System. in preparation.<br />
Levin, I., & Karstens, U. 2006. Quantifying fossil fuel CO2 over Europe. In: Dolman, A. J., Freibauer,<br />
A., & Valentini, R. (eds), Observing the Continental Scale Greenhouse Gas Balance of Europe.<br />
Heidelberg, Germany: Springer-Verlag, Ecological Studies Series.<br />
Louban, I, Bobrowski, N., Rouwet, D., Inguaggiato, S., & Platt, U. 2006. Imaging DOAS for Volcanological<br />
Applications. in preparation.<br />
Marbach, T., Beirle, S., Platt, U., & Wagner, T. 2006a. IDENTIFICATION OF HCHO SOURCES<br />
DUE TO ISOPRENE OR/AND BIOMASS BURNING EMISSIONS USING COMBINED HCHO<br />
AND NO2 SATELLITE OBSERVATIONS. 36th COSPAR Scientific Assembly Abstracts, A1.1-<br />
0063.06.<br />
Marbach, T., Beirle, S., Platt, U., & Wagner, T. 2006b. ISOPRENE AND BIOMASS BURNING<br />
EMISSIONS FROM SATELLITE OBSERVATIONS: SYNERGISTIC USE OF HCHO AND NO2<br />
TRACE GAS MEASUREMENTS. ESA Atmospheric Science Conference abstract book.<br />
Marbach, T., Beirle, S., Platt, U., & Wagner, T. 2006c. ISOPRENE AND BIOMASS BURNING<br />
EMISSIONS FROM SATELLITE OBSERVATIONS: SYNERGISTIC USE OF HCHO AND NO2<br />
TRACE GAS MEASUREMENTS. Geophysical Research Abstracts, 8, 07665.<br />
Marbach, T., Beirle, S., Platt, U., & Wagner, T. 2006d. ISOPRENE AND BIOMASS BURNING<br />
EMISSIONS FROM SATELLITE OBSERVATIONS: SYNERGISTIC USE OF HCHO AND NO2<br />
TRACE GAS MEASUREMENTS. 3rd International DOAS Workshop abs. Vol.<br />
N., Bobrowski, & U., Platt. 2006. Bromine Monoxide Studies in Volcanic Plumes. Journal of Volcanology<br />
and Geothermal Research. submitted 31. 7. 2005.<br />
Pettinger, M., Jahn, F., Wagenbach, D., Bhlert, R., Hoelzle, M., & Preunkert, S. 2006. Climate<br />
significance of stable water isotope records from Alpine ice cores. Geophysical Research Abstracts,<br />
Vol. 8, 09854. Poster.<br />
Platt, U., Pfeilsticker, K., & Vollmer, M. 2006. Chapter 24: Atmospheric Optics. In: Träger, F. (ed),<br />
Springer Handbook of Lasers and Optics. Heidelberg: Springer.<br />
Pukite, J., Kühl, S., Deutschmann, T., Wilms-Grabe, W., Platt, U., & Wagner, T. 2006a. LIMB<br />
RETRIEVAL OF STRATOSPHERIC TRACE GASES FROM SCIAMACHY USING MONTE<br />
CARLO RADIATIVE TRANSFER MODELING. 3rd International DOAS Workshop abs. Vol.<br />
Pukite, J., Kühl, S., Deutschmann, T., Wilms-Grabe, W., Friedeburg, C., Platt,<br />
U., & Wagner, T. 2006b. RETRIEVAL OF STRATOSPHERIC TRACE GASES<br />
FROM SCIAMACHY LIMB MEASUREMENTS. Proceedings of the ESA Atmospheric<br />
Science Conference, 8-12 May 2006, ESA ESRIN, Frascati, Italy,<br />
http://earth.esa.int/workshops/atmos2006/participants/1148/paper proc Frasc 2.<strong>pdf</strong>.<br />
Pukite, J., Kühl, S., Deutschmann, T., Wilms-Grabe, W., Friedeburg, C., Platt, U., & Wagner,<br />
T. 2006c. RETRIEVAL OF STRATOSPHERIC TRACE GASES FROM SCIAMACHY LIMB<br />
MEASUREMENTS. Geophysical Research Abstracts, 8, 08102.<br />
Rocholz, Roland. 2006. Imaging System for combined slope/height measurements of short wind<br />
waves : ISHG. In: DPG Frhjahrstagung, Heidelberg, 03.2006 (ed), Verhandlungen der Deutschen<br />
Physikalischen Gesellschaft. Deutsche Physikalische Gesellschaft.<br />
Schimpf, U., Popp, C., & Jähne, B. 2006. Active Thermography: a local and fast method to investigate<br />
heat and gas exchange between ocean and atmosphere. In: DPG Frhjahrstagung, Heidelberg, 15.-<br />
17.03.2006 (ed), Verhandlungen der Deutschen Physikalischen Gesellschaft. Deutsche Physikalische<br />
Gesellschaft.<br />
Sebastian, O., Geyer, A., Hönninger, G., Platt, U., Sciare, J., & Mihalopoulos, N. 2006. The influence<br />
of radicals on DMS oxidation in the Eastern Mediterranean marine boundary layer. in preparation.
7.2. GREY PUBLICATIONS 187<br />
Simpson, W.R., Carlson, D., Hönninger, G., Douglas, T.A., Sturm, M., Perovich, D., & Platt, U.<br />
2006. First-year sea-ice contact predicts bromine monoxide (BrO) levels better than potential frost<br />
flower contact. Atmospheric Chemistry and Physics Discussion, 6, 1105111066.<br />
Sinreich, R., Volkamer, R., Filsinger, F., Frieß, U., Kern, C., Platt, U., Sebastián, O., & Wagner,<br />
T. 2006a. MAX-DOAS detection of glyoxal during ICARTT 2004. Atmospheric Chemistry and<br />
Physics Discussion, 6, 9459–9481.<br />
Sinreich, R., Volkamer, R., Filsinger, F., Frie, U., Kern, C., Platt, U., Sebastian, O., & Wagner, T.<br />
2006b. MAX-DOAS DETECTION OF GLYOXAL DURING ICARTT 2004. Atmos. Chem. Phys.<br />
Discuss., 6, 9459–9481.<br />
Spötl, C., & Mangini, A. 2005. Altersbestimmungen an Griffner Tropfsteinen. Page 336pp of: Komposch,<br />
C., & Wieser, C. (eds), Schlossberg Griffen: Klagenfurt. Verlag des Naturwissenschaftlichen<br />
Vereins fr Kärnten.<br />
Stutz, J., Hebestreit, K., Hönninger, G., & U., Platt. 2006. Simultaneous measurement of iodine oxide<br />
and nitrogen dioxide at Mace Head, Ireland. in preparation.<br />
Wagner, T., Beirle, S., Deutschmann, T., Frankenberg, C., Grzegorski, M., Hollwedel, J., Khokhar,<br />
M. F., Kühl, S., Marbach, T., Platt, U., Pukite, J., Sanghavi, S., & Wilms-Grabe, W. 2006a. 10<br />
YEARS OF REMOTE SENSING WITH MODERN UV/VIS/NIR SATELLITE INSTRUMENTS:<br />
A NEW VIEW ON GLOBAL NEAR-SURFACE TRACE GAS DISTRIBUTIONS. presentation at<br />
the 36TH COSPAR SCIENTIFIC ASSEMBLY BEIJING, CHINA, 16 23 JULY 2006.<br />
Wagner, T., Beirle, S., Grzegorski, M., & Platt, U. 2006b. CHARACTERIZATION OF<br />
VEGETATION TYPE USING DOAS SATELLITE RETRIEVALS. poster presentation<br />
at the ESA Atmospheric Science Conference, 8-12 May 2006, ESA ESRIN, Frascati, Italy<br />
(http://earth.esa.int/workshops/atmos2006/participants/563/paper Thomas Wagner vegetation frascati.<strong>pdf</strong>).<br />
Wagner, T., Burrows, J. P., Deutschmann, T., Dix, B., Hendrick, F., v.Friedeburg, C., Frie, U., Heue,<br />
K.-P., Irie, H., Iwabuchi, H., Kanaya, Y., Keller, J., McLinden, C. A., Oetjen, H., Palazzi, E.,<br />
Petritoli, A., Platt, U., Postylyakov, O., Pukite, J., Richter, A., van Roozendael, M., Rozanov,<br />
A., Rozanov, V., Sinreich, R., Sanghavi, S., & F., Wittrock. 2006c. COMPARISON OF BOX-<br />
AIR-MASS-FACTORS AND RADIANCES FOR MULTIPLE-AXIS DIFFERENTIAL OPTICAL<br />
ABSORPTION SPECTROSCOPY (MAX-DOAS) GEOMETRIES CALCULATED FROM DIF-<br />
FERENT UV/VISIBLE RADIATIVE TRANSFER MODELS. J. Atmos. Chem. Phys. Discuss.,<br />
6, 9823–9876.<br />
Wagner, T., Ibrahim, O., Sinreich, R., Frie, U., & Platt. 2006d. ENHANCED TROPOSPHERIC BRO<br />
CONCENTRATIONS OVER THE ANTARCTIC SEA ICE BELT IN MID WINTER OBSERVED<br />
FROM MAX-DOAS OBSERVATIONS ON BOARD THE RESEARCH VESSEL POLARSTERN.<br />
Atmos. Phys. Chem., submitted.<br />
Wagner, T., Beirle, S., Grzegorski, M., & Platt, U. 2006e. GLOBAL TRENDS OF CLOUD COVER<br />
AND CLOUD HEIGHT DERIVED FROM GOME SATELLITE OBSERVATIONS 1996-2003 AND<br />
THEIR RELATION TO SURFACE-NEAR TEMPERATURE. poster presentation at the 2006 Fall<br />
Meeting: 1115 December 2006, San Francisco, California.<br />
Wagner, T., Beirle, S., Grzegorski, M., & Platt, U. 2006f. INVESTIGATING THE EARTH’S HYDRO-<br />
LOGICAL CYCLE USING H2O VCDS AND CLOUD RELATED PARAMETERS FROM GOME-<br />
II. Proceedings of the 1st EPS/MetOp RAO Workshop ESRIN, Frascati, Italy, 15-17 May 2006<br />
(http://earth.esrin.esa.it/workshops/EPS MetOp RAO 2006/proceedings/papers/p wagne.<strong>pdf</strong>).<br />
Wagner, T., Beirle, S., Deutschmann, T., Grzegorski, M., Sanghavi, S., & Platt, U.<br />
2006g. PROBING INTERNAL CLOUD PROPERTIES FROM SPACE. presentation at<br />
the ESA Atmospheric Science Conference, 8-12 May 2006, ESA ESRIN, Frascati, Italy<br />
(http://earth.esa.int/workshops/atmos2006/participants/565/paper Thomas Wagner cloud properties frascati.p<br />
Wagner, T., Beirle, S., Deutschmann, T., Grzegorski, M., Sanghavi, S., & Platt, U. 2006h. PROB-<br />
ING INTERNAL CLOUD PROPERTIES FROM SPACE. presentation at the 36TH COSPAR<br />
SCIENTIFIC ASSEMBLY BEIJING, CHINA, 16 23 JULY 2006.<br />
Xie, P., Geyer, A., Volkamer, R., Yu, Y., Platt, U., Galle, B., & Chen, L. 2006. Investigation of the<br />
distribution of aromatic hydrocarbons in Shanghai (China). in preparation.
7.3. PHD THESES 189<br />
PhD Theses<br />
Bossmeyee, Jens. 2006. Studies of Aldehydes in an Atmosphere Simulation Chamber, Degradation of<br />
Higher Aldehydes by Nitrate Radicals. PhD Thesis, <strong>Universität</strong> Heidelberg.<br />
Braun, H. 2006a. A new hypothesis for the 1470-year cycle of abrupt warming events in the last<br />
ice-age. Ph.D. thesis, <strong>Ruprecht</strong>-<strong>Karls</strong>-University, Heidelberg.<br />
Braun, H. 2006b. A new hypothesis for the 1470-year cycle of abrupt warming events in the last<br />
ice-age. PhD Thesis, <strong>Universität</strong> Heidelberg.<br />
Butz, A. 2006. Case studies of stratospheric nitrogen, chlorine and iodine photochemistry based on<br />
balloon-boren UV/visible and IR absorption spectroscopy. PhD Thesis, <strong>Universität</strong> Heidelberg.<br />
Degreif, K. A. 2006. Untersuchungen zum Gasaustausch - Entwicklung und Applikation eines zeitlich<br />
aufgelsten Massenbilanzverfahrens. PhD Thesis, <strong>Universität</strong> Heidelberg.<br />
Hak, Claudia. 2006. VARIABILITT VON FORMALDEHYD-KONZENTRATIONEN IN DER VER-<br />
SCHMUTZTEN PLANETAREN GRENZSCHICHT: MESSUNGEN IM BALLUNGSRAUM VON<br />
MILANO. PhD Thesis, <strong>Universität</strong> <strong>Karls</strong>ruhe.<br />
Jehle, M. 2006. Spatio-temporal analysis of flows close to water surfaces. PhD Thesis, <strong>Universität</strong><br />
Heidelberg.<br />
Khokhar, M. F. 2006. RETRIEVAL AND INTERPRETATION OF TROPOSPHERIC SO2 FROM<br />
UV-VIS SATELLITE INSTRUMENTS. PhD Thesis, University of Leipzig.<br />
Kraus, S. 2006. Entwicklung eines flexiblen Softwaresystems zur Auswertung spektroskopischer<br />
Satelliten-Bildsequenzen. PhD Thesis, Technische Informatik, <strong>Universität</strong> Mannheim.<br />
Latuske, N. 2006. Solare Variabilitt und Klimaänderungen auf einer Zeitskala von einigen Dekaden<br />
bis Jahrhunderten im Holozän. Ph.D. thesis, <strong>Ruprecht</strong>-<strong>Karls</strong>-University, Heidelberg.<br />
Lotter, A. 2006. Field Measurements of Water Continuum and Water Dimer Absorption by Active<br />
Long Path Differential Optical Absorption Spectroscopy (DOAS). PhD Thesis, <strong>Universität</strong> Heidelberg.<br />
Popp, C. J. 2006. Untersuchung von Austauschprozessen an der Wasseroberfläche aus Infrarot-<br />
Bildsequenzen mittels frequenzmodulierter Wärmeeinstrahlung. PhD Thesis, <strong>Universität</strong> Heidelberg.<br />
Scholl, T. 2006. Photon Path Length Distributions for Cloudy Skies - Their first and second-order<br />
moments inferred from high resolution oxygen A-Band spectroscopy. PhD Thesis, <strong>Universität</strong> Heidelberg.<br />
Unkel, I. 2006. AMS- 14 C-Analysen zur Rekonstruktion der Landschafts- und Kulturgeschichte in der<br />
Region Palpa (S-Peru). Ph.D. thesis, <strong>Ruprecht</strong>-<strong>Karls</strong>-University, Heidelberg.
7.4. DIPLOMA THESES 191<br />
Diploma Theses<br />
Jahn, F. 2006. Einsatz der Continous Flow Analysis zur vorläufigen Datierung eines alpinen Eiskerns.<br />
diploma thesis, <strong>Universität</strong> Heidelberg.<br />
Mühlinghaus, C. 2006. Modellierung paläoklimatischer Parameter anhand Wachstum und Isotopiekorrelationen<br />
von Stalagmiten. diploma thesis, <strong>Universität</strong> Heidelberg.<br />
Rocholz, A. 2005. Bildgebendes System zur simultanen Neigungs- und Höhenmessung an kleinskaligen<br />
Wind-Wasser-Wellen. diploma thesis, <strong>Universität</strong> Heidelberg.<br />
Schneider, Klaus. 2005. Novel evaporation experiment to determine soil hydraulic properties. diploma<br />
thesis, <strong>Universität</strong> Heidelberg.<br />
Studiosus, A. 2006a. Development of a new technique to measure everytjing everywhere. diploma<br />
thesis, <strong>Universität</strong> Heidelberg.<br />
Studiosus, A. 2006b. Development of a new technique to measure everytjing everywhere. diploma<br />
thesis, <strong>Universität</strong> Heidelberg.<br />
Vogel, F. 2006. Raman- and UV-Spectroscopy of liquids and dissolved volatile gases for gas-exchange<br />
measurements. diploma thesis, <strong>Universität</strong> Heidelberg.<br />
Vollweiler, N. 2005. Stalagmiten aus der Spannagel-Höhle bei Hintertux (Tirol, Österreich) - Archive<br />
<strong>für</strong> das Klima der Alpen im Holozän. diploma thesis, <strong>Universität</strong> Heidelberg.<br />
Wieser, M. 2006. Entwicklung und Anwendung von Diffusionssamplern zur Beprobung gelöster Edelgase<br />
in Wasser. diploma thesis, <strong>Universität</strong> Heidelberg.
7.5. INVITED TALKS 193<br />
Invited Talks<br />
Aeschbach-Hertig, W. 2006a. Edelgase im Grundwasser als Tracer und Klimaindikatoren. Invited<br />
talk, Kolloquium Erdwissenschaften, University of Basel, Switzerland.<br />
Aeschbach-Hertig, W. 2006b. Edelgase und ”Excess Air” im Grundwasser. Invited talk, Hydrologisches<br />
Kolloquium, University of Freiburg, Germany.<br />
Aeschbach-Hertig, W. 2006c. Environmental tracers in groundwater studies - Case study North China<br />
Plain. Invited talk, School of Environmental Science and Engineering, Chang’an University, Xi’an,<br />
China.<br />
Aeschbach-Hertig, W. 2006d. Groundwater age dating with gas tracers: The role of gas partitioning.<br />
Invited key presentation, Annual Meeting of the Geological Society of America (GSA), Philadelphia,<br />
USA.<br />
Aeschbach-Hertig, W. 2006e. Spurenstoffmethoden zur Erforschung des Grundwassers. Invited talk,<br />
Rhein-Neckar Gesprächskreis, Heidelberg, Germany.<br />
von Glasow, R. 2006. Halogens in the marine boundary layer. Invited talk, UK SOLAS meeting,<br />
Manchester, 17. - 18. July 2006.
<strong>Institut</strong> <strong>für</strong> <strong>Umweltphysik</strong><br />
Im Neuenheimer Feld 229<br />
69120 Heidelberg<br />
Germany<br />
Tel. + 49 6221 54-63 50<br />
Fax + 49 6221 54-64 05<br />
email: sekretariat@iup.uni-heidelberg.de<br />
www.iup.uni-heidelberg.de<br />
Board of Directors<br />
Prof. Dr. Ulrich Platt<br />
Prof. Dr. Kurt Roth