Diploma thesis in Physics submitted by Florian Freundt born in ...
Diploma thesis in Physics submitted by Florian Freundt born in ...
Diploma thesis in Physics submitted by Florian Freundt born in ...

You also want an ePaper? Increase the reach of your titles
YUMPU automatically turns print PDFs into web optimized ePapers that Google loves.
5 Results 5.5. Noble gases<br />
3<br />
He [% atm. air]<br />
4<br />
He [% atm. air]<br />
40<br />
Ar [% atm. air]<br />
Aug Sep Oct Nov Dec Jan Feb Mar Apr May<br />
110<br />
105<br />
100<br />
95<br />
90<br />
105<br />
100<br />
95<br />
90<br />
105<br />
100<br />
95<br />
90<br />
Aug Sep Oct Nov Dec Jan Feb Mar Apr May<br />
Date<br />
20<br />
Ne [% atm. air]<br />
22<br />
Ne [% atm. air]<br />
36<br />
Ar [% atm. air]<br />
Aug Sep Oct Nov Dec Jan Feb Mar Apr May<br />
110<br />
105<br />
100<br />
95<br />
90<br />
105<br />
100<br />
95<br />
90<br />
105<br />
100<br />
95<br />
90<br />
Aug Sep Oct Nov Dec Jan Feb Mar Apr May<br />
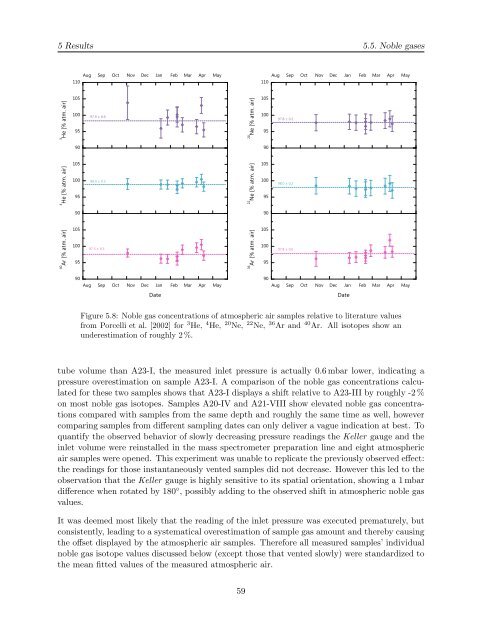
Figure 5.8: Noble gas concentrations of atmospheric air samples relative to literature values<br />
from Porcelli et al. [2002] for 3 He, 4 He, 20 Ne, 22 Ne, 36 Ar and 40 Ar. All isotopes show an<br />
underestimation of roughly 2 %.<br />
tube volume than A23-I, the measured <strong>in</strong>let pressure is actually 0.6 mbar lower, <strong>in</strong>dicat<strong>in</strong>g a<br />
pressure overestimation on sample A23-I. A comparison of the noble gas concentrations calculated<br />
for these two samples shows that A23-I displays a shift relative to A23-III <strong>by</strong> roughly -2 %<br />
on most noble gas isotopes. Samples A20-IV and A21-VIII show elevated noble gas concentrations<br />
compared with samples from the same depth and roughly the same time as well, however<br />
compar<strong>in</strong>g samples from different sampl<strong>in</strong>g dates can only deliver a vague <strong>in</strong>dication at best. To<br />
quantify the observed behavior of slowly decreas<strong>in</strong>g pressure read<strong>in</strong>gs the Keller gauge and the<br />
<strong>in</strong>let volume were re<strong>in</strong>stalled <strong>in</strong> the mass spectrometer preparation l<strong>in</strong>e and eight atmospheric<br />
air samples were opened. This experiment was unable to replicate the previously observed effect:<br />
the read<strong>in</strong>gs for those <strong>in</strong>stantaneously vented samples did not decrease. However this led to the<br />
observation that the Keller gauge is highly sensitive to its spatial orientation, show<strong>in</strong>g a 1 mbar<br />
difference when rotated <strong>by</strong> 180 ◦ , possibly add<strong>in</strong>g to the observed shift <strong>in</strong> atmospheric noble gas<br />
values.<br />
It was deemed most likely that the read<strong>in</strong>g of the <strong>in</strong>let pressure was executed prematurely, but<br />
consistently, lead<strong>in</strong>g to a systematical overestimation of sample gas amount and there<strong>by</strong> caus<strong>in</strong>g<br />
the offset displayed <strong>by</strong> the atmospheric air samples. Therefore all measured samples’ <strong>in</strong>dividual<br />
noble gas isotope values discussed below (except those that vented slowly) were standardized to<br />
the mean fitted values of the measured atmospheric air.<br />
59<br />
Date