Diploma thesis in Physics submitted by Florian Freundt born in ...
Diploma thesis in Physics submitted by Florian Freundt born in ...
Diploma thesis in Physics submitted by Florian Freundt born in ...

You also want an ePaper? Increase the reach of your titles
YUMPU automatically turns print PDFs into web optimized ePapers that Google loves.
5.2. Temperature profiles 5 Results<br />
� � � � � � � � � � � ��� � �<br />
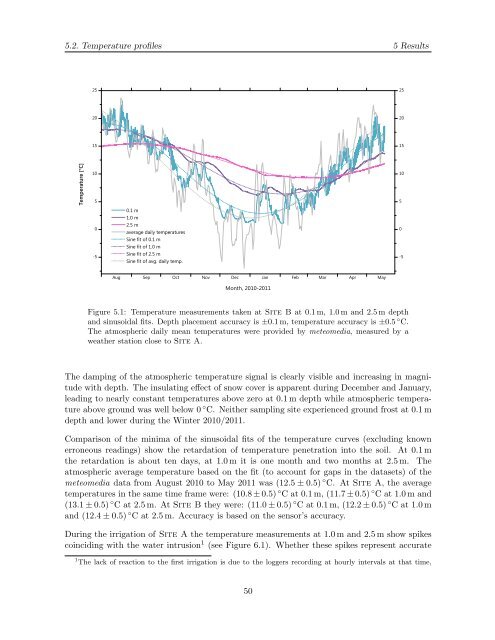
Figure 5.1: Temperature measurements taken at Site B at 0.1 m, 1.0 m and 2.5 m depth<br />
and s<strong>in</strong>usoidal fits. Depth placement accuracy is ±0.1 m, temperature accuracy is ±0.5 ◦ C.<br />
The atmospheric daily mean temperatures were provided <strong>by</strong> meteomedia, measured <strong>by</strong> a<br />
weather station close to Site A.<br />
The damp<strong>in</strong>g of the atmospheric temperature signal is clearly visible and <strong>in</strong>creas<strong>in</strong>g <strong>in</strong> magnitude<br />
with depth. The <strong>in</strong>sulat<strong>in</strong>g effect of snow cover is apparent dur<strong>in</strong>g December and January,<br />
lead<strong>in</strong>g to nearly constant temperatures above zero at 0.1 m depth while atmospheric temperature<br />
above ground was well below 0 ◦ C. Neither sampl<strong>in</strong>g site experienced ground frost at 0.1 m<br />
depth and lower dur<strong>in</strong>g the W<strong>in</strong>ter 2010/2011.<br />
Comparison of the m<strong>in</strong>ima of the s<strong>in</strong>usoidal fits of the temperature curves (exclud<strong>in</strong>g known<br />
erroneous read<strong>in</strong>gs) show the retardation of temperature penetration <strong>in</strong>to the soil. At 0.1 m<br />
the retardation is about ten days, at 1.0 m it is one month and two months at 2.5 m. The<br />
atmospheric average temperature based on the fit (to account for gaps <strong>in</strong> the datasets) of the<br />
meteomedia data from August 2010 to May 2011 was (12.5 ± 0.5) ◦ C. At Site A, the average<br />
temperatures <strong>in</strong> the same time frame were: (10.8 ± 0.5) ◦ C at 0.1 m, (11.7 ± 0.5) ◦ C at 1.0 m and<br />
(13.1 ± 0.5) ◦ C at 2.5 m. At Site B they were: (11.0 ± 0.5) ◦ C at 0.1 m, (12.2 ± 0.5) ◦ C at 1.0 m<br />
and (12.4 ± 0.5) ◦ C at 2.5 m. Accuracy is based on the sensor’s accuracy.<br />
Dur<strong>in</strong>g the irrigation of Site A the temperature measurements at 1.0 m and 2.5 m show spikes<br />
co<strong>in</strong>cid<strong>in</strong>g with the water <strong>in</strong>trusion 1 (see Figure 6.1). Whether these spikes represent accurate<br />
1 The lack of reaction to the first irrigation is due to the loggers record<strong>in</strong>g at hourly <strong>in</strong>tervals at that time,<br />
50