- Page 2 and 3: FDI IN INDIA AND ITS GROWTH LINKAGE
- Page 4: PROJECT TEAM Study Team Project Lea
- Page 7 and 8: linkages with the economy. The sect
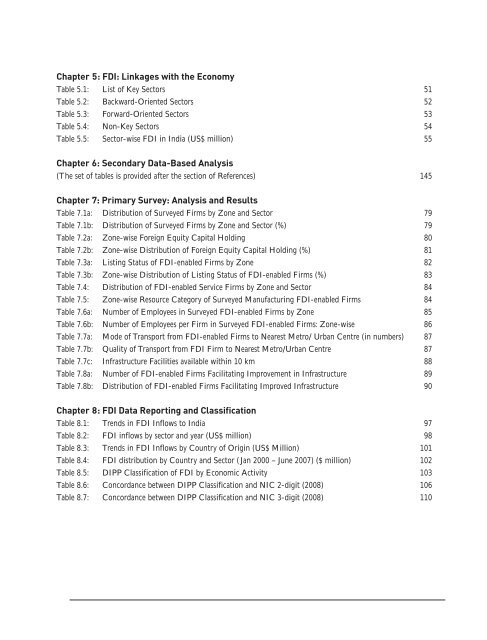
- Page 10: Contents Executive Summary Chapter
- Page 16 and 17: Executive Summary Foreign direct in
- Page 18 and 19: EXECUTIVE SUMMARY petroleum product
- Page 20 and 21: Chapter 1: Introduction 1.1 Backdro
- Page 22 and 23: section industry data. However, the
- Page 24 and 25: in India stood at $23 billion, show
- Page 26 and 27: viii) Backward and Forward Linkages
- Page 28 and 29: Chapter 2: FDI Scenario in India: T
- Page 30 and 31: Secretariat for Industrial Assistan
- Page 32 and 33: Table 2.2 shows that FDI outflows f
- Page 34 and 35: at about 2 per cent or less of the
- Page 36 and 37: Table 2.5 Sector-wise Break-up of F
- Page 38 and 39: Table 2.7 FDI in India in the Servi
- Page 40 and 41: Figure 2.4 Country-wise FDI Inflows
- Page 42 and 43: 2.10 Foreign Technology Transfers A
- Page 44 and 45: Chapter 3: Mergers & Acquisitions a
- Page 46 and 47: Table 3.2 Short-term effects of FDI
- Page 48 and 49: proportion of foreign investment in
- Page 50 and 51: Chapter 4: Special Economic Zones (
- Page 52 and 53: 4.4 Management of SEZs SEZs are und
- Page 54 and 55: in the eight major SEZ’s exports
- Page 56 and 57: Foreign Direct Investment in SEZs S
- Page 58 and 59: In a span of a few years, there hav
- Page 60 and 61: SPECIAL ECONOMIC ZONES (SEZS) AND F
- Page 62 and 63:
existing infrastructure, (b) exploi
- Page 64 and 65:
SPECIAL ECONOMIC ZONES (SEZS) AND F
- Page 66 and 67:
SPECIAL ECONOMIC ZONES (SEZS) AND F
- Page 68 and 69:
Chapter 5: FDI: Linkages with the E
- Page 70 and 71:
construction (4200); fuels, includi
- Page 72 and 73:
FDI: LINKAGES WITH THE ECONOMY S. N
- Page 74:
Table 5.5 Sector-wise FDI in India
- Page 77 and 78:
FDI IN INDIA AND ITS GROWTH LINKAGE
- Page 79 and 80:
FDI IN INDIA AND ITS GROWTH LINKAGE
- Page 81 and 82:
FDI IN INDIA AND ITS GROWTH LINKAGE
- Page 83 and 84:
FDI IN INDIA AND ITS GROWTH LINKAGE
- Page 85 and 86:
FDI IN INDIA AND ITS GROWTH LINKAGE
- Page 87 and 88:
FDI IN INDIA AND ITS GROWTH LINKAGE
- Page 89 and 90:
FDI IN INDIA AND ITS GROWTH LINKAGE
- Page 92 and 93:
Chapter 7: Primary Survey: Analysis
- Page 94 and 95:
the North and South zones, whereas
- Page 96 and 97:
PRIMARY SURVEY: ANALYSIS AND RESULT
- Page 98 and 99:
Table 7.1a Distribution of Surveyed
- Page 100 and 101:
Table 7.2b Zone-wise Distribution o
- Page 102 and 103:
Table 7.3b Zone-wise Distribution o
- Page 104 and 105:
Table 7.6a Number of Employees in S
- Page 106 and 107:
Table 7.7a Mode of Transport from F
- Page 108 and 109:
Table 7.8a Number of FDI-enabled Fi
- Page 110 and 111:
Chapter 8: FDI Data Reporting and C
- Page 112 and 113:
sector, non-profit institutions ser
- Page 114 and 115:
three categories, namely, (i) inves
- Page 116 and 117:
Table 8.1 Trends in FDI Inflows to
- Page 118 and 119:
FDI DATA REPORTING AND CLASSIFICATI
- Page 120 and 121:
Table 8.3 Trends in FDI Inflows by
- Page 122 and 123:
Table 8.5 DIPP Classification of FD
- Page 124 and 125:
SECTOR-WISE CODE 3700 DEFENCE INDUS
- Page 126 and 127:
FDI DATA REPORTING AND CLASSIFICATI
- Page 128 and 129:
S. No. DIPP DIPP Activity NIC 2-Dig
- Page 130 and 131:
S. No. DIPP DIPP Activity NIC 3-Dig
- Page 132 and 133:
S. No. DIPP DIPP Activity NIC 3-Dig
- Page 134:
FDI DATA REPORTING AND CLASSIFICATI
- Page 137 and 138:
FDI IN INDIA AND ITS GROWTH LINKAGE
- Page 139 and 140:
FDI IN INDIA AND ITS GROWTH LINKAGE
- Page 141 and 142:
FDI IN INDIA AND ITS GROWTH LINKAGE
- Page 143 and 144:
FDI IN INDIA AND ITS GROWTH LINKAGE
- Page 145 and 146:
FDI IN INDIA AND ITS GROWTH LINKAGE
- Page 147 and 148:
FDI IN INDIA AND ITS GROWTH LINKAGE
- Page 149 and 150:
FDI IN INDIA AND ITS GROWTH LINKAGE
- Page 152 and 153:
Chapter 10: Key Findings and Salien
- Page 154 and 155:
Findings � About half the total o
- Page 156 and 157:
7. Forex Implications: To understan
- Page 158 and 159:
manufacturing firms taken together.
- Page 160 and 161:
References Australian Bureau of Sta
- Page 162 and 163:
for economic growth and poverty all
- Page 164:
Tables for Chapter 6
- Page 167 and 168:
FDI IN INDIA AND ITS GROWTH LINKAGE
- Page 169 and 170:
FDI IN INDIA AND ITS GROWTH LINKAGE
- Page 171 and 172:
FDI IN INDIA AND ITS GROWTH LINKAGE
- Page 173 and 174:
FDI IN INDIA AND ITS GROWTH LINKAGE
- Page 175 and 176:
FDI IN INDIA AND ITS GROWTH LINKAGE
- Page 177 and 178:
FDI IN INDIA AND ITS GROWTH LINKAGE
- Page 179 and 180:
FDI IN INDIA AND ITS GROWTH LINKAGE
- Page 181 and 182:
FDI IN INDIA AND ITS GROWTH LINKAGE
- Page 183 and 184:
FDI IN INDIA AND ITS GROWTH LINKAGE
- Page 185 and 186:
FDI IN INDIA AND ITS GROWTH LINKAGE
- Page 187 and 188:
FDI IN INDIA AND ITS GROWTH LINKAGE
- Page 189 and 190:
FDI IN INDIA AND ITS GROWTH LINKAGE
- Page 191 and 192:
FDI IN INDIA AND ITS GROWTH LINKAGE
- Page 193 and 194:
FDI IN INDIA AND ITS GROWTH LINKAGE
- Page 195 and 196:
FDI IN INDIA AND ITS GROWTH LINKAGE
- Page 197 and 198:
FDI IN INDIA AND ITS GROWTH LINKAGE
- Page 199 and 200:
FDI IN INDIA AND ITS GROWTH LINKAGE
- Page 201 and 202:
FDI IN INDIA AND ITS GROWTH LINKAGE
- Page 203 and 204:
FDI IN INDIA AND ITS GROWTH LINKAGE
- Page 205 and 206:
FDI IN INDIA AND ITS GROWTH LINKAGE
- Page 207 and 208:
FDI IN INDIA AND ITS GROWTH LINKAGE
- Page 209 and 210:
FDI IN INDIA AND ITS GROWTH LINKAGE
- Page 211 and 212:
FDI IN INDIA AND ITS GROWTH LINKAGE
- Page 213 and 214:
FDI IN INDIA AND ITS GROWTH LINKAGE
- Page 215 and 216:
FDI IN INDIA AND ITS GROWTH LINKAGE
- Page 217 and 218:
FDI IN INDIA AND ITS GROWTH LINKAGE
- Page 219 and 220:
FDI IN INDIA AND ITS GROWTH LINKAGE
- Page 221 and 222:
FDI IN INDIA AND ITS GROWTH LINKAGE
- Page 223 and 224:
FDI IN INDIA AND ITS GROWTH LINKAGE
- Page 225 and 226:
FDI IN INDIA AND ITS GROWTH LINKAGE
- Page 227 and 228:
FDI IN INDIA AND ITS GROWTH LINKAGE
- Page 229 and 230:
FDI IN INDIA AND ITS GROWTH LINKAGE
- Page 231 and 232:
FDI IN INDIA AND ITS GROWTH LINKAGE
- Page 233 and 234:
FDI IN INDIA AND ITS GROWTH LINKAGE
- Page 235 and 236:
FDI IN INDIA AND ITS GROWTH LINKAGE
- Page 237 and 238:
FDI IN INDIA AND ITS GROWTH LINKAGE
- Page 239 and 240:
FDI IN INDIA AND ITS GROWTH LINKAGE
- Page 241 and 242:
FDI IN INDIA AND ITS GROWTH LINKAGE
- Page 243 and 244:
FDI IN INDIA AND ITS GROWTH LINKAGE
- Page 245 and 246:
FDI IN INDIA AND ITS GROWTH LINKAGE
- Page 247 and 248:
FDI IN INDIA AND ITS GROWTH LINKAGE
- Page 249 and 250:
FDI IN INDIA AND ITS GROWTH LINKAGE
- Page 251 and 252:
FDI IN INDIA AND ITS GROWTH LINKAGE
- Page 253 and 254:
FDI IN INDIA AND ITS GROWTH LINKAGE
- Page 255 and 256:
FDI IN INDIA AND ITS GROWTH LINKAGE
- Page 257 and 258:
FDI IN INDIA AND ITS GROWTH LINKAGE
- Page 260:
Questionnaires
- Page 263 and 264:
FDI IN INDIA AND ITS GROWTH LINKAGE
- Page 265 and 266:
FDI IN INDIA AND ITS GROWTH LINKAGE
- Page 267 and 268:
FDI IN INDIA AND ITS GROWTH LINKAGE
- Page 269 and 270:
FDI IN INDIA AND ITS GROWTH LINKAGE
- Page 271 and 272:
FDI IN INDIA AND ITS GROWTH LINKAGE
- Page 274 and 275:
255
- Page 276 and 277:
QUESTIONNAIRE 257
- Page 278 and 279:
QUESTIONNAIRE 259
- Page 280 and 281:
QUESTIONNAIRE 261
- Page 282 and 283:
QUESTIONNAIRE 263


