

fdi in india and its growth linkages - Department Of Industrial Policy ...
fdi in india and its growth linkages - Department Of Industrial Policy ...
fdi in india and its growth linkages - Department Of Industrial Policy ...

You also want an ePaper? Increase the reach of your titles
YUMPU automatically turns print PDFs into web optimized ePapers that Google loves.
proportion of foreign <strong>in</strong>vestment <strong>in</strong> acquisition of shares <strong>in</strong>creased from 17 per cent <strong>in</strong> 2000 to 28 per cent <strong>in</strong> 2006. The<br />
value of fresh <strong>in</strong>vestments has <strong>in</strong>creased from $2.3 billion dur<strong>in</strong>g 2000 to $33 billion dur<strong>in</strong>g 2008. Over the same period,<br />
the <strong>in</strong>vestment through acquisition of shares <strong>in</strong>creased from $0.5 billion to $6.2 billion. A much stronger <strong>growth</strong> <strong>in</strong><br />
<strong>in</strong>flows through acquisitions is observed due to relatively lower figures <strong>in</strong> the <strong>in</strong>itial years. Though <strong>in</strong>vestment <strong>in</strong> new<br />
projects always exceeds the <strong>in</strong>vestment <strong>in</strong> acquisitions by at least two <strong>and</strong> a half times, the gap between these two modes<br />
widened <strong>in</strong> 2007 <strong>and</strong> 2008. In 2008, foreign <strong>in</strong>vestment <strong>in</strong> newer facilities was almost five times the expenditures<br />
<strong>in</strong>curred <strong>in</strong> acquisitions. This br<strong>in</strong>gs forward a clear preference of the foreign <strong>in</strong>vestor to start a new bus<strong>in</strong>ess set-up or<br />
fund an expansion through <strong>in</strong>fus<strong>in</strong>g fresh capital <strong>in</strong> India compared to purchas<strong>in</strong>g or atta<strong>in</strong><strong>in</strong>g a stake <strong>in</strong> an exist<strong>in</strong>g one.<br />
3.5 Profile of Greenfield FDI – India<br />
The number of greenfield <strong>in</strong>vestments <strong>in</strong> India <strong>in</strong>creased from 247 projects <strong>in</strong> 2000 to 980 projects <strong>in</strong> 2006, but decl<strong>in</strong>ed<br />
to 682 projects <strong>in</strong> 2007. Accord<strong>in</strong>g to OCO Consult<strong>in</strong>g (cited <strong>in</strong> Bloodgood, 2007, pp. 2-6), greenfield <strong>in</strong>vestment is<br />
India is largely dest<strong>in</strong>ed for new facilities rather than for expansion of exist<strong>in</strong>g un<strong>its</strong>. The share of expansion projects has<br />
been decl<strong>in</strong><strong>in</strong>g steadily over the period, from 22 per cent of the reported projects <strong>in</strong> 2002 to 11 per cent <strong>in</strong> 2006. Dur<strong>in</strong>g<br />
the period 2002 to 2006, 15 of the 300 greenfield projects that were reported exceeded $1 billion <strong>in</strong> their worth. These<br />
<strong>in</strong>vestment projects were concentrated <strong>in</strong> heavy <strong>in</strong>dustries, property, tourism <strong>and</strong> leisure, <strong>and</strong> electronics. Further, a<br />
classification based on their bus<strong>in</strong>ess function <strong>in</strong>dicates their spread among manufactur<strong>in</strong>g, construction, resource<br />
extraction <strong>and</strong> R&D. The <strong>in</strong>vestor countries <strong>in</strong>cluded Canada, Germany, Japan, Luxembourg, the Netherl<strong>and</strong>s,<br />
S<strong>in</strong>gapore, South Korea, Venezuela, the UAE, the UK <strong>and</strong> the US. The beneficiary <strong>in</strong>dustries of these greenfield<br />
<strong>in</strong>vestments <strong>in</strong>cluded a wide range of <strong>in</strong>dustries such as steel, electronic components <strong>and</strong> semiconductors, construction,<br />
m<strong>in</strong><strong>in</strong>g, real estate <strong>and</strong> mach<strong>in</strong>ery.<br />
3.6 Profile of Cross-border M&A <strong>in</strong>vestments – India<br />
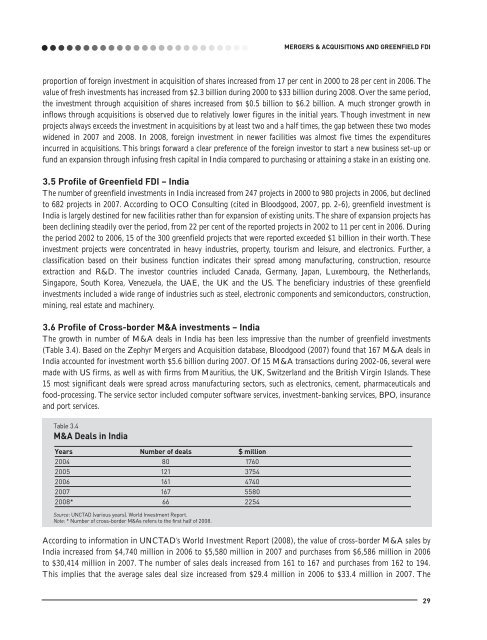
The <strong>growth</strong> <strong>in</strong> number of M&A deals <strong>in</strong> India has been less impressive than the number of greenfield <strong>in</strong>vestments<br />
(Table 3.4). Based on the Zephyr Mergers <strong>and</strong> Acquisition database, Bloodgood (2007) found that 167 M&A deals <strong>in</strong><br />
India accounted for <strong>in</strong>vestment worth $5.6 billion dur<strong>in</strong>g 2007. <strong>Of</strong> 15 M&A transactions dur<strong>in</strong>g 2002-06, several were<br />
made with US firms, as well as with firms from Mauritius, the UK, Switzerl<strong>and</strong> <strong>and</strong> the British Virg<strong>in</strong> Isl<strong>and</strong>s. These<br />
15 most significant deals were spread across manufactur<strong>in</strong>g sectors, such as electronics, cement, pharmaceuticals <strong>and</strong><br />
food-process<strong>in</strong>g. The service sector <strong>in</strong>cluded computer software services, <strong>in</strong>vestment-bank<strong>in</strong>g services, BPO, <strong>in</strong>surance<br />
<strong>and</strong> port services.<br />
Table 3.4<br />
M&A Deals <strong>in</strong> India<br />
Years Number of deals $ million<br />
2004 80 1760<br />
2005 121 3754<br />
2006 161 4740<br />
2007 167 5580<br />
2008* 66 2254<br />
Source: UNCTAD (various years). World Investment Report.<br />
Note: * Number of cross-border M&As refers to the first half of 2008.<br />
MERGERS & ACQUISITIONS AND GREENFIELD FDI<br />
Accord<strong>in</strong>g to <strong>in</strong>formation <strong>in</strong> UNCTAD’s World Investment Report (2008), the value of cross-border M&A sales by<br />
India <strong>in</strong>creased from $4,740 million <strong>in</strong> 2006 to $5,580 million <strong>in</strong> 2007 <strong>and</strong> purchases from $6,586 million <strong>in</strong> 2006<br />
to $30,414 million <strong>in</strong> 2007. The number of sales deals <strong>in</strong>creased from 161 to 167 <strong>and</strong> purchases from 162 to 194.<br />
This implies that the average sales deal size <strong>in</strong>creased from $29.4 million <strong>in</strong> 2006 to $33.4 million <strong>in</strong> 2007. The<br />
29


